Every day, thousands of traders scan NIFTY 50 (the benchmark index of the National Stock Exchange tracking 50 large-cap Indian stocks) charts, Bank Nifty Index (NSE: BANKNIFTY (the NSE index tracking the performance of the most liquid banking stocks)) candlesticks, and stock graphs looking for patterns and signals. When traders ask them how they decided to buy Reliance at ₹2,650 or sell HDFC Bank before a ₹200 drop, most will say: “Technical analysis.”
Key Takeaways
- Technical analysis studies price charts and patterns to forecast future stock price movements — no financial statements required.
- It works because market prices reflect all known information, including trader psychology, news, and institutional activity.
- The core building blocks are price charts, SUPPORT (a price level where buying pressure consistently prevents further decline) and RESISTANCE (a price level where selling pressure consistently caps upward movement), trends, and volume.
- Never use technical analysis in isolation — always combine it with risk management and a trading plan.
- Ready to start? Begin with how to read stock charts and CANDLESTICK (a type of price chart that displays the open, high, low, and close for each period) chart basics.
Technical analysis is no longer confined to Wall Street or London trading floors. It is now the primary toolkit for retail traders on the National Stock Exchange (NSE), whether they are day trading Bank Nifty, swing trading TCS, or building positions in blue-chip stocks like Infosys and Bajaj Auto.
But what exactly is technical analysis? How does it work? And more — can it actually help traders make money in the stock market?
This complete beginner’s guide answers all these questions. Traders will learn what technical analysis is, why it works, how it differs from fundamental analysis, and the exact building blocks every trader needs to master.
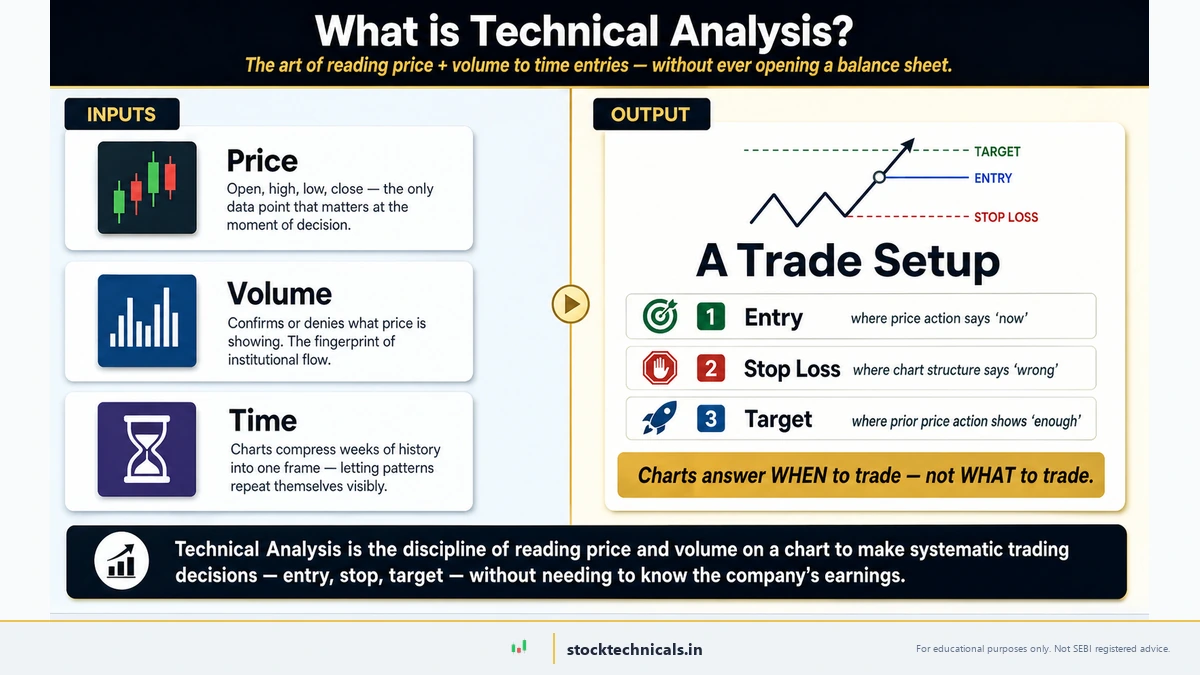
What is Technical Analysis?
Technical analysis is the practice of studying past price and volume data to predict future market movements. Instead of analyzing a company’s financial statements or management quality (fundamental analysis), technical analysts believe that all the information they need is already reflected in the price chart.
Think of it this way: when traders look at a NIFTY 50 daily chart, every tick up or down represents thousands of traders making decisions based on news, earnings, global events, and sentiment. Technical analysis assumes that this collective decision-making creates patterns that repeat over time.
The Three Core Assumptions
The Market Discounts Everything. Every piece of information — earnings reports, RBI interest rate decisions, geopolitical events, management changes — is immediately reflected in the stock price. Traders do not need to read a 50-page annual report to know if Bank Nifty will rise; the price chart already reflects what thousands of informed participants know. This is why technical analysts focus on price and volume, not financial statements. Learn more about this principle in our DOW THEORY (one of the oldest frameworks for technical analysis, based on six core tenets about market behaviour) guide.
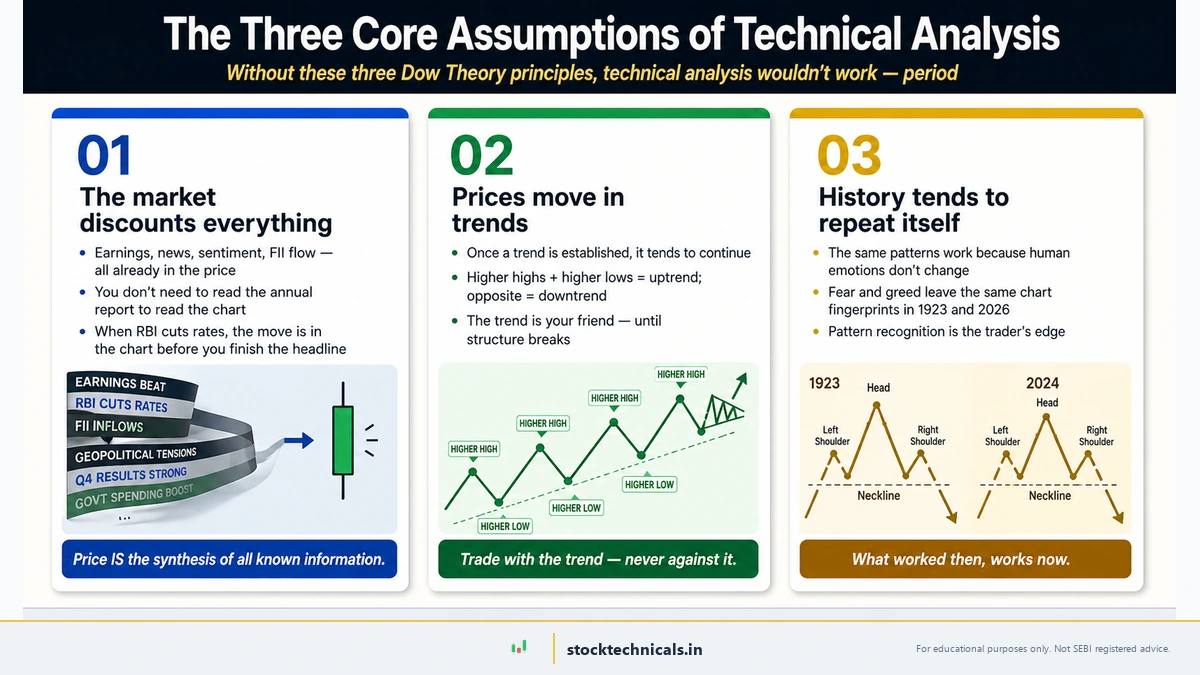
Prices Move in Trends. Once a stock starts moving in a direction, it tends to continue that way until something significant reverses it. When Reliance Industries climbed from ₹1,200 to ₹2,800 over two years, it did not move in a straight line — but the overall direction (the TREND (the overall direction of price movement — upward, downward, or sideways)) was clearly upward. Technical analysis helps traders identify these trends early and ride them using tools like trendlines and moving averages.
History Tends to Repeat Itself. Because markets are driven by human psychology — fear, greed, hope, panic — the same emotional cycles create similar chart patterns across different time periods. A HEAD AND SHOULDERS (a reversal pattern with three peaks where the middle peak is highest) pattern on Nifty in 2020 works on the same principle as one from 2015. Patterns like double tops, triangles, and ENGULFING (a two-candle reversal pattern where the second candle fully engulfs the first) candles repeat because the emotions driving them never change.
How This Differs From Guessing
Many beginners confuse technical analysis with gambling or random guessing. The difference is simple: technical analysis follows a rule-based framework. Traders define entry conditions, exit conditions, and risk parameters before placing a trade. A gambler says “I feel Nifty will go up.” A technical analyst says “Nifty is above its 200-day EMA (Exponential Moving Average, a moving average that gives more weight to recent prices), RSI (Relative Strength Index, a momentum oscillator measuring the speed of price changes on a 0-100 scale) is at 55, and price just bounced off support at 22,400 — I will enter long with a stop loss at 22,300.”
That is the difference between a system and a guess. Technical analysis gives traders a repeatable process documented in your trading plan and tracked in your trading journal.
Why Technical Analysis Works in the Stock Market
Technical analysis is not magic — it works because of specific structural characteristics that make price patterns reliable and tradeable. Here is why it is especially effective on NSE and BSE.

High Liquidity in Benchmark Indices
NSE processes over ₹1 lakh crore in daily trading volume. NIFTY 50, Bank Nifty, and top stocks like Reliance, HDFC Bank, TCS, and Infosys have massive participation from retail traders, domestic institutions (DIIs), and foreign institutional investors (FIIs). This high liquidity means price movements are smooth and chart patterns form cleanly — making technical analysis highly effective.
FII and DII Activity Leaves Visible Footprints on Charts
When FIIs pour ₹5,000 crore into Nifty futures in a single session, the chart shows clear accumulation patterns. When they suddenly pull out, the distribution is visible on the price chart days before the news explains why. Technical analysis helps traders spot these institutional footprints using volume analysis, VWAP (Volume Weighted Average Price, the average price weighted by traded volume throughout the day), and open interest data.
RBI Policy and Macro Events Create Volatility — and Chart Setups
Every RBI monetary policy announcement, union budget, quarterly earnings season, and global event creates volatility. Technical analysis does not predict what the RBI will announce — but it identifies the support and resistance levels where price is likely to react, the BREAKOUT (price moving decisively above resistance or below support with strong volume) zones that signal a new move, and the PULLBACK (a temporary price reversal within an ongoing trend before the trend resumes) opportunities after the initial reaction fades.

Technical Analysis vs Fundamental Analysis
If traders have been reading about investing, traders have probably encountered both approaches. Understanding the difference helps traders choose the right tool for the trading style. We have a detailed comparison article, but here is the essential breakdown.
| Aspect | Technical Analysis | Fundamental Analysis |
|---|---|---|
| What it studies | Price charts, volume, patterns | Financial statements, earnings, ratios |
| Data used | Historical price and volume | Balance sheet, P&L, cash flow |
| TIMEFRAME | Minutes to months | Months to years |
| Best for | Timing entries and exits | Identifying undervalued stocks |
| Key tools | Charts, indicators, patterns | PE ratio, ROE, debt-to-equity |
| Works well for | Intraday, swing, positional trading | Long-term investing |
When to Use Technical Analysis
- Intraday trading: Entering and exiting positions within the same day using 5-minute or 15-minute charts.
- Swing trading: Holding positions for days to weeks based on daily chart setups.
- Options trading: Timing entries and exits for Nifty, Bank Nifty, and stock options using technical levels.
- Timing entries: Even long-term investors use technical analysis to find better entry prices for fundamentally strong stocks.
When to Use Fundamental Analysis
- Long-term investing: Buying stocks based on earnings growth, competitive advantages, and management quality.
- Value investing: Finding undervalued companies using ratios like PE ratio, PB ratio, and debt metrics.
- Portfolio construction: Building a diversified portfolio of fundamentally sound companies across sectors.
Can Traders combine Both?
Absolutely — and many successful traders do. The approach is straightforward: use fundamental analysis to decide what to buy (a company with strong earnings, low debt, and growing revenue), then use technical analysis to decide when to buy (at a support level, after a pullback, or on a breakout with volume confirmation). This combined approach is covered in our complete framework guide.
The Building Blocks of Technical Analysis
Every technical analysis concept — from simple moving averages to complex harmonic patterns — is built on four foundational pillars. Master these and traders have the framework to understand everything else.
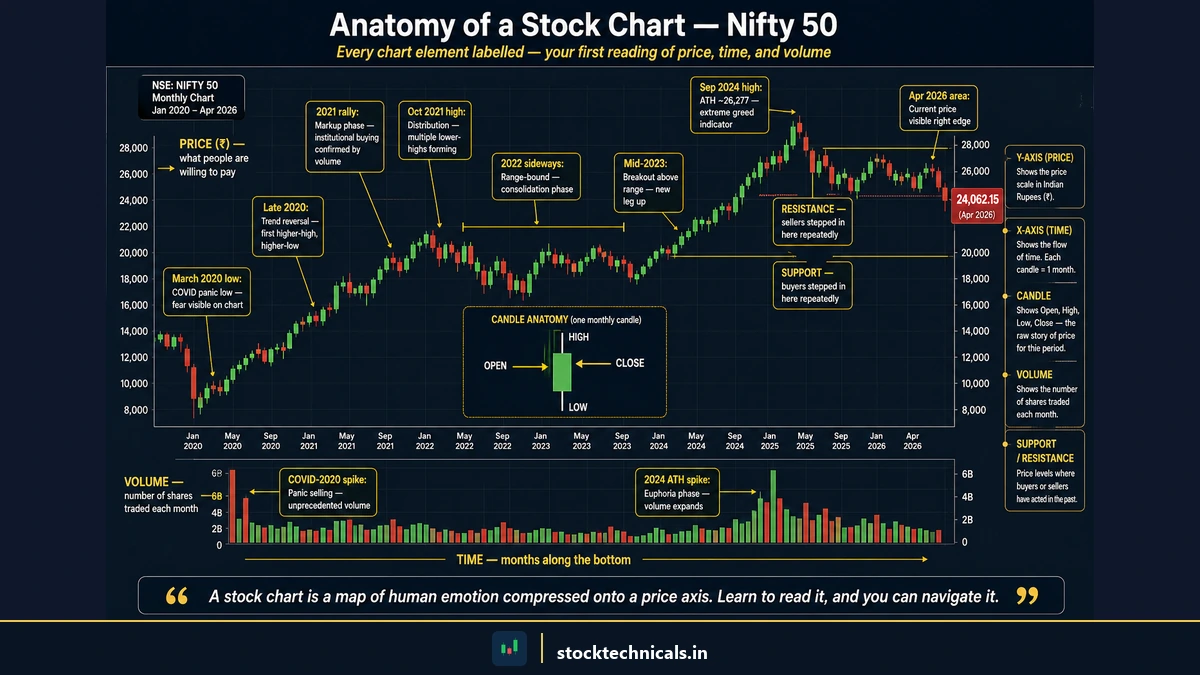
Price Charts: The Foundation
A price chart is a visual representation of a stock’s price movement over time. It is the primary workspace for every technical analyst. There are three main types of stock charts:
- Line charts connect closing prices with a single line. Simple and clean, they show the overall trend at a glance but hide intraday PRICE ACTION (the study of raw price movement on charts without relying on lagging indicators).
- Bar charts (OHLC) show the open, high, low, and close for each time period as a vertical bar with small horizontal ticks. More detailed than line charts.
- candlestick charts display the same OHLC data as colored “candles” — green (or white) for up days and red (or black) for down days. candlestick charts are the most popular choice because they reveal price psychology through patterns like DOJI (a candlestick where open and close are nearly equal, signalling indecision), HAMMER (a bullish reversal candlestick with a small body and long lower wick), and engulfing patterns.
For a step-by-step guide to setting up the first chart, read how to read stock charts and how to set up the first chart on TradingView.
Support and Resistance: The Price Levels That Matter
support is a price level where buying pressure consistently overcomes selling pressure, causing the stock to bounce upward. Resistance is the opposite — a level where selling pressure overcomes buying, pushing the price back down.
Think of support as a floor and resistance as a ceiling. When HDFC Bank repeatedly bounces off ₹1,650 and gets rejected at ₹1,750, those are the key levels. A breakout above resistance or a breakdown below support often triggers a powerful move.
Trend Lines: Drawing the Direction
A trend is simply the overall direction of price movement. Markets move in three directions: up (higher highs and higher lows), down (lower highs and lower lows), and sideways (range-bound between support and resistance).
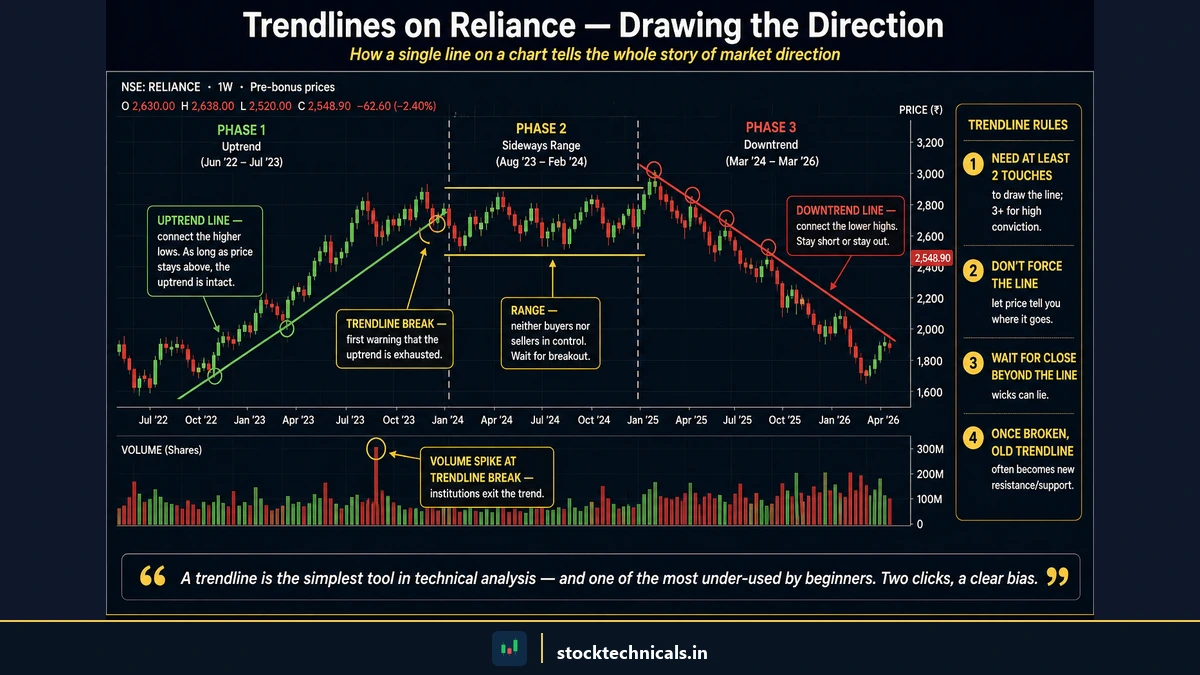
Trendlines are diagonal lines drawn along swing highs or swing lows to visualize the trend. They help traders identify when a trend is intact and when it might be reversing. The key rule: trade in the direction of the trend. Fighting the trend is one of the most common reasons beginners lose money.
Volume: The Confirmation Signal
volume measures how many shares were traded during a given period. It is the fuel behind every price move and serves as the ultimate confirmation tool:
- Rising price + rising volume = Strong bullish move (institutions are buying).
- Rising price + falling volume = Weak rally (likely to reverse).
- Falling price + rising volume = Strong selling pressure (institutions are exiting).
- Breakout + volume spike = Genuine breakout (not a false breakout).
Key Technical Indicators Every Trader Should Know
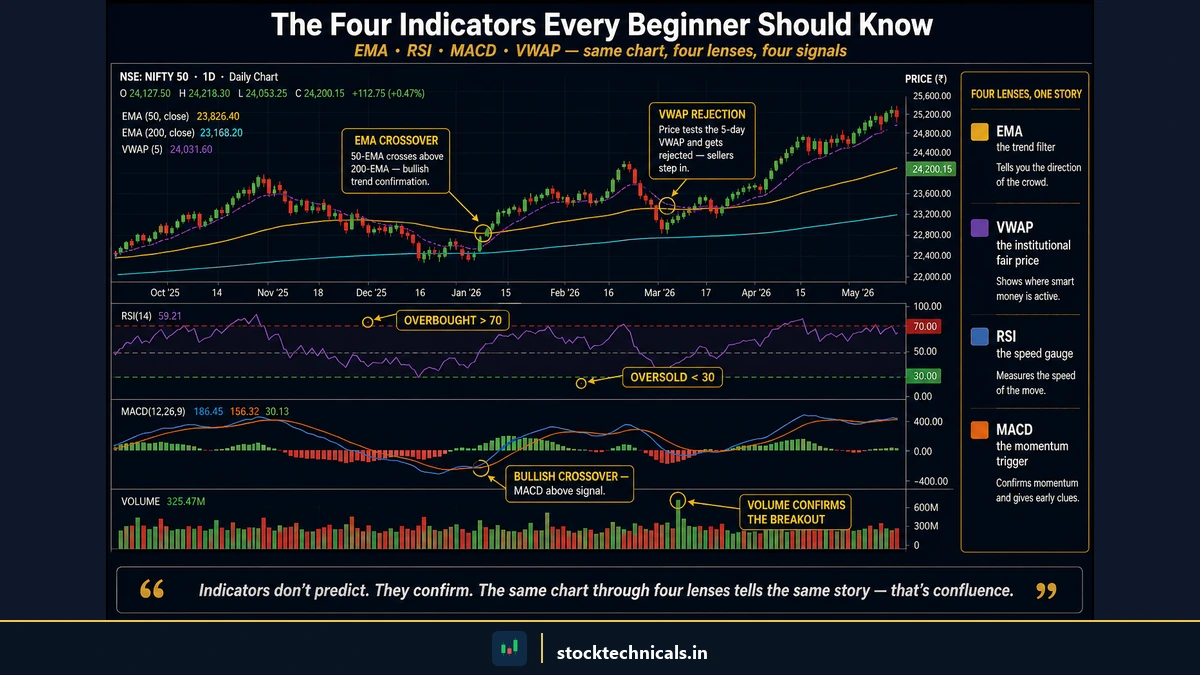
Open any NIFTY 50 chart on TradingView and traders will see a dropdown with 100+ indicators. RSI, MACD (Moving Average Convergence Divergence, a trend-following momentum indicator using two EMAs), STOCHASTIC (a momentum oscillator comparing a closing price to its price range over a set period), Ichimoku, CCI — the list is overwhelming. Here is the good news: Traders only need four to start. These four indicators cover trend direction, momentum, and fair value. Master them before touching anything else.
Moving Averages (SMA and EMA)
A moving average smooths out price data to show the underlying trend. The Exponential Moving Average (EMA) gives more weight to recent prices and reacts faster to changes. The most commonly used moving averages are the 20 EMA (short-term trend), 50 EMA (medium-term), and 200 EMA (long-term). When the 50 EMA crosses above the 200 EMA, it is called a GOLDEN CROSS (a bullish signal when a shorter-term moving average crosses above a longer-term one) — a classic bullish signal.
RSI
The RSI oscillates between 0 and 100, measuring the speed and magnitude of price changes. Readings above 70 suggest overbought conditions (potential pullback ahead), while readings below 30 suggest oversold conditions (potential bounce). Most traders use the 14-period RSI on daily and intraday charts.
MACD
The MACD tracks the relationship between two moving averages (typically the 12 and 26 EMA). When the MACD line crosses above the signal line, it generates a bullish signal. When it crosses below, it is bearish. The MACD histogram shows the strength of the current momentum — making it easier to spot when a trend is gaining or losing steam.
VWAP
Think of VWAP as the wholesale price of a stock for the day. Institutions will not buy above it — just like you would not pay retail when traders can get wholesale. On Bank Nifty’s 5-minute chart, watch what happens when price pulls back to VWAP after a morning rally. Buyers step in precisely at that level. Why? Because every mutual fund desk and FII algo uses VWAP as their execution benchmark. Trade above VWAP = bullish day. Trade below = bearish. It is that simple on liquid instruments.
The Technical Analysis Process
Have you ever stared at a Nifty chart for 20 minutes, seen a candle forming, and thought “should I buy?” — only to freeze and miss the move? That happens when traders trade without a process. Technical analysis follows a structured framework that traders can repeat for every trade, every day.
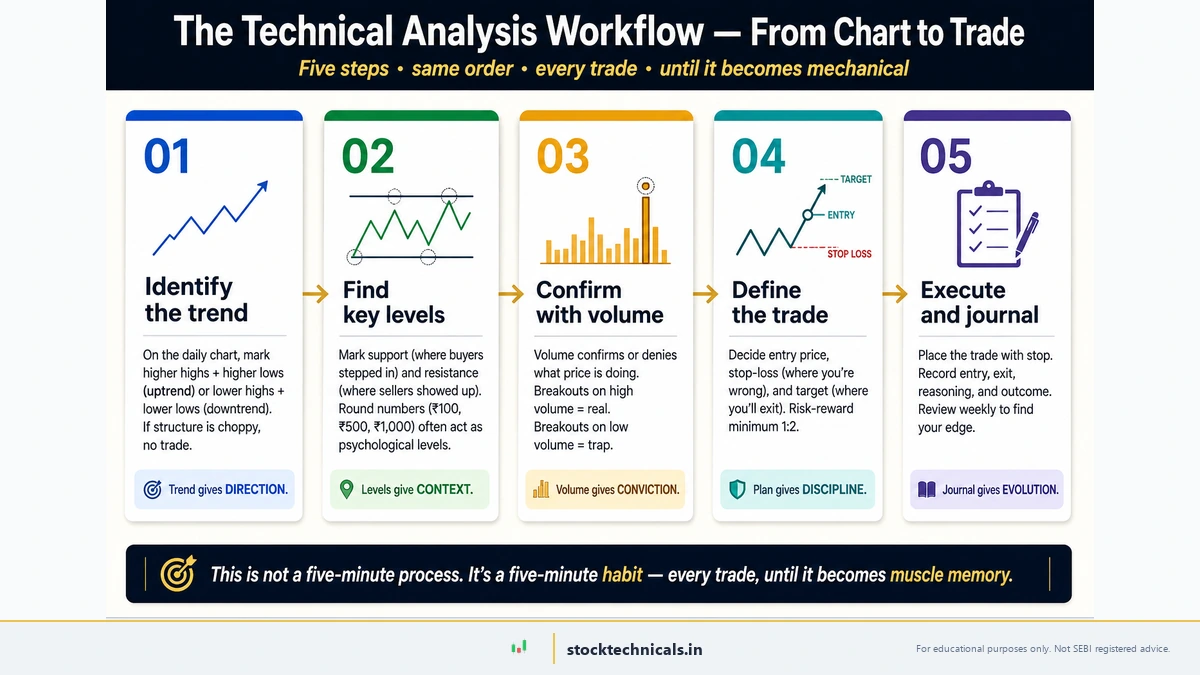
- Identify the trend — Is the stock in an uptrend, downtrend, or sideways range? Use moving averages and trendlines.
- Mark key levels — Draw support and resistance zones where price has historically reacted.
- Wait for a signal — Look for a candlestick pattern or breakout at a key level.
- Confirm with volume and indicators — Check if volume supports the move and RSI/MACD agree.
- Define risk before entry — Set your stop loss and risk-reward ratio before clicking buy.
- Manage the trade — Trail the stop loss, book partial profits, and follow your trading plan.
Use our technical analysis checklist to make sure you never skip a step before entering a trade.
How to Start Using Technical Analysis
Getting started is simpler than traders think. Traders need a brokerage account (Zerodha, Angel One, Groww, or Dhan), a charting platform like TradingView (free tier is enough to start), and a willingness to learn systematically rather than jumping into live trades.
Learn Charting Tools
Start by opening a free chart on TradingView or the broker’s platform. Learn how to switch timeframes (daily, hourly, 15-minute), add indicators (start with a 200 EMA and volume), and draw horizontal lines at support/resistance levels. Our TradingView setup guide walks you through every step.
Learn Candlestick Patterns First
candlestick patterns are the language of the market. Start with single-candle patterns like the doji (indecision), hammer (bullish reversal), and SHOOTING STAR (a bearish reversal candlestick with a small body and long upper wick) (bearish reversal). Then move to two-candle patterns like engulfing patterns and three-candle patterns like MORNING STAR (a three-candle bullish reversal pattern forming at the bottom of a downtrend) and EVENING STAR (a three-candle bearish reversal pattern forming at the top of an uptrend). These patterns tell you what buyers and sellers are doing at critical price levels.
Practice Paper Trading
Before risking real money, practice with paper trading. Most platforms offer virtual trading accounts where traders can test the strategies with fake money but real market data. Spend at least 2-3 months paper trading. Track every trade in a journal. If traders cannot make consistent profits on paper, traders will not make them with real money either.
Start With High-Liquidity Instruments
Begin the live trading journey with NIFTY 50, Bank Nifty, or large-cap stocks like Reliance, TCS, HDFC Bank, and Infosys. These have tight bid-ask spreads, high volume, and clean chart patterns. Avoid penny stocks and illiquid mid-caps — their charts are noisy, easily manipulated, and technical analysis is unreliable on them. Learn more about choosing the right instruments in our types of trading guide.
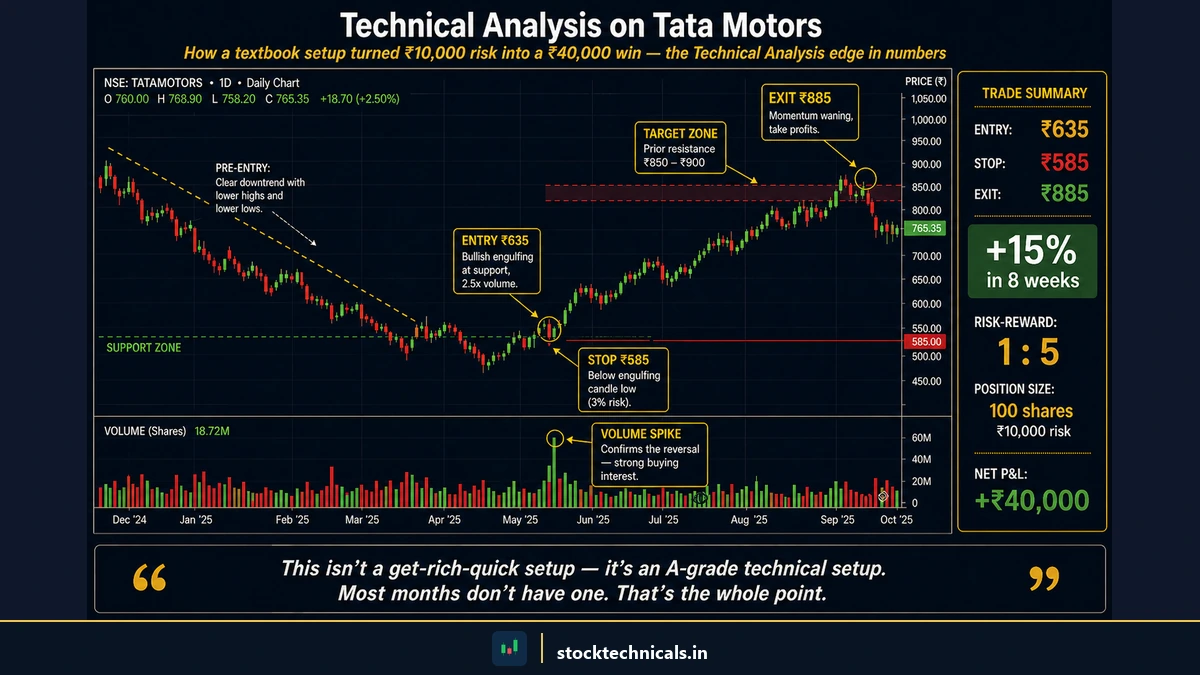
Data Verification: All charts in this article use real NSE daily OHLC data, verified against TradingView.
Common Mistakes Beginners Make
After teaching technical analysis to thousands of beginners, these are the mistakes that come up again and again. Avoid these and traders will already be ahead of 90% of new traders.
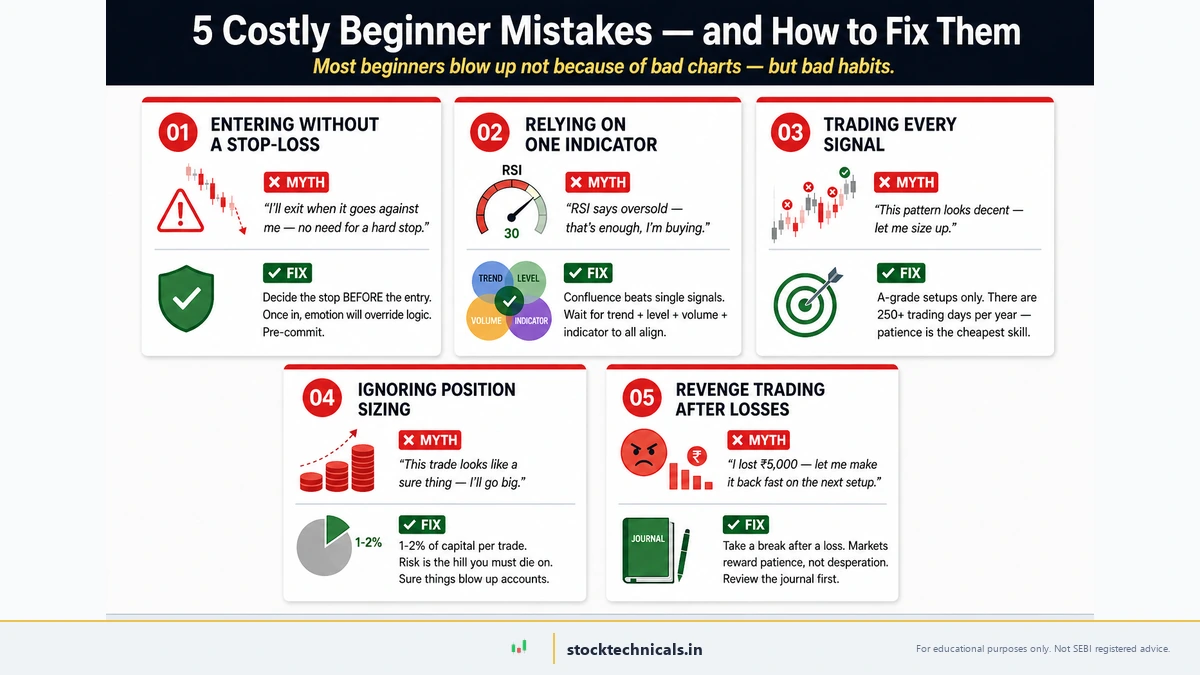
- Using too many indicators at once. Adding 10 indicators to one chart creates confusion, not clarity. Start with 2-3 and master them. price action + one momentum indicator + volume is enough.
- Ignoring the trend. Buying a stock in a strong downtrend because RSI shows “oversold” is one of the fastest ways to lose money. Always trade with the trend, not against it.
- Trading without a stop loss. Every trade must have a predefined exit point. Stop loss strategies protect trading capital from catastrophic single-trade losses.
- Ignoring volume. A breakout without volume is a false breakout. volume confirms or denies what price is telling you.
- Expecting 100% accuracy. No strategy wins every trade. A 55-60% win rate with a 1:2 risk-reward ratio is highly profitable over time. Focus on the process, not individual trade outcomes.
- Skipping paper trading. Going live without practice is like performing surgery without medical school. The market will teach you — but the tuition is expensive.
Risk Reality Check: Every setup in this article can and will fail. That is not a flaw — it is how trading works. The edge comes from the R:R ratio, not the win rate. Risk no more than 1-2% of capital per trade. This way, even five consecutive losses only cost 5-10% — leaving traders with 90% of capital and the ability to recover. The traders who survive year one are the ones who sized their positions correctly.
Read our technical analysis myths busted article for more misconceptions that trip up beginners.
Is Technical Analysis Enough to Make Money?
Technical analysis is a powerful tool, but it is only one piece of the puzzle. Consistently profitable trading requires three components working together.
Risk Management — Never risk more than 1-2% of the trading capital on a single trade. Use stop losses, maintain proper position sizing, and always know your risk-reward ratio before entering. This is what keeps traders in the game when a string of losses hits — and they will hit.
Trading Plan — Document the strategy, entry rules, exit rules, and risk parameters. Trade the plan, not trading emotions. A trading plan removes the “should I hold or sell?” panic during live trades because the decision is already made.
Trading Psychology — Fear makes traders exit winning trades too early. Greed makes traders hold losing trades too long. Controlling these emotions is the hardest part of trading — and the most important. Avoid revenge trading after losses and overtrading during winning streaks.
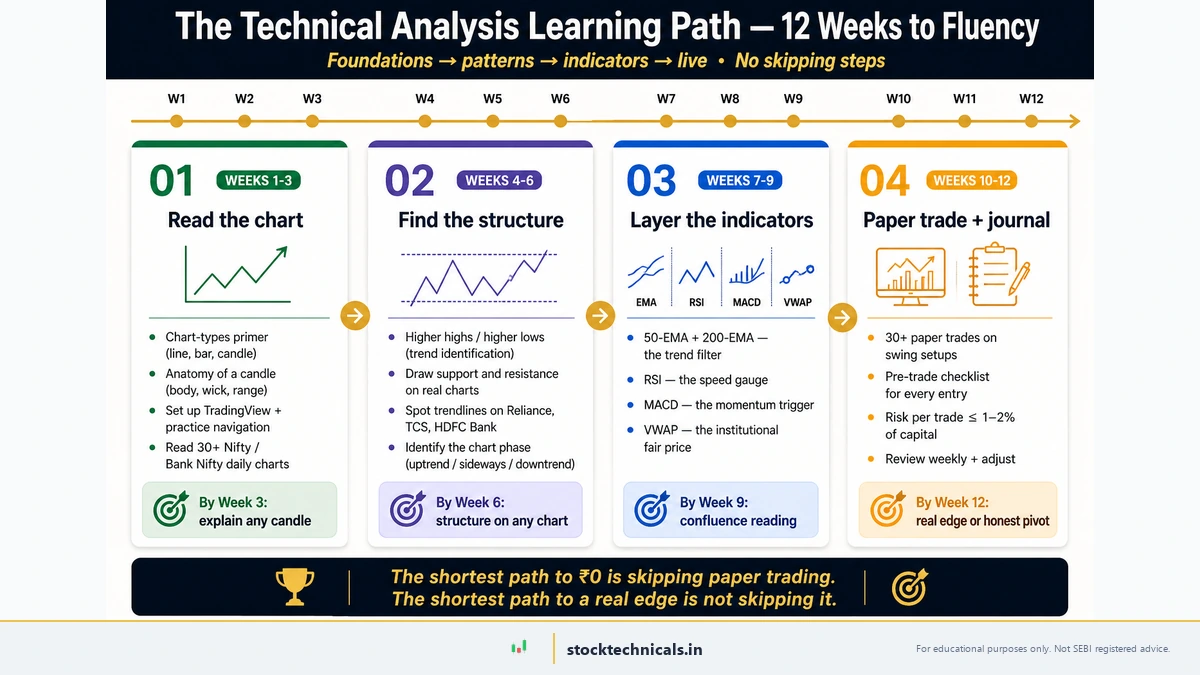
The Technical Analysis Learning Path
Now that traders know what technical analysis is, what tools traders need, and what mistakes to avoid — here is exactly where to start learning. StockTechnicals.in is designed as a structured path. Follow this order to build the skills from zero to confident trader.
- Chart Basics — How to read stock charts → Types of stock charts → Timeframes in trading
- Candlestick Patterns — What are candlestick charts → Bullish patterns → Bearish patterns → doji → hammer and HANGING MAN (a bearish reversal candlestick at the top of an uptrend with a long lower wick)
- Price Structure — Trends → Trendlines → support and resistance → volume
- Indicators — EMA basics → RSI → MACD → VWAP → BOLLINGER BANDS (a volatility indicator with three lines: a moving average and two standard deviation bands)
- Chart Patterns — head and shoulders → Double tops and bottoms → Triangles → Flags and pennants
- Risk and Psychology — Risk management → Stop loss strategies → Trading psychology → Trading plan
Start Reading Charts This Week
93% of intraday traders lose money. That is not a scare statistic — it is the trading edge. Those traders lost because they skipped the education, ignored risk management, and traded on WhatsApp tips. Traders are reading this article. Traders already know about support zones, trend confirmation, and why volume matters. The 7% who profit? They all started exactly where traders are right now. The difference is what traders do next.
The next step: open TradingView, pull up a NIFTY 50 daily chart, add the 200 EMA, and start looking for the patterns you learned about today. Within a week, traders will start seeing the market differently.
Useful External Resources
- Investopedia: Technical Analysis Explained
- NSE India: Live Market Data
- SEBI Investor Education Portal
- TradingView: Free Charting Platform
- Zerodha Varsity: Free Trading Education
The Bottom Line About Technical Analysis
Technical analysis is not magic, and it is not a secret code that opens up free money. The SEBI FY24-25 comparative study confirms 91 percent of individual equity F&O traders in India lost money, with aggregate losses of ₹1.06 lakh crore. Most of them were using exactly the same charts, indicators, and patterns this article explains.
Technical analysis gives traders a framework for reading the market, timing entries, and setting risk levels. It does not give them the discipline to wait for a high-probability setup, the courage to honour a stop-loss, or the patience to let winners run. The gap between the 9 percent who survive and the 91 percent who do not is rarely about which moving average they use — it is about whether they follow a written trading plan and stick to their risk rules on every single trade.
This article is the toolkit. The edge is built on top of it through practice, journaling, and the willingness to learn from losing trades. Nobody becomes profitable by reading one guide. The honest goal of this article is to give traders a correct starting map so they do not waste the first two years on bad mental models.
Test Your Knowledge
Q1: What does technical analysis primarily study to predict future price movements?
Q2: A trader notices Reliance shares forming a pattern on the chart that previously led to a price rise. Which principle of technical analysis does this illustrate?
Q3: Which of the following is NOT an assumption of technical analysis?
Q4: If NIFTY 50 drops 200 points after RBI announces a rate hike, a technical analyst would say the price drop already reflects:
Q5: A beginner wants to start trading on NSE. Why might they choose technical analysis over fundamental analysis first?
Frequently Asked Questions
What is the main purpose of technical analysis?
Technical analysis helps traders predict future price movements by studying historical price charts, volume data, and technical indicators. It focuses on patterns in price action rather than company financials.
Can I use technical analysis for trading on NSE?
Yes. Technical analysis works especially well on NSE due to high liquidity in Nifty 50, Bank Nifty, and large-cap stocks like Reliance, HDFC Bank, TCS, and Infosys. High volume creates cleaner chart patterns.
Is technical analysis better than fundamental analysis?
Neither is universally better. Technical analysis excels at timing entries and exits for short-to-medium term trades. Fundamental analysis is better for long-term stock selection. Many successful traders combine both approaches.
What tools do I need to start technical analysis?
A free TradingView account and your broker platform (Zerodha Kite, Angel One, etc.) are enough. You need charts, candlestick data, and basic indicators like EMA, RSI, and VWAP to get started.
How long does it take to learn technical analysis?
The basics like chart reading, support and resistance, and trendlines can be learned in 2-4 weeks. Becoming consistently profitable takes 6-12 months of practice including paper trading and maintaining a trading journal.
Continue Learning
- Read this next: How to Read Stock Charts — turn a blank chart into a trade setup in under 60 seconds.
- For chart fundamentals: Types of Stock Charts and Candlestick Charts — the visual language every TA trader must speak.
- For method comparison: Technical Analysis vs Fundamental Analysis — when to use each approach and why the best traders use both.
- For trend traders: What is a Trend? and Trendlines — the foundation of every directional trade.
- For pattern recognition: Bullish Candlestick Patterns and Bearish Candlestick Patterns — the most common entry and exit signals.
- For the honest conversation: Doji Candles — the indecision signal most beginners misread.
The next step: set up a free TradingView chart and spend 20 minutes every day reading NIFTY 50 and a few liquid individual stocks. Build the eye first, then layer indicators on top. That is how every profitable technical trader started.
Markets are brutal, capital is finite, and no single trade should risk more than 2 percent of the account. Technical analysis is a framework for reading price — not a substitute for a trading plan, a stop-loss, or the patience to wait for a high-probability setup.