Most traders lose money not because their analysis is wrong, but because they skip steps. They spot a pattern, get excited, and hit buy — without checking the trend, confirming with volume, or even setting a stop-loss. The SEBI study confirming that 93% of individual traders in equity futures and options incurred losses between FY 2022 and FY 2024 is not about bad strategies. It is about undisciplined execution.
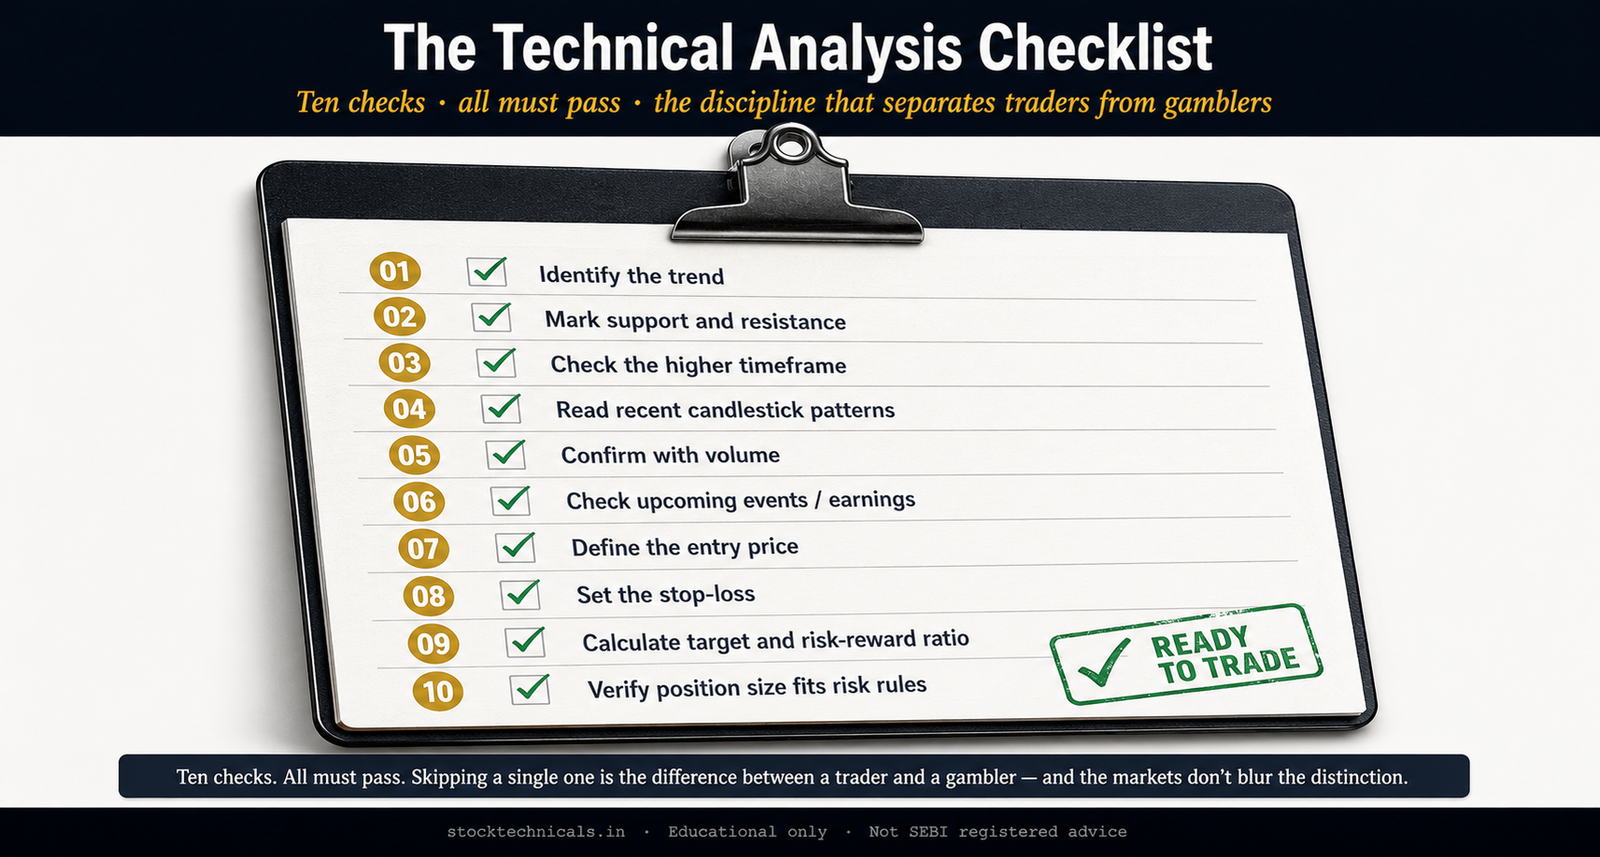
Quick Answer: A technical analysis checklist is a fixed sequence of ten checks every trade must pass before capital is deployed — trend, support and resistance, higher timeframe alignment, candlestick context, volume confirmation, upcoming events, entry price, stop-loss, risk-reward, and position size. If even one check fails, the trade is skipped. The SEBI study confirming 93 percent of individual F&O traders lost money between FY22 and FY24 is not a strategy problem; it is a discipline problem that a repeatable pre-trade checklist solves.
Published January 15, 2026 · Last refreshed April 27, 2026. Prices and data are compiled with reasonable care — always confirm against your broker before trading.
A technical analysis checklist is the solution. It is a fixed set of checks that every trade must pass before capital is deployed. No exceptions. No shortcuts. If even one check fails, the trade gets skipped.
This article lays out a complete ten-point checklist that covers everything — from trend identification to position sizing. Each point includes what to check, how to check it, what a pass looks like, what a fail looks like, and a real NSE example verified against actual market data. By the end, every trader will have a repeatable process that removes emotion and forces discipline.
Key Takeaways
- A pre-trade checklist forces discipline and removes emotional decision-making — the single biggest account killer for beginners.
- All ten checks must pass before any trade. Nine out of ten is not enough. The one check that failed is often the one that causes the loss.
- Every price, volume, and indicator value in this article comes from NSE (daily OHLC) data — nothing is made up or rounded for convenience.
- The checklist works across all trading styles: intraday, swing, and positional. Only the timeframes change; the ten-point structure stays the same.
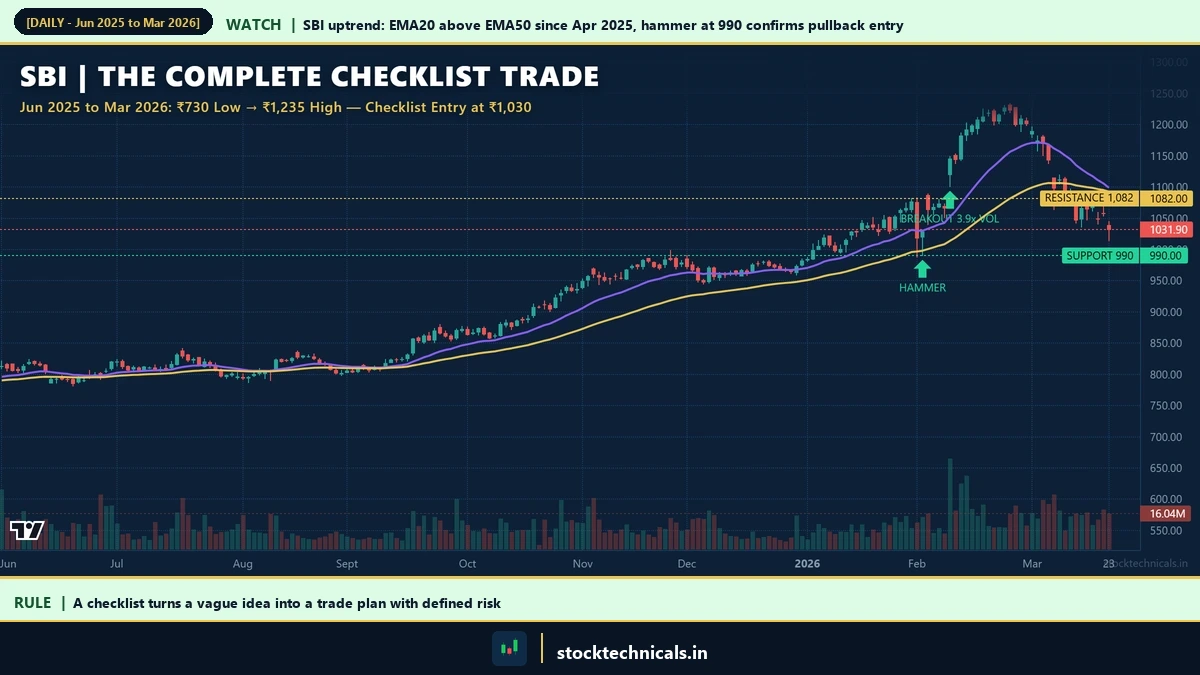
- A complete SBI trade walk-through at the end of this article shows all ten checks applied to a real setup — from hammer pattern at ₹990 support to breakout at 3.9 times average volume.
Why Every Trader Needs a Pre-Trade Checklist
Airline pilots use checklists before every flight. Surgeons use checklists before every operation. These are high-stakes professions where a single missed step can be catastrophic. Trading is no different — one undisciplined entry can wipe out weeks of profits.
A checklist does three critical things:
Removes emotional decision-making. When SBI (NSE: SBIN) dropped from ₹1,077.15 to ₹988.30 in a single session on February 1, 2026, many traders saw a “buying opportunity.” The checklist forces a pause. Is the trend actually up? Does volume confirm the reversal? Is there a support level nearby? Without a checklist, the answer is whatever the gut says. With a checklist, the answer is objective.
Creates consistency. The difference between professional traders and amateurs is not intelligence — it is process. A checklist ensures that every trade goes through the same evaluation, whether the trader is confident or nervous, whether the market is calm or volatile.
Prevents the biggest account killers. Revenge trading, oversizing positions, chasing breakouts without confirmation, entering trades with no stop-loss — every one of these mistakes happens because a step was skipped. A checklist makes skipping impossible.
The checklist below has ten points. Not five, not twenty — ten. Enough to cover every critical aspect of a trade setup, few enough to complete in under five minutes. With practice, the entire process becomes automatic.
The Ten-Point Technical Analysis Checklist
Identify the Trend
What to check: Is the stock in an uptrend, downtrend, or range? The trend determines the direction of the trade. Trading against the trend is one of the fastest ways to lose money.
How to check it: Open the daily chart on TradingView. Apply the 20-period and 50-period exponential moving averages. If price is above both EMAs and the 20 EMA is above the 50 EMA, the trend is up. If price is below both and the 20 EMA is below the 50 EMA, the trend is down. If the EMAs are flat and intertwined, the stock is ranging.
Pass: Clear trend direction — either consistently higher highs and higher lows (uptrend) or lower highs and lower lows (downtrend). The EMAs are separated and sloping in the same direction.
Fail: EMAs are flat, crossing each other repeatedly. Price is chopping above and below both averages with no clear direction. The stock is range-bound, and trend-following strategies will get whipsawed.
Example (PASS): SBI from April 2025 to February 2026. The stock rallied from ₹730.00 (April 7, 2025 low) to ₹1,234.70 (February 24, 2026 high). The 20 EMA crossed above the 50 EMA on April 22, 2025 at ₹822.40 and stayed above for the entire move. Every pullback held above the rising 50 EMA. Clear uptrend — check passed.
Example (FAIL): Reliance Industries from January to April 2026. The stock dropped from ₹1,611.80 (January 5, 2026 high) to ₹1,304.60 (April 7, 2026 close). The 20 EMA stayed below the 50 EMA throughout. Every rally got rejected at the falling 20 EMA. Clear downtrend — buying dips here without a trend reversal signal would have failed this check.
For a complete understanding of how trends work, read the guide on what is a trend and how to draw and use trendlines.
Mark Support and Resistance Levels
What to check: Where are the nearest support and resistance levels? These are the price zones where buying and selling pressure has historically been concentrated. A trade entered right into a resistance zone (for longs) or a support zone (for shorts) has a poor risk-reward profile.
How to check it: On the daily chart, identify the most recent swing highs and swing lows. These are the levels where price reversed direction. Mark the two nearest support levels below the current price and the two nearest resistance levels above it. Also check for round numbers (₹500, ₹1,000, ₹1,500) — these act as psychological support and resistance.
Pass: Current price is near a support level (for long trades) or near a resistance level (for short trades), with clear space to the next level in the trade direction. The target is at least twice the distance of the stop-loss.
Fail: Price is stuck in the middle of a range — far from both support and resistance. Or price is approaching a major resistance level (for longs) with very little upside room before the next wall.
Example: Tata Steel from June to December 2025. The stock showed three distinct support zones: ₹149.80 (June low), ₹153.70 (September low), and ₹160.06 (December low). Resistance sat at ₹168.78 (July high) and ₹186.94 (October high). A long entry near the ₹154-₹160 support zone with a target at ₹169 or ₹185 offered clear risk-reward. Entering at ₹170 — halfway between support and resistance — would have been a poor location with no room to run before hitting the next wall.
Detailed look into identifying these levels: support and resistance complete guide and how to draw support and resistance levels.
Check the Higher Timeframe
What to check: Is the higher timeframe aligned with the trade direction? A buy signal on the 15-minute chart means nothing if the daily chart is in a strong downtrend. The higher timeframe always wins.
How to check it: If trading on the 5-minute or 15-minute chart, check the daily chart for trend direction. If swing trading on the daily chart, check the weekly chart. The rule is simple: the trade direction on the lower timeframe must agree with the trend on the higher timeframe. This is called multi-timeframe analysis.
Pass: The higher timeframe trend supports the trade. A long setup on the daily chart aligns with an uptrend on the weekly chart. The EMAs on both timeframes point in the same direction.
Fail: Conflicting signals. The daily chart shows a bullish setup, but the weekly chart shows a strong downtrend with the 20 EMA below the 50 EMA. The daily signal is likely a temporary bounce, not a trend reversal.
Example: SBI weekly chart from October 2025 to March 2026. The weekly 20 EMA stayed above the weekly 50 EMA throughout this entire period, confirming that the long-term uptrend was intact. When SBI pulled back on the daily chart in late January and early February 2026 (dropping from ₹1,082.50 to ₹988.30), the weekly chart showed this was just a pullback within a healthy uptrend — not a trend reversal. This gave permission to look for a daily long entry.
Understanding timeframes is foundational — read about timeframes in trading and types of trading to match the right timeframe to the right strategy.
Read Recent Candlestick Patterns
What to check: What are the last three to five candles telling about buyer and seller behaviour? Candlestick patterns reveal short-term sentiment shifts that can confirm or deny a trade setup.
How to check it: Look at the most recent candles at the key level identified in the support and resistance check. At a support level, look for bullish patterns: hammer, bullish engulfing, morning star. At a resistance level, look for bearish patterns: shooting star, bearish engulfing, evening star. The pattern should form at the key level — a hammer in the middle of a range means nothing.
Pass: A recognisable reversal pattern has formed at a key support or resistance level. The pattern shows clear rejection — long lower wicks at support (buyers stepping in) or long upper wicks at resistance (sellers defending). The pattern aligns with the trend direction from the first check.
Fail: No clear pattern at the key level. Or the candles show indecision — small bodies, equal wicks on both sides (doji candles appearing repeatedly). Or a bearish pattern is forming at a level where a long trade is planned.
Example: SBI on February 2, 2026 near the ₹990 support zone. A textbook hammer candle formed: Open ₹1,019.90, High ₹1,031.30, Low ₹990.00, Close ₹1,028.70. The lower wick measured 29.90 points — 3.4 times the body of 8.80 points. The upper wick was just 2.60 points. This showed buyers stepping in aggressively at the ₹990 level, rejecting the low and pushing price back above ₹1,020 by close. This candlestick confirmation, combined with the pre-existing support zone, satisfied the fourth check.
For pattern recognition skills, study bullish candlestick patterns and bearish candlestick patterns. The hammer and hanging man guide covers the specific patterns mentioned here.
Confirm with Volume
What to check: Is volume confirming the move? Price moves without volume are unreliable. A breakout on low volume is likely a trap. A reversal candle with high volume is far more meaningful than one on thin volume.
How to check it: Compare the volume on the signal candle (the breakout candle, the reversal candle, or the entry candle) with the trailing 20-day average volume (computed using the 20 trading days before the signal day — not including the signal day itself). The signal candle should have at least 1.5 times the average volume for reversals and at least 2 times for breakouts. On TradingView, add the Volume indicator and visually compare the bars.
Pass: The signal candle or breakout candle has volume significantly above the 20-day average. For breakouts, the breakout candle should have at least 2 times the average volume. For reversal patterns, 1.5 times is sufficient.
Fail: Volume is below average on the signal candle. A breakout happens on the thinnest volume of the week. A bullish engulfing pattern forms, but volume is 40% below the 20-day average. Low volume signals lack of conviction — the move is more likely to reverse.
Example: Tata Steel on October 28, 2025. The stock closed at ₹181.81, breaking above the 20-day high of ₹177.90. Volume on the breakout day was 59,511,794 shares — 2.5 times the trailing 20-day average of approximately 24 million shares. That volume surge confirmed that institutional buyers were participating, not just retail traders. The stock continued to ₹186.94 the next day.
Volume is one of the most underrated tools — the complete guide on volume in trading explains why it matters and how to read it.
Check for Upcoming Events and Earnings
What to check: Are there any scheduled events that could cause extreme volatility in the next one to three trading sessions? Events include: quarterly earnings announcements, RBI monetary policy decisions, Union Budget, SEBI circular implementations, monthly futures and options expiry, and company-specific events (AGMs, board meetings, stock splits).
How to check it: Check the NSE website for upcoming corporate actions. Check the RBI calendar for policy dates. For futures and options traders, note the monthly expiry date and weekly Nifty and Bank Nifty expiry (every Tuesday since NSE moved weekly expiry from Thursday to Tuesday on September 1, 2025). For intraday traders, check if any major global event (US Federal Reserve decision, US jobs data) falls before the next Indian market open.
Pass: No major event scheduled within the holding period of the trade. Or if an event is scheduled, the trade is specifically designed to trade that event (with wider stops and smaller position size).
Fail: Quarterly results are scheduled for the next day, and the trade is a standard directional bet. RBI policy is tomorrow, and the trade is a leveraged Nifty position. Futures and options expiry is today, and the trade involves selling options near at-the-money strikes. These scenarios add uncontrollable risk.
Example: HDFC Bank in mid-October 2025. The stock was trading near ₹978 on 15 October when Q2 FY26 results were due within days. By 17 October, the stock had moved to ₹1,002.55, and on 23 October, volume surged to 43.5 million shares (2 times the 20-day average). A trader planning a swing trade on HDFC Bank on 14 October without checking the earnings calendar would have been exposed to a potential gap in either direction.
This step connects to the broader understanding of what is a breakout — because earnings and events often cause the biggest breakouts (and the biggest traps).
Define the Entry Price
What to check: What is the exact price at which the trade will be entered? A vague “buy somewhere around this level” is not a trade plan. The entry must be a specific price with a specific trigger.
How to check it: Based on the setup identified in the first six checks, define the entry trigger. Common entry triggers include:
- Breakout entry: Price closes above resistance level on the signal candle (not just a wick above).
- Pullback entry: Price pulls back to the 20 EMA or a key support level and shows a bullish candle.
- Pattern entry: Enter on the close of the confirming candle (the second candle in an engulfing pattern, or the third candle in a morning star).
Pass: The entry price is specific, the trigger condition is clear, and the entry is at a level that gives a favourable risk-reward ratio. The entry is not chasing — the trade is being entered near a support level or on a confirmed breakout.
Fail: The entry is vague — “buy if it looks like it is going up.” Or the entry is at market price after a candle has already moved 2% from the trigger level (chasing). Or the entry is at a price that puts the stop-loss too far away, making the risk-reward unfavourable.
Example: On SBI in early February 2026, the entry trigger was: “Buy at ₹1,030 — near the 2 February hammer close of ₹1,028.70 — if the next session confirms with a close above ₹1,020 and volume above 12 million shares.” This is specific, measurable, and conditional. The 3 February session confirmed: SBI opened at ₹1,087.00, closed at ₹1,064.20 with 16.1 million shares (1.6 times average). Confirmation delivered.
The concept of precise entries connects directly to understanding what is a pullback and how breakouts work.
Set the Stop-Loss
What to check: Where will the trade be exited if it goes wrong? The stop-loss is the price at which the loss is accepted and the position is closed. Every single trade must have a stop-loss before entry — no exceptions.
How to check it: The stop-loss should be placed at a level where the trade setup is invalidated. Common stop-loss placements:
- Below the swing low for long trades (the most recent swing low that supports the trade thesis).
- Below the key support level with a small buffer (support minus 0.5% to 1% to avoid stop-hunting by institutions).
- Below the signal candle’s low for pattern-based entries (below the hammer’s low, below the engulfing candle’s low).
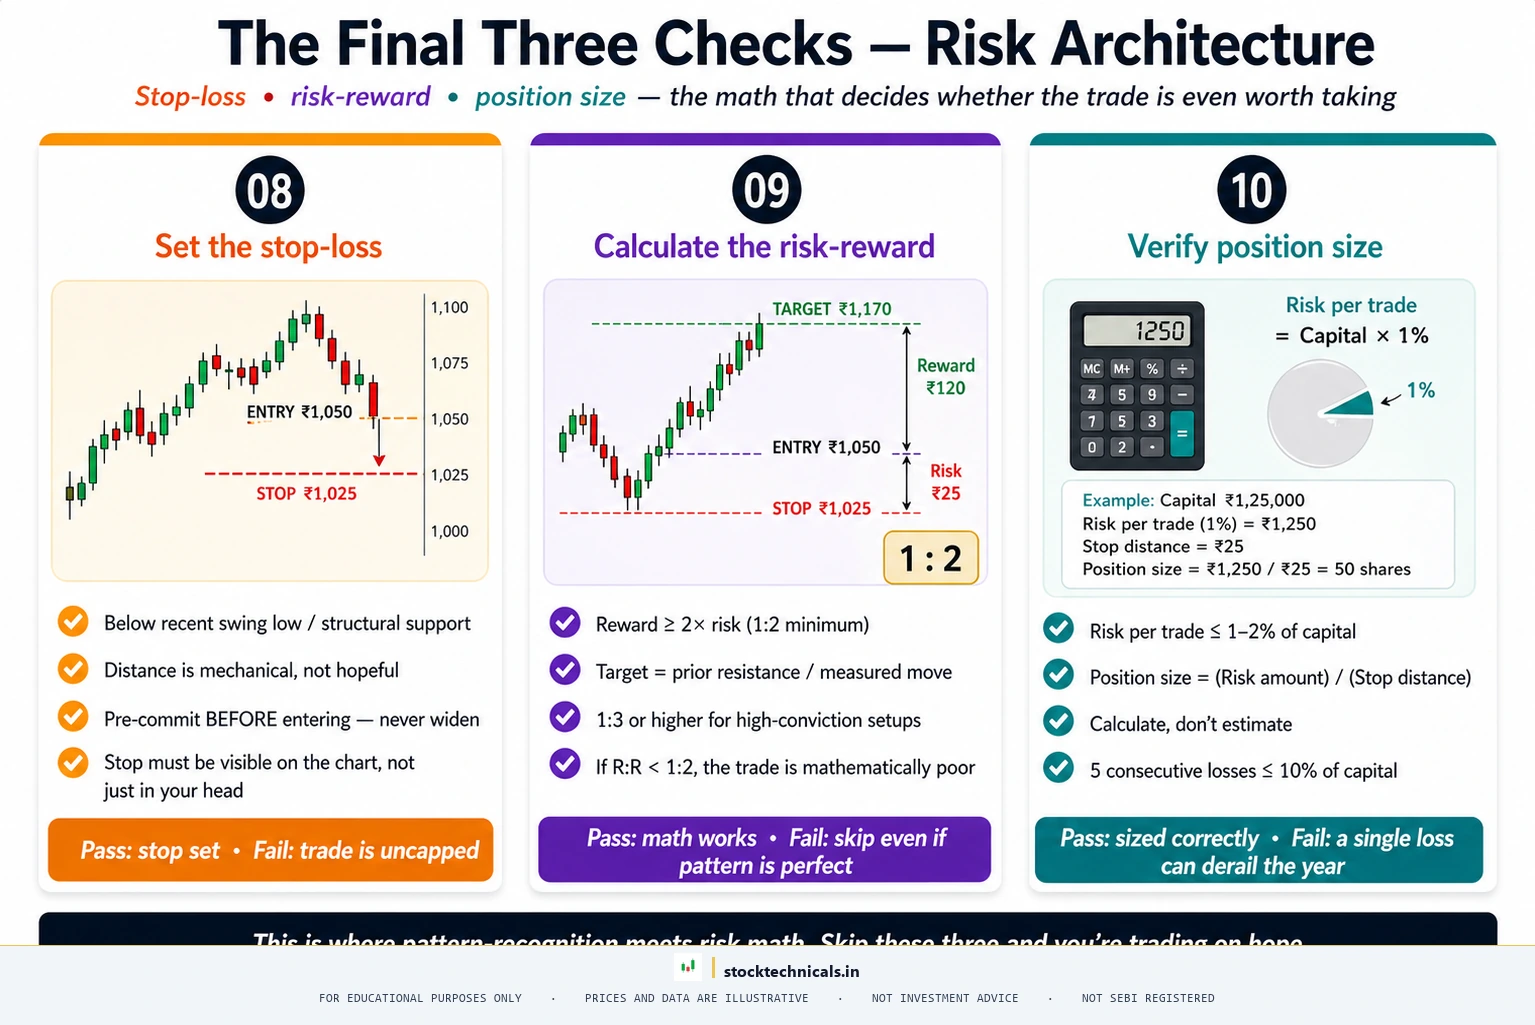
Pass: The stop-loss is at a logical level that invalidates the trade thesis if hit. The distance from entry to stop-loss results in a risk of no more than 1% to 2% of trading capital. The stop-loss is not so tight that normal price noise will trigger it.
Fail: No stop-loss planned. Or the stop-loss is placed at an arbitrary round number with no technical justification. Or the stop-loss is so far from entry that hitting it would cause a 5%+ portfolio loss on a single trade.
Example: For the SBI long trade entered at ₹1,030, the stop-loss sits below the hammer low of ₹990.00 — specifically at ₹985, giving a 5-point buffer below the tested support to avoid getting stopped out by a quick wick. The risk per share is 45 points (₹1,030 minus ₹985). If the stop-loss is hit, the trade thesis is invalidated — the ₹990 support has broken.
Stop-loss strategies are covered in detail in the Dow Theory guide which explains how swing points define trend structure.
Calculate the Target and Risk-Reward Ratio
What to check: What is the profit target, and does the risk-reward ratio justify the trade? The minimum acceptable risk-reward ratio is 1:2 — meaning for every ₹1 risked, the potential reward is at least ₹2.
How to check it: Identify the nearest resistance level (for longs) or support level (for shorts) in the trade direction. This is the first target. Calculate: Risk = Entry Price minus Stop-Loss. Reward = Target minus Entry Price. The ratio is Reward divided by Risk. If the ratio is below 1:2, the trade should be skipped — even if everything else checks out.
Pass: The risk-reward ratio is at least 1:2, preferably 1:3. The target is at a logical resistance level (for longs) identified on the chart. The target does not require the stock to break through multiple resistance levels to be reached.
Fail: The risk-reward ratio is below 1:2. The nearest resistance is only 15 points away, but the stop-loss is 30 points below entry. Or the target requires the stock to break through three resistance levels — unrealistic for a single move.
Example: Continuing the SBI setup. Entry: ₹1,030. Stop-loss: ₹985. Risk = 45 points. The target was set at ₹1,150. Reward = 120 points (₹1,150 minus ₹1,030). Risk-reward ratio = 120 divided by 45 = 2.67:1. This passes the 1:2 minimum comfortably.
If the target had been only ₹1,060 (reward = 30 points) against the same 45-point risk, the ratio would be 0.67:1 — a hard fail. A ratio below 1:1 means the trader loses more than they gain even with a 50% win rate. Over 100 trades, that math is devastating.
Verify Position Size Fits Risk Rules
What to check: Does the position size ensure that if the stop-loss is hit, the loss stays within the maximum risk limit? Most professional traders risk no more than 1% to 2% of their total trading capital on any single trade. This is the position sizing rule that keeps accounts alive through losing streaks.
How to check it: Use this formula:
Position Size (shares) = Account Risk Amount divided by (Entry Price minus Stop-Loss)
Where Account Risk Amount = Total Trading Capital multiplied by Maximum Risk Percentage (typically 1% to 2%).
Pass: The calculated position size results in a total risk that is 1% to 2% of the trading account. The trader can afford the position without using excessive leverage or margin.
Fail: The calculated position demands more capital or margin than available. Or the trader is tempted to increase position size because the setup “looks really good.” Or the risk per trade exceeds 2% of the account.
Example: Trading account size: ₹5,00,000 (five lakh rupees). Maximum risk per trade: 1% = ₹5,000. Entry: ₹1,030. Stop-loss: ₹985. Risk per share: ₹45. Position size = ₹5,000 divided by ₹45 = 111 shares (round down to 110). Total capital required: 110 multiplied by ₹1,030 = approximately ₹1,13,300. Feasible within a ₹5 lakh account without excessive margin.
If the trader instead bought 300 shares (because “SBI always bounces”), the risk would be 300 multiplied by ₹45 = ₹13,500 — which is 2.7% of the account on a single trade. That fails the position sizing check.
Putting the Checklist to Work: A Complete Trade Example
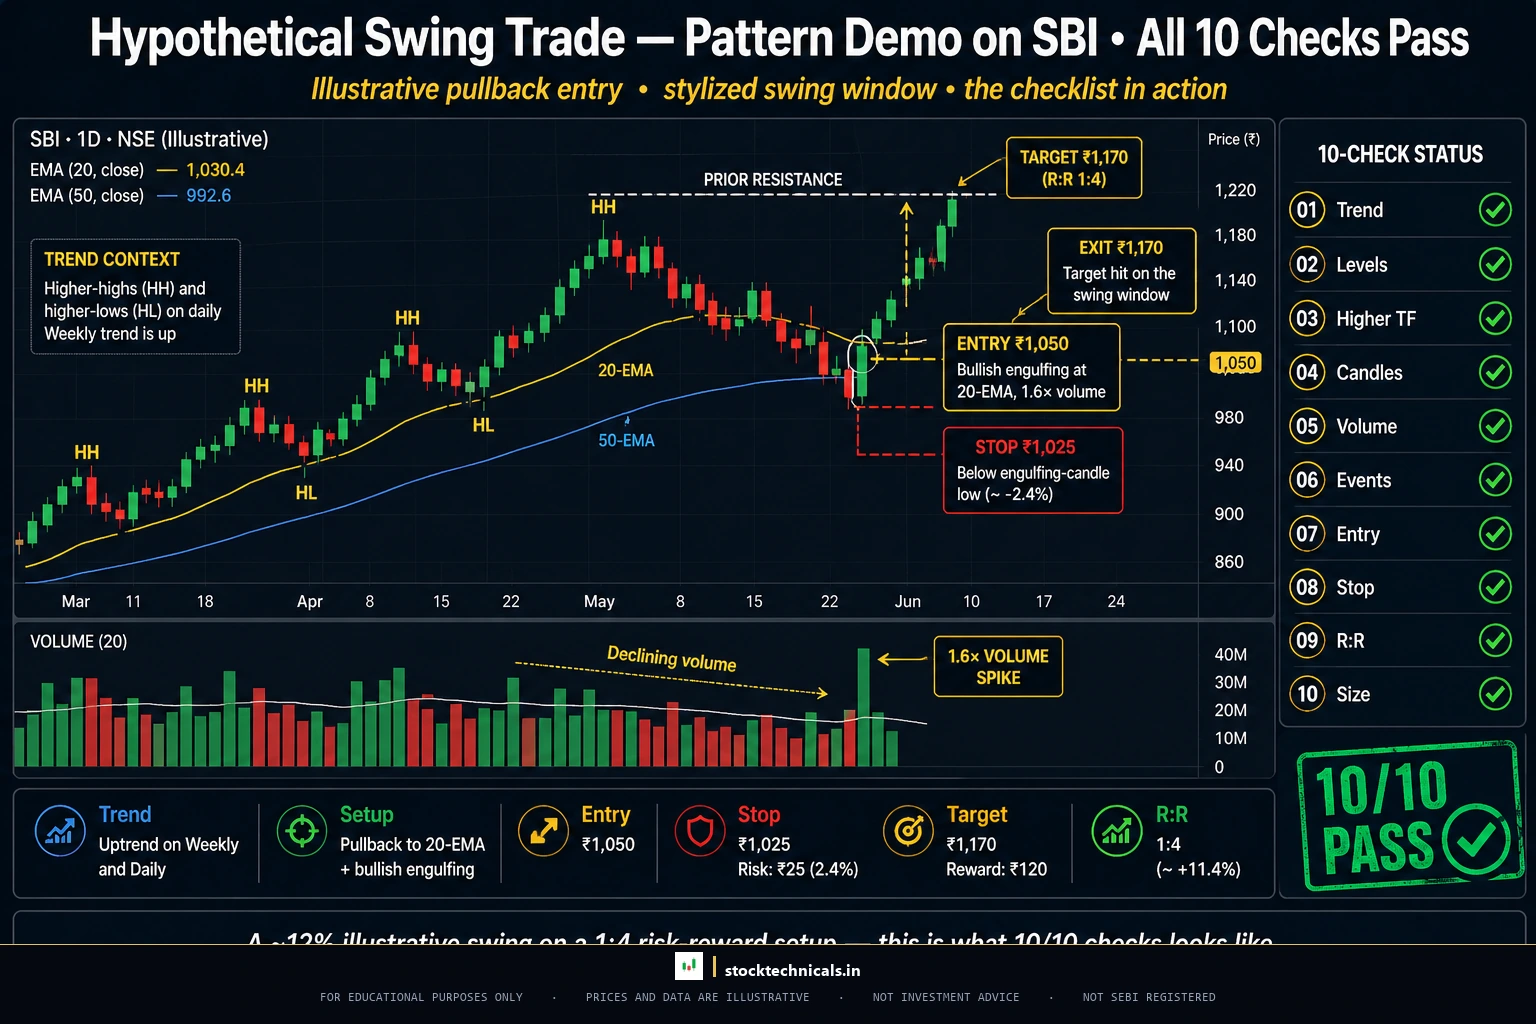
Here is how all ten checks come together on a single trade setup. The stock is SBI, daily chart, late January to February 2026. Every price and volume figure below is verified against NSE (daily OHLC) daily data.
Check — Trend: SBI in a clear uptrend since April 2025. The 20 EMA crossed above the 50 EMA on April 22, 2025 at ₹822.40. By late January 2026, price was above both EMAs (20 EMA at ₹1,030.02, 50 EMA at ₹998.01 on 2 February). Trend is up. PASS.
Check — Support and Resistance: Support zone at ₹988-₹990 (1 February intraday low ₹988.30, 2 February low ₹990.00 — double test). Resistance at ₹1,082.50 (30 January high). The 50 EMA at ₹998 added confluence to the support zone. Clear levels. PASS.
Check — Higher Timeframe: Weekly chart showed 20 EMA above 50 EMA throughout October 2025 to March 2026 (weekly 20 EMA at ₹971.65, weekly 50 EMA at ₹895.82 on the week ending 6 February). The weekly uptrend was firmly intact despite the daily pullback. PASS.
Check — Candlestick Pattern: Hammer candle on February 2, 2026. Open ₹1,019.90, High ₹1,031.30, Low ₹990.00, Close ₹1,028.70. Lower wick 29.90 points (3.4 times the body of 8.80 points). Upper wick just 2.60 points. Classic hammer at support. PASS.
Check — Volume: Hammer candle volume was 14,434,549 shares versus the trailing 20-day average of 9,771,437 — a ratio of 1.48 times. The confirmation candle on 3 February had 16,129,381 shares (1.6 times average). Acceptable for a pattern confirmation. PASS (marginal).
Check — Events: No SBI quarterly results scheduled within the next two weeks. No RBI monetary policy meeting imminent. No futures and options ban. All clear. PASS.
Check — Entry: Buy at ₹1,030 — above the hammer close, conditional on the next candle confirming above ₹1,020 with volume above 12 million. The 3 February candle confirmed at ₹1,064.20 with 16.1 million volume. Entry triggered at ₹1,030. PASS.
Check — Stop-Loss: Below the hammer low at ₹985 (₹990 support minus 5-point buffer). Risk per share: ₹45. PASS.
Check — Risk-Reward: Target ₹1,150. Risk: ₹45. Reward: ₹120. Ratio: 2.67:1. Well above the 1:2 minimum. PASS.
Check — Position Size: On a ₹5 lakh account with 1% risk (₹5,000), position size = 110 shares. Capital required: ₹1,13,300 (22.7% of account). Comfortable allocation. PASS.
Result: All ten checks passed. By 9 February, SBI closed at ₹1,146.00 on volume of 40,852,966 shares (3.9 times average) — a massive breakout. By 24 February, SBI reached ₹1,234.70. The target of ₹1,150 was hit in seven trading sessions.
That is the power of a checklist. It does not guarantee profits on every trade. It guarantees that every trade is taken for the right reasons, with controlled risk, and a clear plan. Over 100 trades, this discipline is what separates profitable traders from the 93% who lose.
Common Mistakes When Using a Checklist
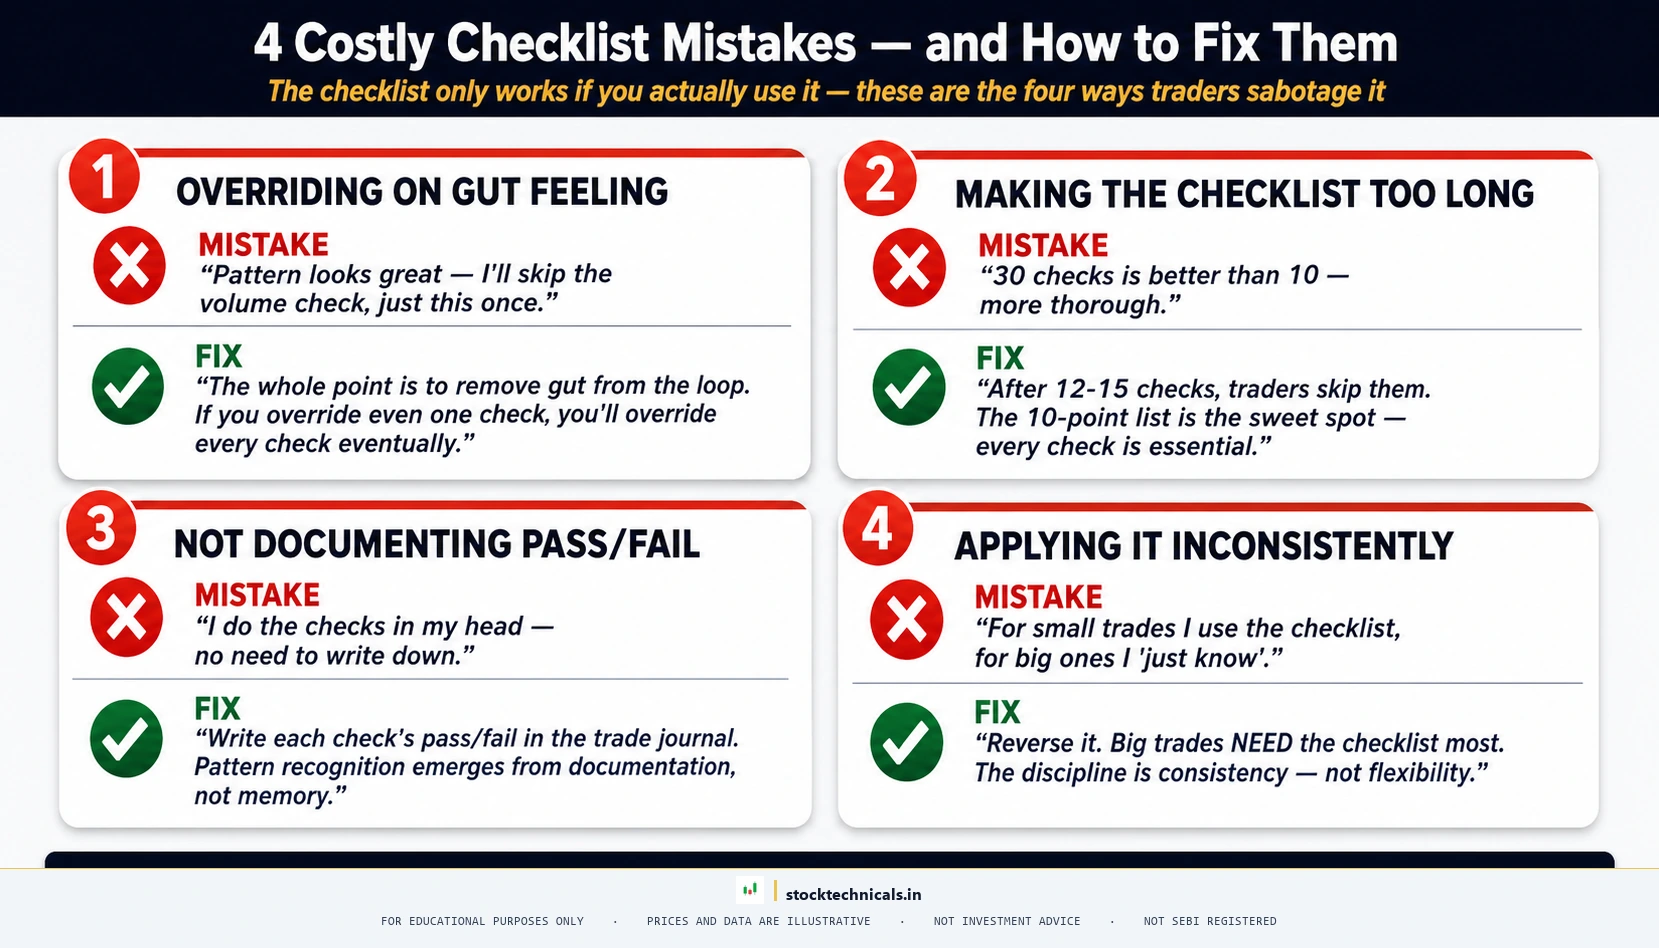
Overriding the checklist on gut feeling. The entire purpose of a checklist is to override emotions. If a trader skips the volume check because “the pattern looks strong,” the checklist is worthless. Every check must pass. No exceptions.
Making the checklist too long. A 25-point checklist will never get used consistently. Ten points is the sweet spot — complete enough to catch every major mistake, short enough to complete in under five minutes.
Not writing it down. A mental checklist is not a checklist — it is a suggestion. Print the checklist, pin it next to the trading screen, or use a spreadsheet where each check is ticked off before the order is placed.
Using the checklist only for entries. The checklist above focuses on entry, but the same discipline applies to exits. Before moving a stop-loss, closing a trade early, or adding to a position, a trader should have a checklist for those decisions too.
Blaming the checklist when trades lose. A trade that passes all ten checks can still lose. That is normal — no checklist eliminates market randomness. Judge the checklist by the results of 50 to 100 trades, not by one trade.
The The Bottom Line
Here is the truth that most trading educators will not say: a checklist is not a magic formula. It will not turn a losing trader into a profitable one overnight. What it does is far more important — it creates the discipline framework that makes long-term profitability possible.
The 93% of futures and options traders who lose money are not all using bad strategies. Many of them know what a hammer candle looks like. Many of them can draw support and resistance. The problem is they skip steps when it matters most — when fear or greed takes over.
A checklist is the antidote. It is boring. It is repetitive. And that is exactly why it works. The best traders in the world are not the most creative — they are the most consistent. Run the ten checks. Every single trade. No exceptions. The results will follow.
Interactive Tool: Pre-Trade Checklist Validator
Pre-Trade Checklist Validator
Score Your Trade
Answer each question honestly. Yes = 10 points. No = 0. Be ruthless — the market will be.
Test Your Checklist Discipline
Five questions about pre-trade discipline. Pick the best answer. Score 4 or 5 to pass.
Frequently Asked Questions
| Check | Action | Why it matters |
|---|---|---|
| Trend direction | Identify on higher timeframe | Trade with the larger flow |
| Support/Resistance | Mark major levels | Defines entry + invalidation |
| Volume confirmation | Compare to 20-day avg | Filters out weak moves |
| Risk-reward ratio | Calculate before entry | Rejects sub-1:2 setups |
| Stop-loss location | Place at structure break | Caps loss at planned amount |
How long does it take to complete the checklist?
With practice, the full ten-point checklist takes approximately three to five minutes per trade setup. The first few times will take longer as each step is still being learned. Within a week of daily use, the process becomes nearly automatic. For intraday traders who scan multiple stocks, the checklist can be shortened by pre-filtering stocks through a screener that handles the first few checks (trend direction, volume above average) automatically.
Should the checklist be modified for different trading styles?
The ten checks apply universally — intraday, swing, and positional traders all need to identify trends, check support and resistance, confirm with volume, and manage risk. The specific timeframes change (5-minute chart for intraday versus daily chart for swing), but the checklist structure stays the same. Some traders add an eleventh check for sector strength or market breadth, but the core ten should never be reduced.
What if only eight or nine checks pass?
Skip the trade. The checklist is binary — either all ten pass, or the trade is not taken. A trade with no volume confirmation or a poor risk-reward ratio is fundamentally flawed. Taking trades with known deficiencies is how accounts slowly bleed. The market offers thousands of opportunities every month. Missing one trade is irrelevant compared to taking a bad one.
Does this checklist work for options trading?
The core checklist works for options trading with minor additions. Options traders should add checks for implied volatility (is IV high or low relative to historical?), open interest at the strike price, and time decay (theta). But the underlying ten checks — trend, support and resistance, timeframe, candle patterns, volume, events, entry, stop-loss, risk-reward, position sizing — all apply to the stock or index that the option is based on. The weekly Tuesday expiry (since NSE moved from Thursday on September 1, 2025) is covered in the events check.
Can the checklist be automated?
Partially. Screeners on TradingView, Zerodha Kite, and Angel One can automate the first five checks: trend direction, proximity to support and resistance, timeframe alignment, candlestick pattern detection, and volume confirmation. The last five checks (events, entry, stop-loss, risk-reward, position sizing) require human judgment because they depend on individual account size, risk tolerance, and holding period. The ideal workflow is automated pre-filtering followed by manual checklist completion on the shortlisted setups.
Where can the checklist be printed or saved?
The interactive tool in this article allows traders to score a trade against all ten checks directly on this page. The infographic in this article is designed to be saved, printed, and pinned next to a trading screen. On TradingView, traders can also create a custom template with the ten checks as text labels, so the checklist appears directly on the chart.
A checklist is only as strong as its weakest entry. Skip one point, lose the edge. Per the SEBI FY24-25 study, 91 percent of individual equity F&O traders lost money — most from skipping checks they thought were optional.
Continue Learning
The technical analysis checklist connects every concept covered so far:
- What is a trend — Check 1 foundation
- Support and resistance complete guide — Check 2 foundation
- Timeframes in trading — Check 3 foundation
- Bullish candlestick patterns — Check 4 (buy setups)
- Bearish candlestick patterns — Check 4 (sell setups)
- Volume in trading — Check 5 foundation
- What is a breakout — Check 5 and 7 (entry triggers)
- What is a pullback — Check 7 (pullback entries)
- Trendlines — Check 1 supplementary
- Dow Theory — Check 8 (swing point stop-loss)
- How to draw support and resistance — Check 2 supplementary
- Types of trading — Check 3 (matching timeframes)
- Hammer and hanging man — Check 4 specific pattern
- How to set up your first chart on TradingView — Practical chart setup for all checks
Discipline is not about being perfect. It is about being consistent. Run the checklist. Every single trade. No exceptions.
— OrsLeo, StockTechnicals.in
Risk Disclaimer: Trading in securities market involves substantial risk of loss. Past performance does not guarantee future results. All examples in this article use historical data for educational purposes only. Always trade with capital you can afford to lose. This content is educational — not financial advice. Consult a SEBI-registered investment advisor before making investment decisions.