Quick Answer
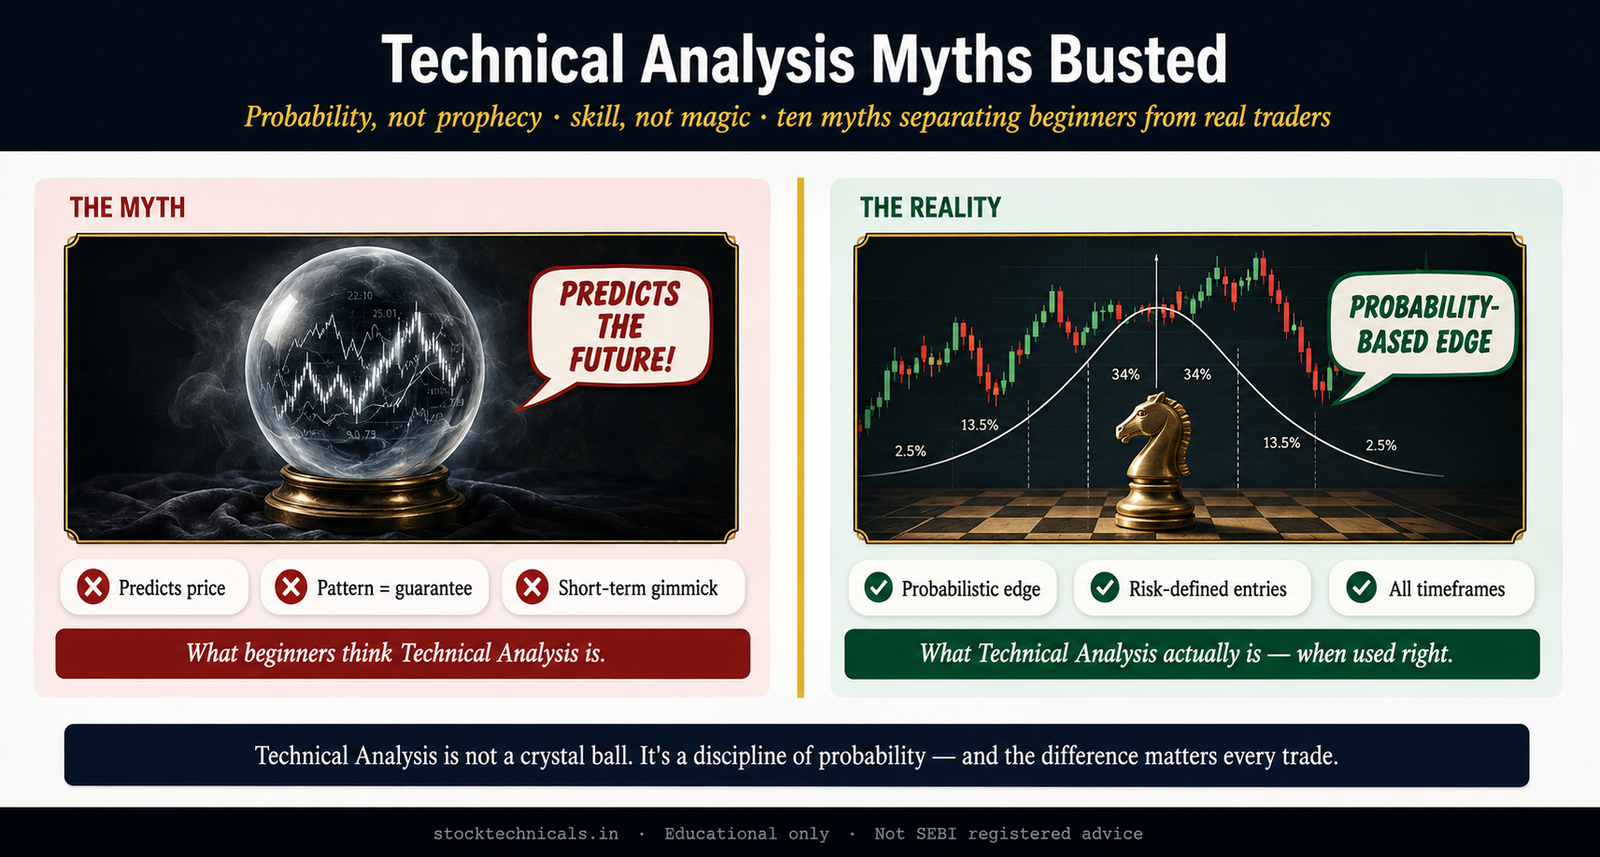
Technical analysis is not a prediction tool — it is a probability framework. It does not guarantee profits, does not require expensive software, works on any liquid market (including NSE), and is equally valid on weekly and monthly timeframes as it is on intraday charts. Most criticism targets a strawman version of technical analysis that serious practitioners do not use.
Key Takeaways
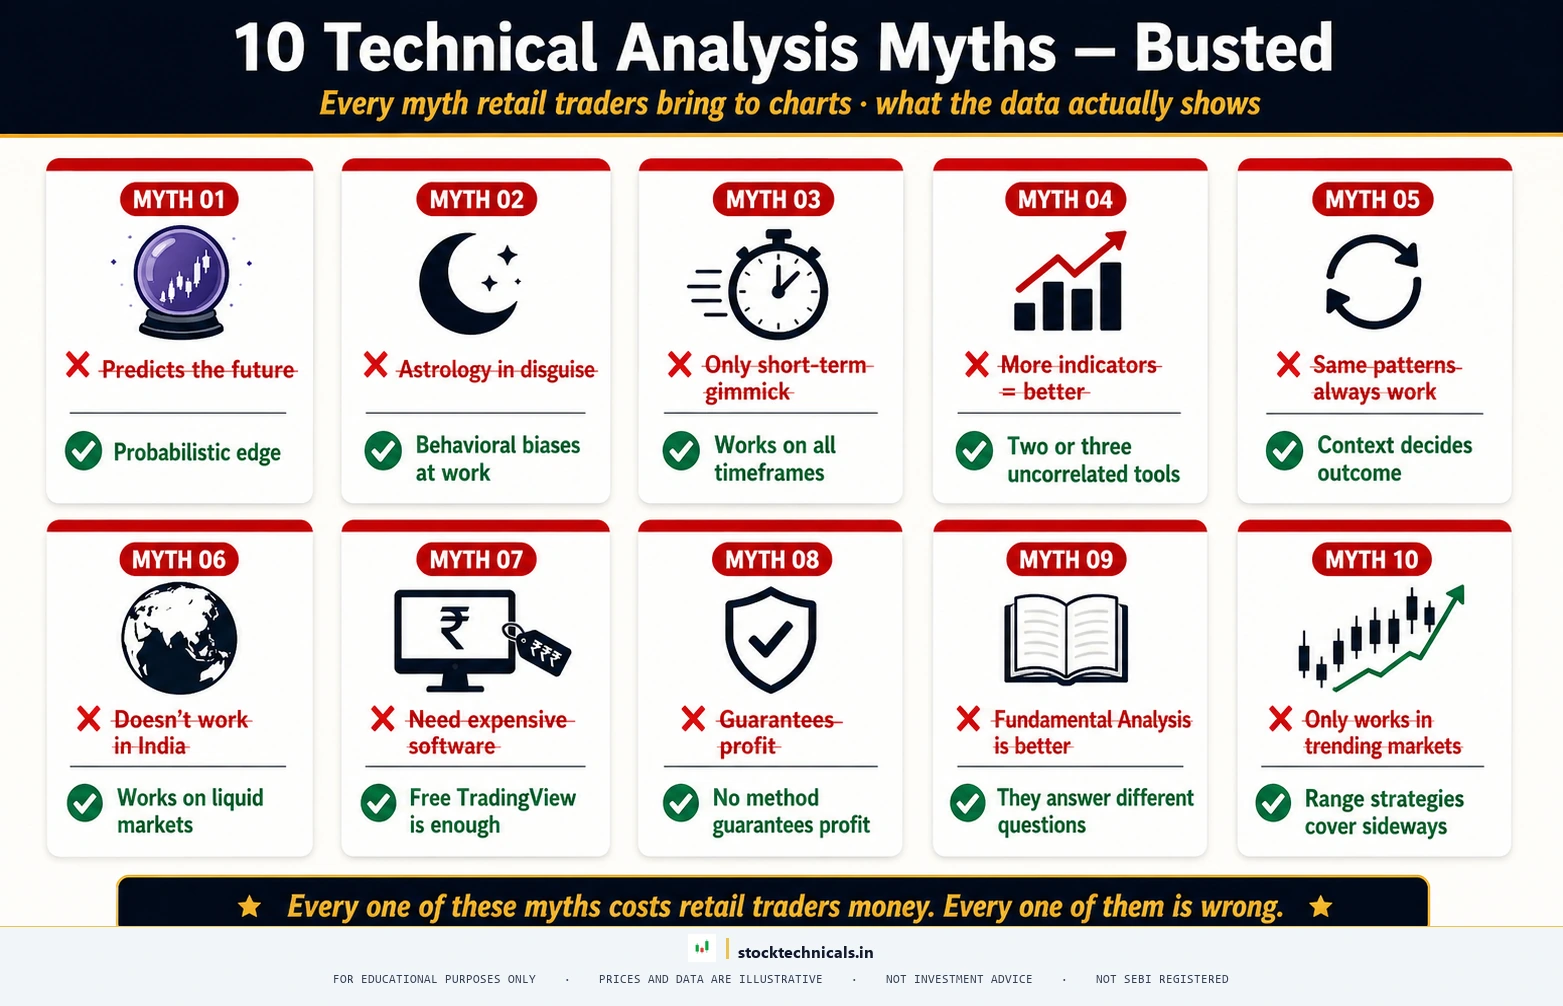
- Technical analysis is a probability framework, not a prediction machine — no chart pattern guarantees any specific outcome
- Chart analysis works on weekly, monthly, and positional timeframes just as well as intraday
- Adding more indicators does not improve accuracy — two or three uncorrelated tools outperform a screen full of signals
- Technical analysis works on any liquid market, including NSE and BSE stocks, Nifty futures, and Bank Nifty options
- Free tools like TradingView provide everything a beginner or intermediate trader needs
- No trading method guarantees profits — the SEBI study (September 2024) found approximately 93% of individual F&O traders lost money
Why Technical Analysis Gets Such a Bad Reputation
Before debunking individual myths, it helps to understand why technical analysis attracts so much skepticism. Three forces create the negative perception:
Published January 14, 2026 · Last refreshed April 27, 2026. Prices and data are compiled with reasonable care — always confirm against your broker before trading.
- Survivorship bias in social media. Traders who post winning screenshots create an illusion that chart reading guarantees money. When new traders try it and lose, they blame the method rather than their risk management.
- Academic hostility. The Efficient Market Hypothesis (EMH), taught in every finance MBA program, argues past price data cannot predict future movements. This creates finance professionals who dismiss technical analysis on theoretical grounds without testing it empirically.
- Genuine misuse. Many retail traders use technical analysis incorrectly — trading every signal without confirmation, ignoring volume, using lagging indicators on volatile intraday charts, and risking too much per trade.
The Prediction Myth
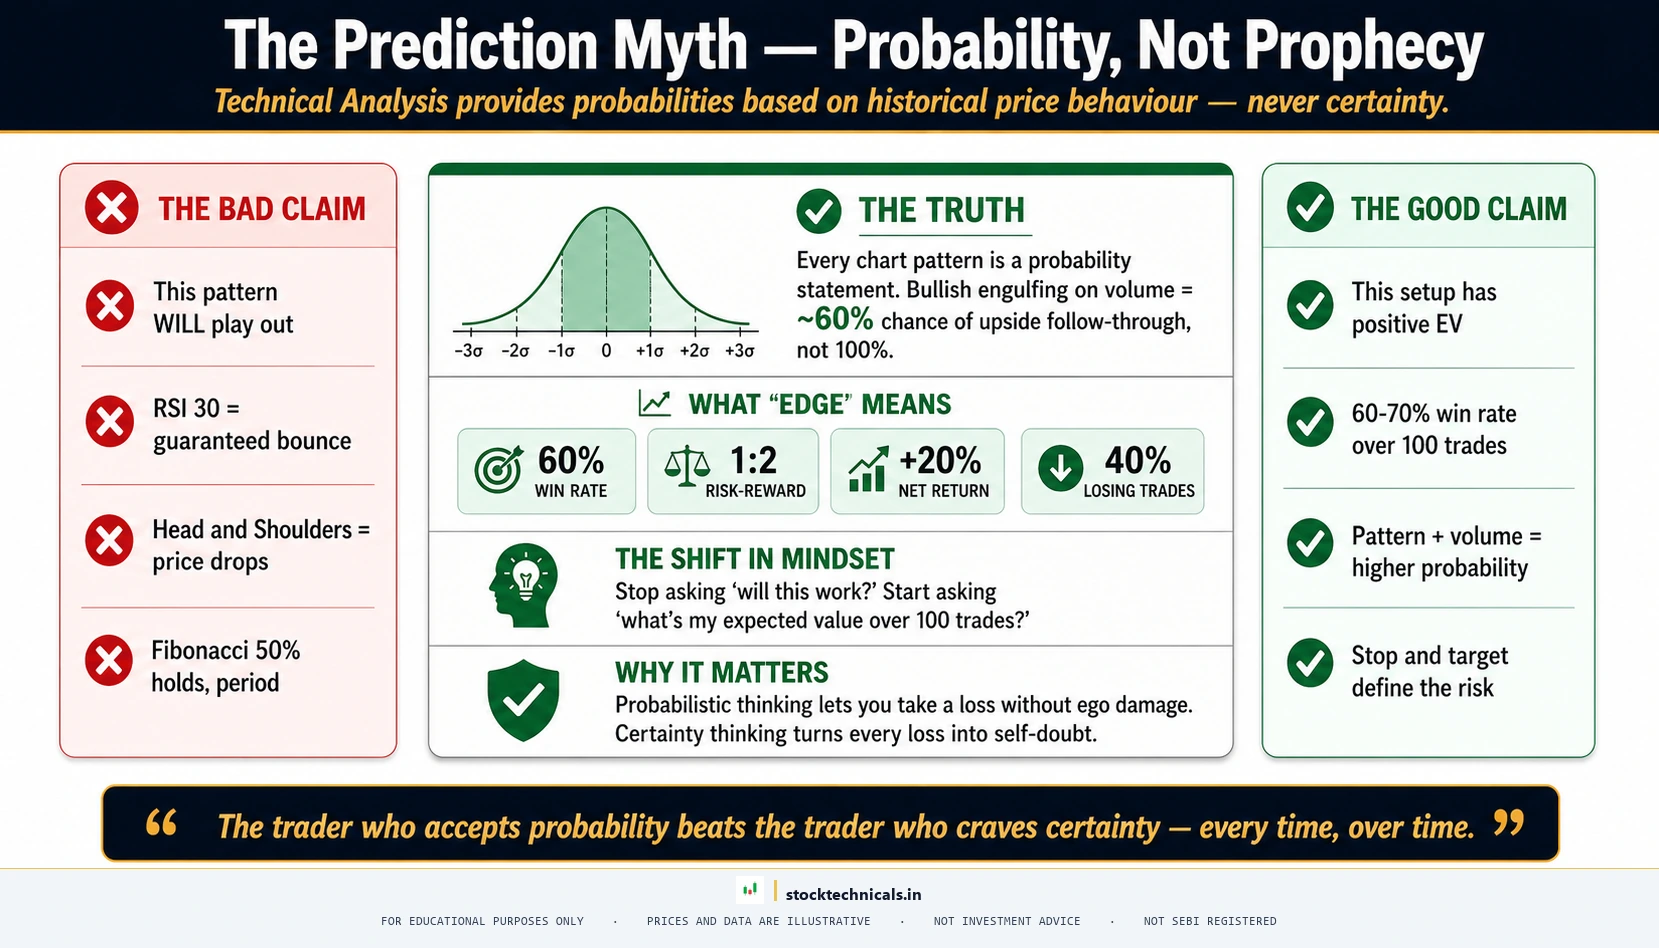
Myth: "Technical analysis predicts the future."
This is simultaneously the most common myth and the most dangerous one. New traders approach technical analysis expecting crystal-ball accuracy. When that does not happen, disillusionment follows immediately.
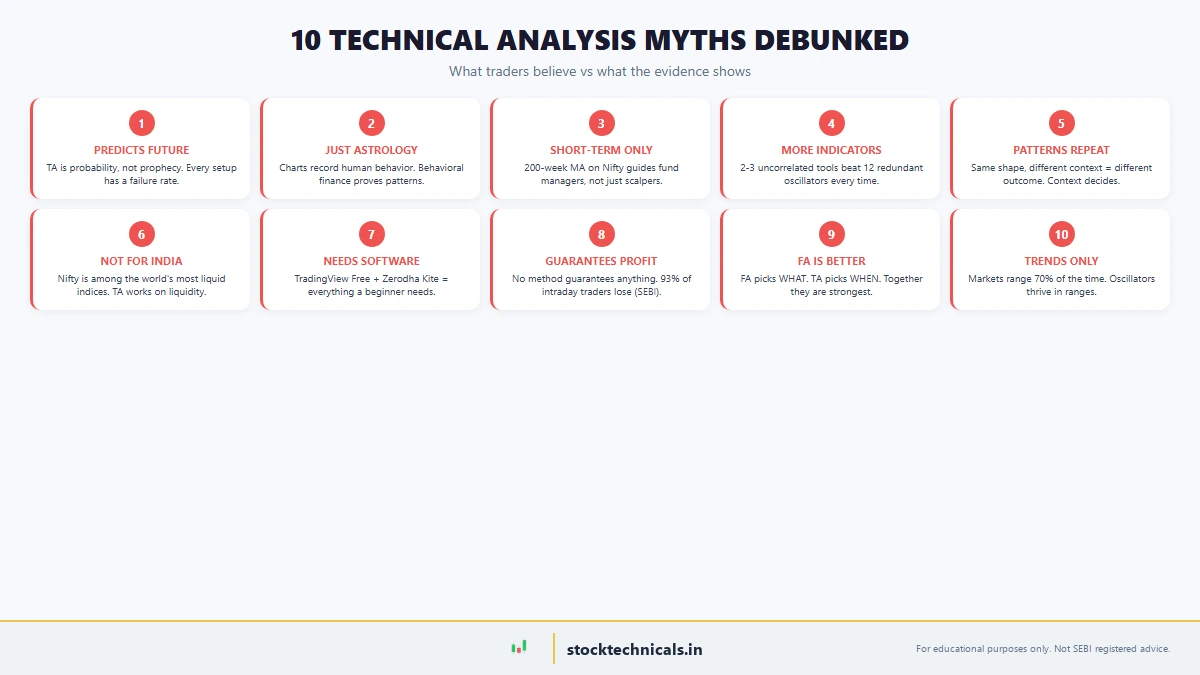
The reality: Technical analysis is a probability framework, not a prediction engine. A head and shoulders pattern does not mean a stock will fall. It means that historically, stocks forming that pattern have broken down about 81% of the time (according to Bulkowski’s pattern studies), though only about 51% reach the full measured-move target. That still leaves meaningful odds of failure.
Professional traders understand this distinction completely. Every setup has a probability attached, a predefined risk (stop loss), and a predefined reward (target). They do not need to be right on every trade. They need the edge to play out over many trades — just like a casino does not need to win every hand.
Practical takeaway: Never enter a trade expecting it to work. Enter expecting that over 100 similar setups, the probability tilts in the trader’s favor — but this specific trade might be the one that fails.
The Astrology Myth
Myth: "Technical analysis is just astrology for stocks."
This phrase has become so popular on social media that it appears as an automatic suggestion when searching for technical analysis. The comparison implies chart reading is mystical pattern-matching with no rational basis.
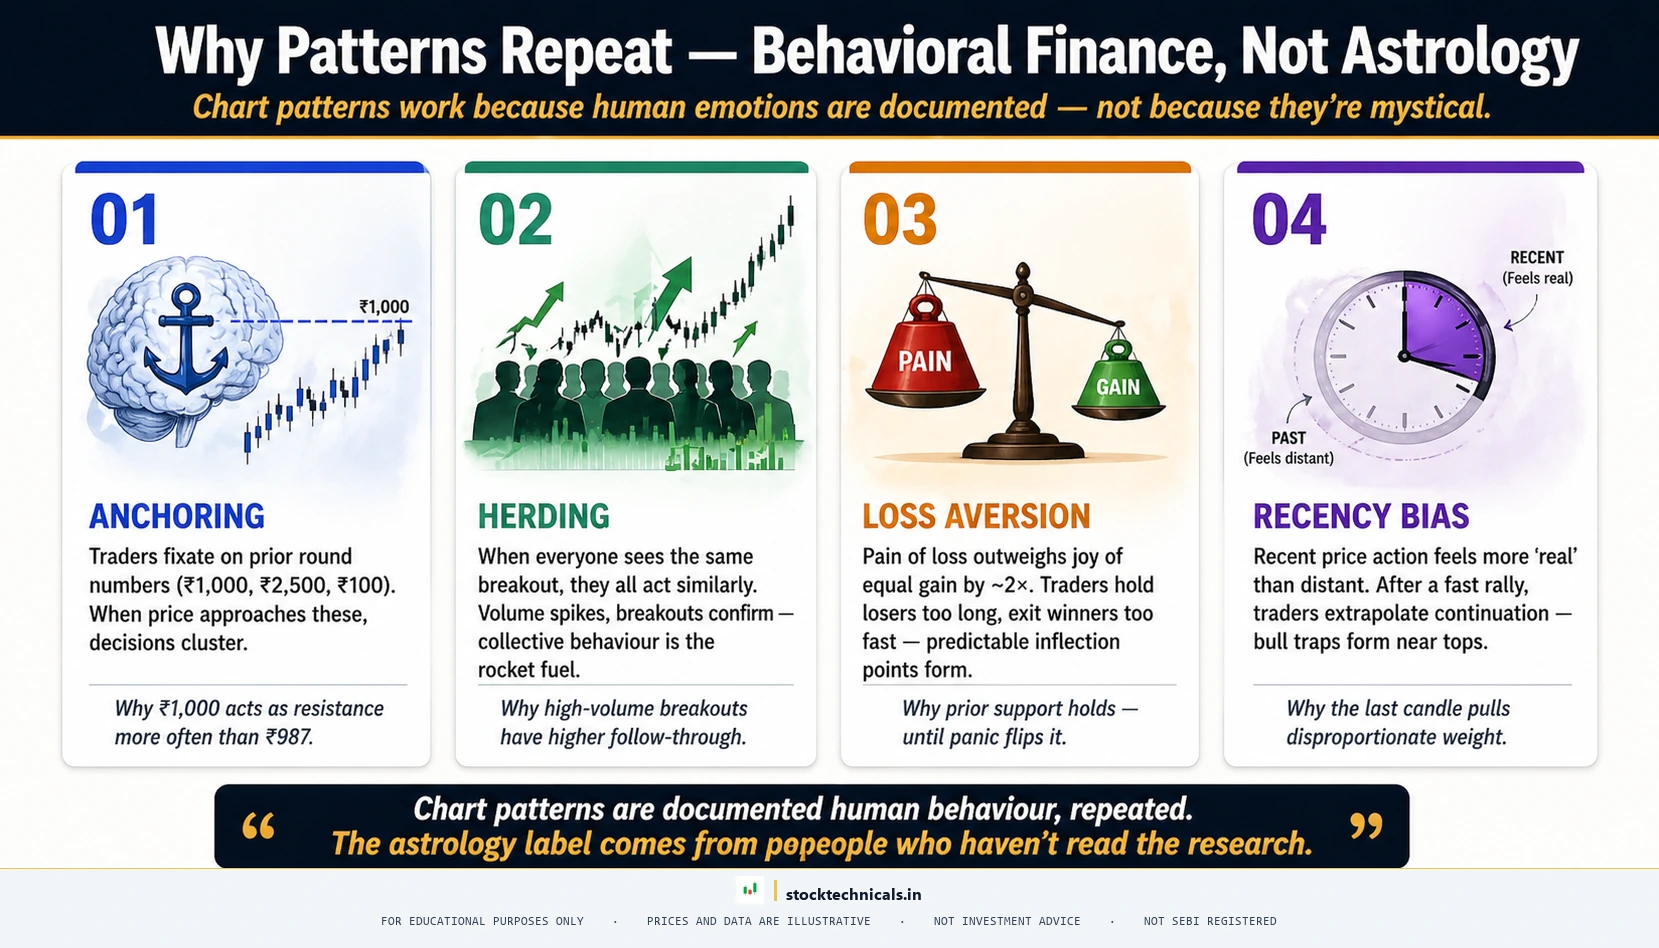
The reality: Every price on a chart represents a real transaction between a real buyer and a real seller. Chart patterns are visual representations of collective human behavior. A support level forms because traders remember buying at that price before, and they step in again when price returns. That is not astrology — that is psychology recorded on a price axis.
The field of behavioral finance (Nobel Prize-winning work by Daniel Kahneman in 2002 and Richard Thaler in 2017) proves that markets are not perfectly efficient. Humans exhibit predictable biases: anchoring, herding, loss aversion, recency bias. These biases create repeating patterns in price data.
Practical takeaway: When someone claims technical analysis is astrology, ask them one question: "Do traders remember the price at which they bought a stock?" Of course they do. That memory is exactly what creates support and resistance levels.
The Short-Term Myth
Myth: "Technical analysis only works for short-term trading."
Many traders assume charts are only useful for intraday scalping or swing trades lasting a few days. Long-term investors dismiss technical analysis entirely, believing it has nothing to offer someone holding stocks for months or years.
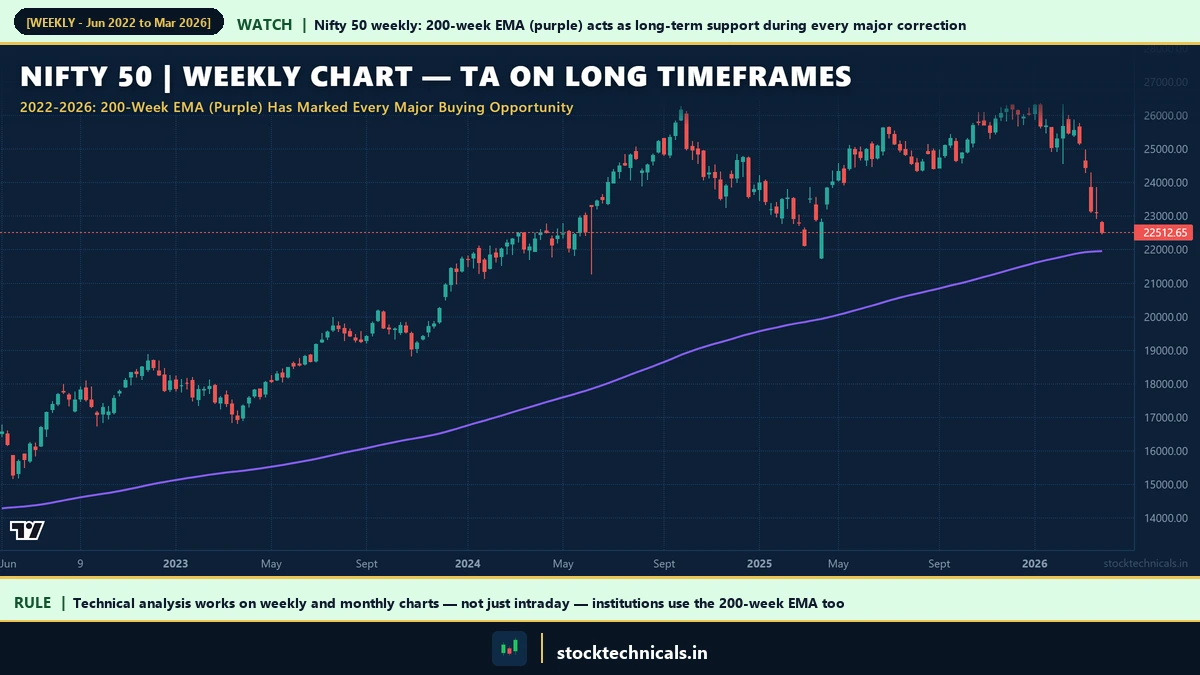
The reality: Technical analysis works on any timeframe — from 1-minute intraday charts to monthly charts spanning decades. Many professional traders argue that technical analysis is MORE reliable on higher timeframes because noise is filtered out and only significant price action remains.
The 200-day moving average is one of the most watched technical levels in global markets. Fund managers, institutional investors, and pension funds use this level to make allocation decisions worth billions. The 200-week moving average on the Nifty 50 (NSE: NIFTY 50) has served as major support during every market correction in the last two decades.
Practical takeaway: Traders who dismiss technical analysis for long-term investing should check the 200-week moving average on Nifty 50 on TradingView. Several major buying opportunities in the last 15 years have occurred near or below that level.
The Indicator Overload Myth
Myth: "More indicators on a chart means better analysis."
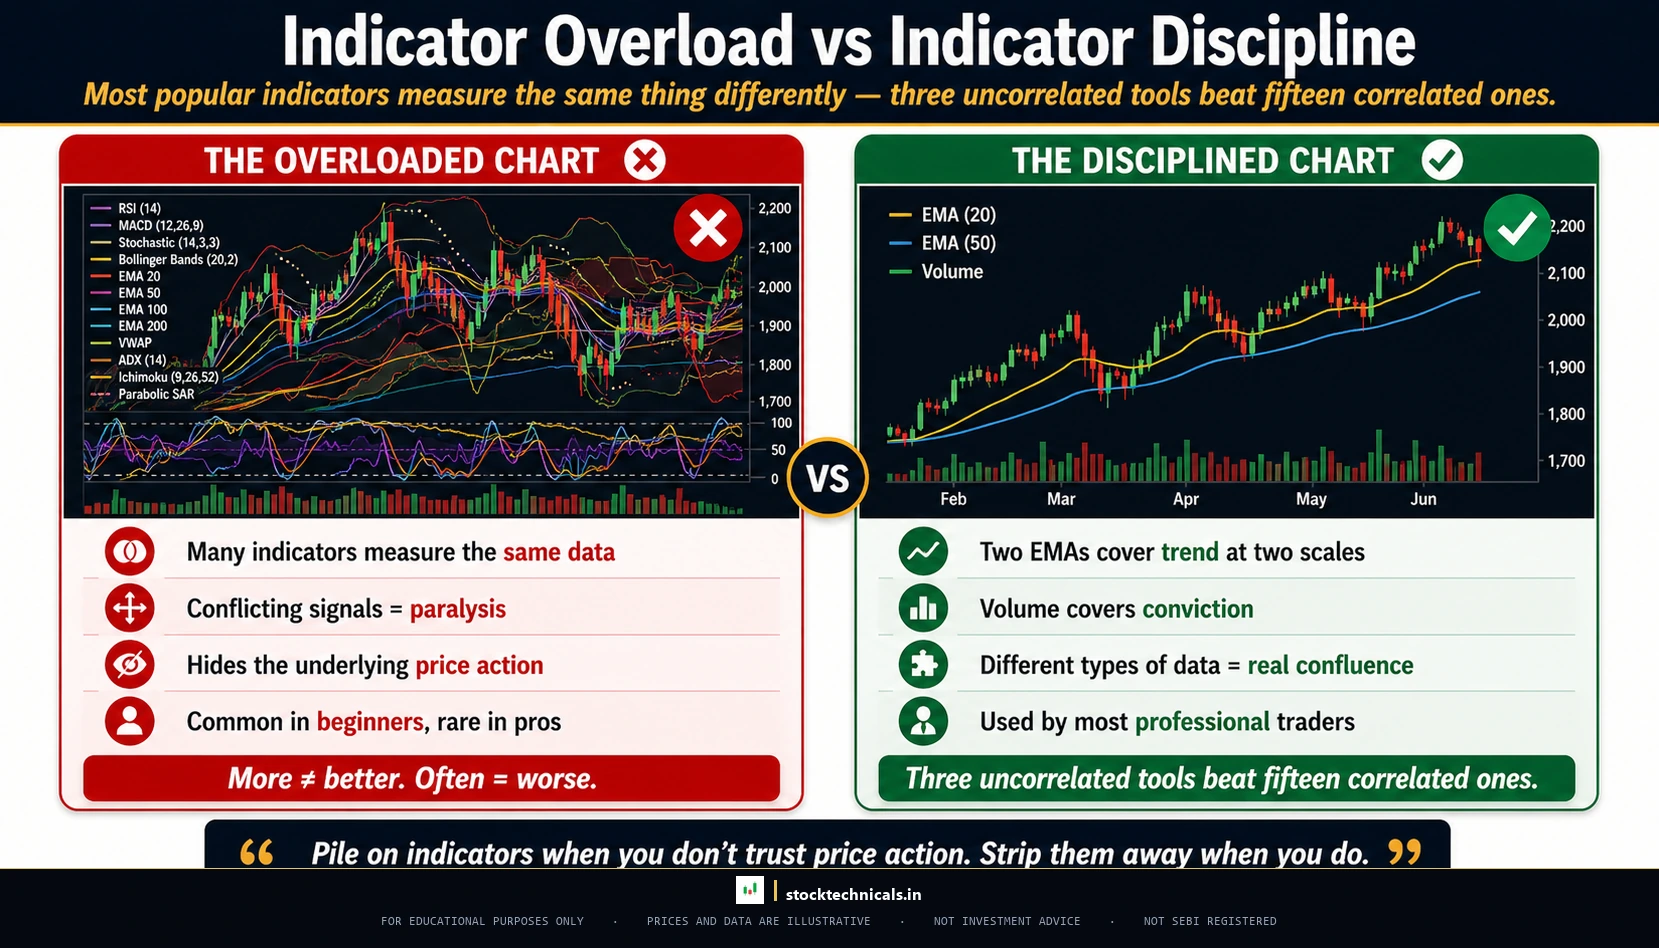
Beginners discover RSI, MACD, Bollinger Bands, Stochastic, CCI, and a dozen other indicators — then add all of them to a single chart. The price bars shrink to a tiny sliver while colored lines dominate the screen. This is not analysis. This is noise.
The reality: Most popular indicators are derived from the same underlying data — price and time. RSI, MACD, and Stochastic are all momentum oscillators that process closing prices differently but often agree or disagree at the same times. Adding three momentum indicators does not give three independent confirmations — it gives one confirmation repeated three times with slight variations.
Professional traders typically use two or three uncorrelated tools: one trend tool (moving average or trendline), one momentum tool (RSI or MACD), and volume confirmation. That is it.
Practical takeaway: Remove every indicator from the chart. Add back only one trend indicator and one momentum indicator. Compare the clarity of signals before and after. Most traders find their accuracy actually improves with fewer tools.
The Repetition Myth
Myth: "The same pattern always produces the same result."

The reality: Patterns provide probabilities, not certainties. The same pattern in different contexts produces different results because the market environment is different every single time. A bullish engulfing during a strong uptrend with rising volume has a very different probability profile than the same pattern in a sideways market with declining volume during earnings season.
Context matters more than the pattern itself. Professional traders evaluate the broader trend direction, volume behavior, proximity to major support or resistance levels, market-wide sentiment (India VIX level, FII/DII data), and news or event proximity (earnings, RBI policy, SEBI announcements).
Practical takeaway: Never trade a pattern in isolation. Always ask: "What is the trend? What is volume doing? Are there any upcoming events?" A pattern without context is just a shape on a screen.
The Geography Myth
Myth: "Technical analysis does not work on NSE and BSE stocks."
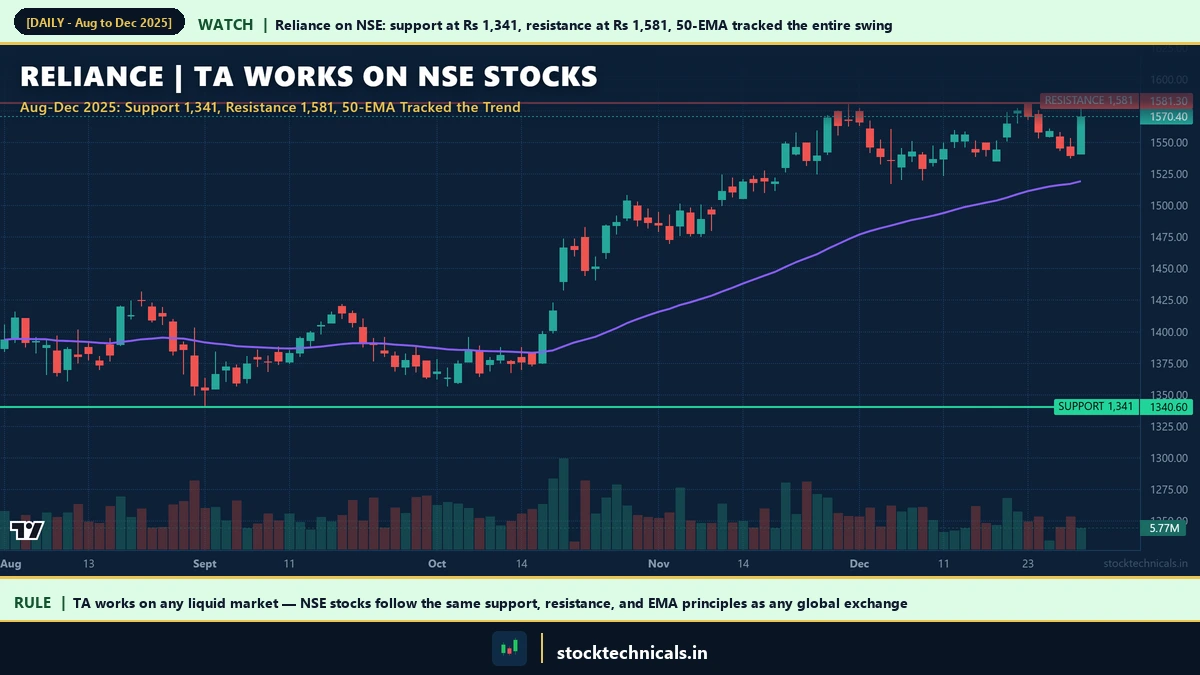
The reality: Technical analysis works on any liquid market where prices are determined by supply and demand. NSE and BSE list some of the most liquid stocks and derivatives in the world. Nifty 50 index options rank as the most actively traded index derivative contract in the world by volume (FIA 2024 data). NSE is the world’s largest derivatives exchange.
The principles behind technical analysis — support and resistance, trend persistence, volume confirmation, momentum divergence — are universal because they are driven by human behavior, not by geography.
Practical takeaway: Apply technical analysis only to liquid stocks and indices. On NSE, stick to Nifty 50 components, Bank Nifty components, and F&O-listed stocks for reliable chart analysis.
The Software Myth
Myth: "Technical analysis requires expensive software and data feeds."

The reality: The free version of TradingView provides everything a beginner or intermediate trader needs: data for NSE and BSE, 100+ built-in indicators, drawing tools, community-shared strategies, and alerts. Broker platforms like Zerodha Kite and Angel One also provide charting tools at zero additional cost.
The expensive tools start mattering when traders need features like backtesting, custom scanning, options analytics, or algorithmic execution. For learning and practicing technical analysis, free tools are more than sufficient. Read the complete TradingView setup guide to get started in under 5 minutes.
Practical takeaway: Start with TradingView free or Zerodha Kite charts. Upgrade to paid tools only after consistently profitable trading on free platforms. The software is never the bottleneck — the trader’s skill is.
The Guarantee Myth
Myth: "Technical analysis guarantees profits if done correctly."
No trading method — technical, fundamental, quantitative, or algorithmic — guarantees profits. Markets are complex adaptive systems where millions of participants interact with different timeframes, different information, and different objectives.
Technical analysis provides an edge, not a guarantee. A trader with a 55% win rate and a 2:1 reward-to-risk ratio is highly profitable over time — but will still lose 45 out of every 100 trades.
The SEBI study found that approximately 93% of individual F&O traders in India lost money over a three-year period. This is not because technical analysis does not work. It is because most retail traders trade without a defined strategy, risk too much per trade, exit winners too early, hold losers too long, and chase signals without understanding probability.
Practical takeaway: Accept that losses are a normal part of trading. Focus on risk management, position sizing, and maintaining a positive expectancy over time rather than trying to eliminate losing trades.
The Fundamental-Analysis-Is-Better Myth
Myth: "Fundamental analysis is always superior to technical analysis."
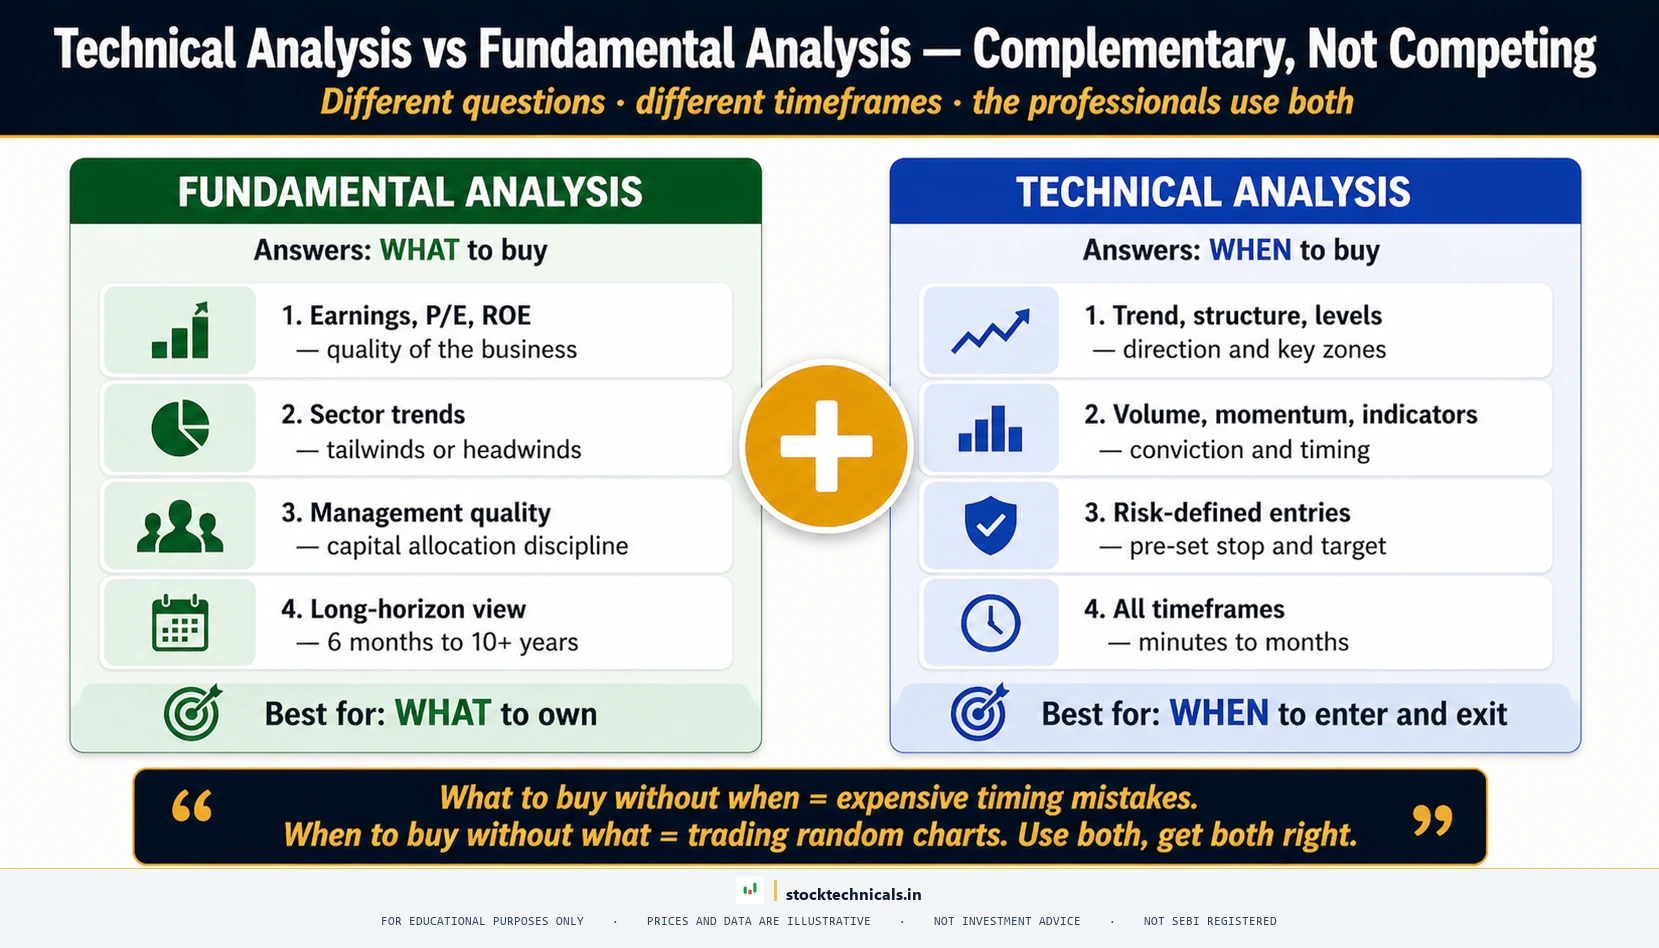
Fundamental analysis and technical analysis answer different questions. Fundamental analysis asks: "Is this a good company to own?" Technical analysis asks: "When is a good time to buy or sell it?"
A stock can be fundamentally excellent and still fall 40% during a market correction. The comparison between technical analysis and fundamental analysis is a false dichotomy. The most successful market participants use both — fundamental analysis to select what to trade, technical analysis to decide when to enter and exit.
Practical takeaway: Stop treating technical analysis and fundamental analysis as rivals. Use fundamental analysis to build a watchlist of quality stocks. Use technical analysis to time entries and manage risk.
The Trending-Only Myth
Myth: "Technical analysis only works in trending markets."

The reality: Markets are commonly said to spend the majority of their time in consolidation — a widely cited estimate puts it at roughly 70% sideways and only 30% in clear trends. Technical analysis includes tools designed specifically for range-bound conditions: oscillators like RSI identify overbought and oversold extremes, Bollinger Bands help identify range boundaries, and support and resistance levels define the range itself.
The key is recognizing which type of market condition is present and applying the appropriate tools. Trend-following indicators (moving averages, MACD) work during trends. Oscillators and range strategies work during consolidation.
Practical takeaway: Before taking any trade, first identify the market condition: trending or range-bound. Then select the tools appropriate for that condition.
Interactive Tool: Technical Analysis Myth Buster
Technical Analysis Myth Buster
Myth or Fact?
Read each statement about technical analysis. Decide if it is a Myth or a Fact. Instant feedback after each pick.
Expectation Calculator
Plug in your trading numbers to see if your strategy has a positive expected value. The math behind the myth.
Quick Quiz
Test your technical analysis myth knowledge. Click the correct answer — instant feedback on each question.
What Technical Analysis Actually Does Well
After dismantling the myths, here is an honest assessment of where technical analysis provides genuine value:
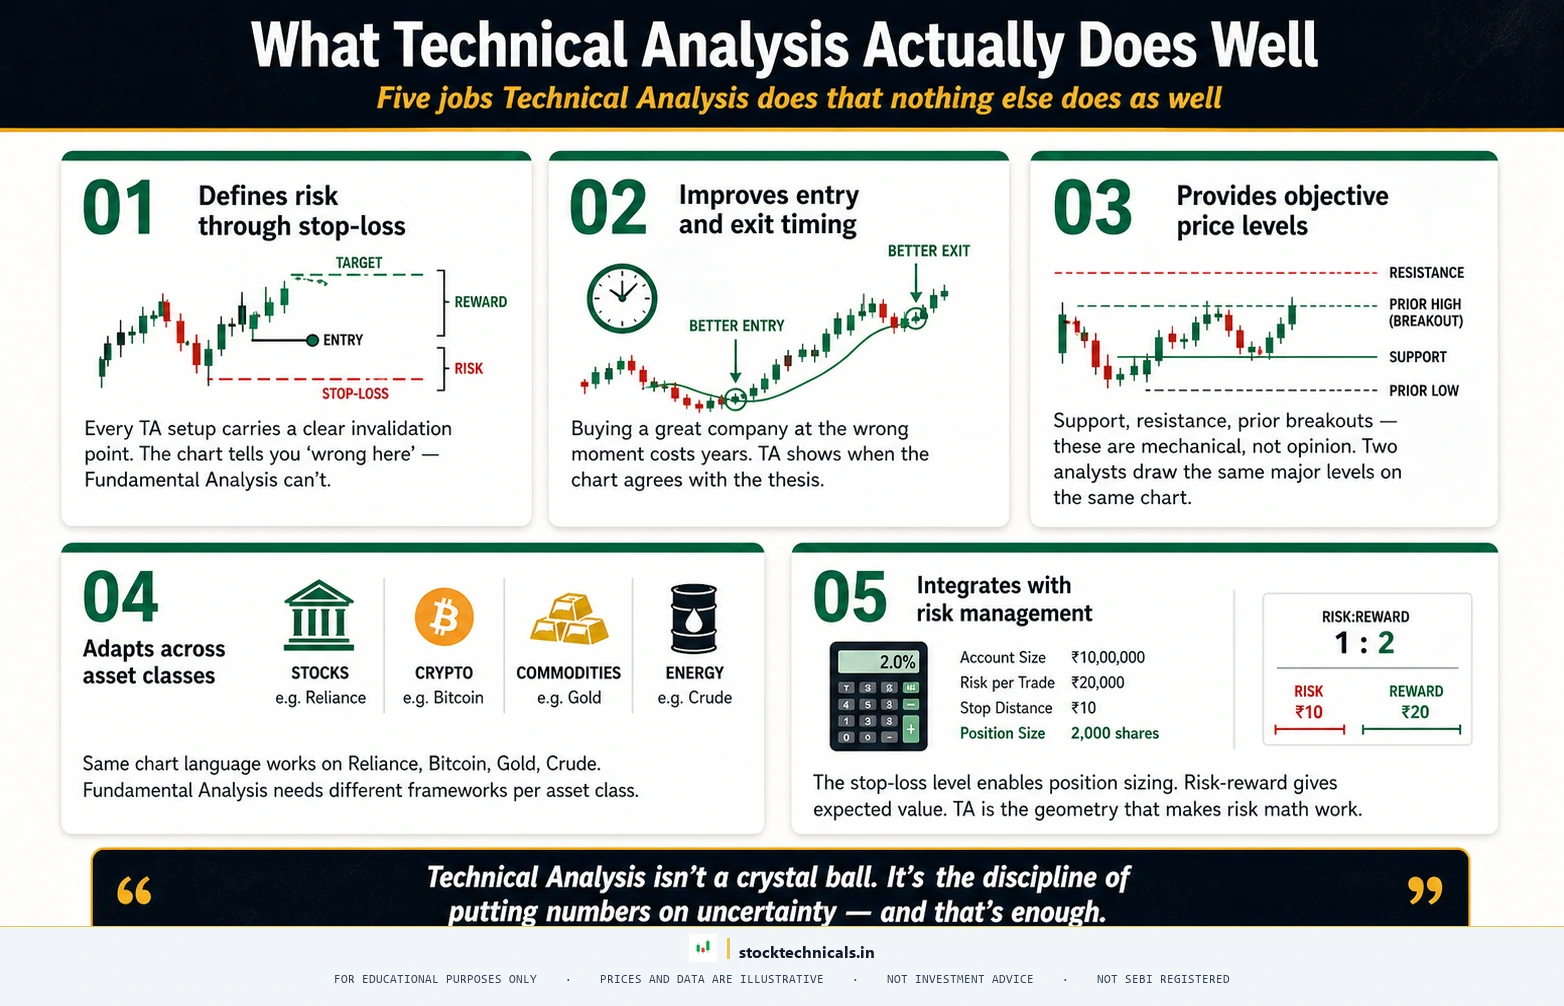
- Risk definition. Technical analysis provides clear levels for stop losses. A trader who enters near support with a stop below has mathematically defined risk.
- Timing. Even for long-term investors, technical analysis helps identify better entry and exit points. Buying after a pullback to the 200-day moving average is objectively better than buying at a random time.
- Objectivity. A price chart is the same for every participant. Support at 1,500 is support at 1,500 regardless of opinion.
- Adaptability. Technical analysis applies to stocks, futures, options, commodities, currencies, and cryptocurrencies.
- Risk management framework. Technical analysis naturally integrates with position sizing, risk-reward calculations, and trade management.
Building a Realistic Expectation Framework
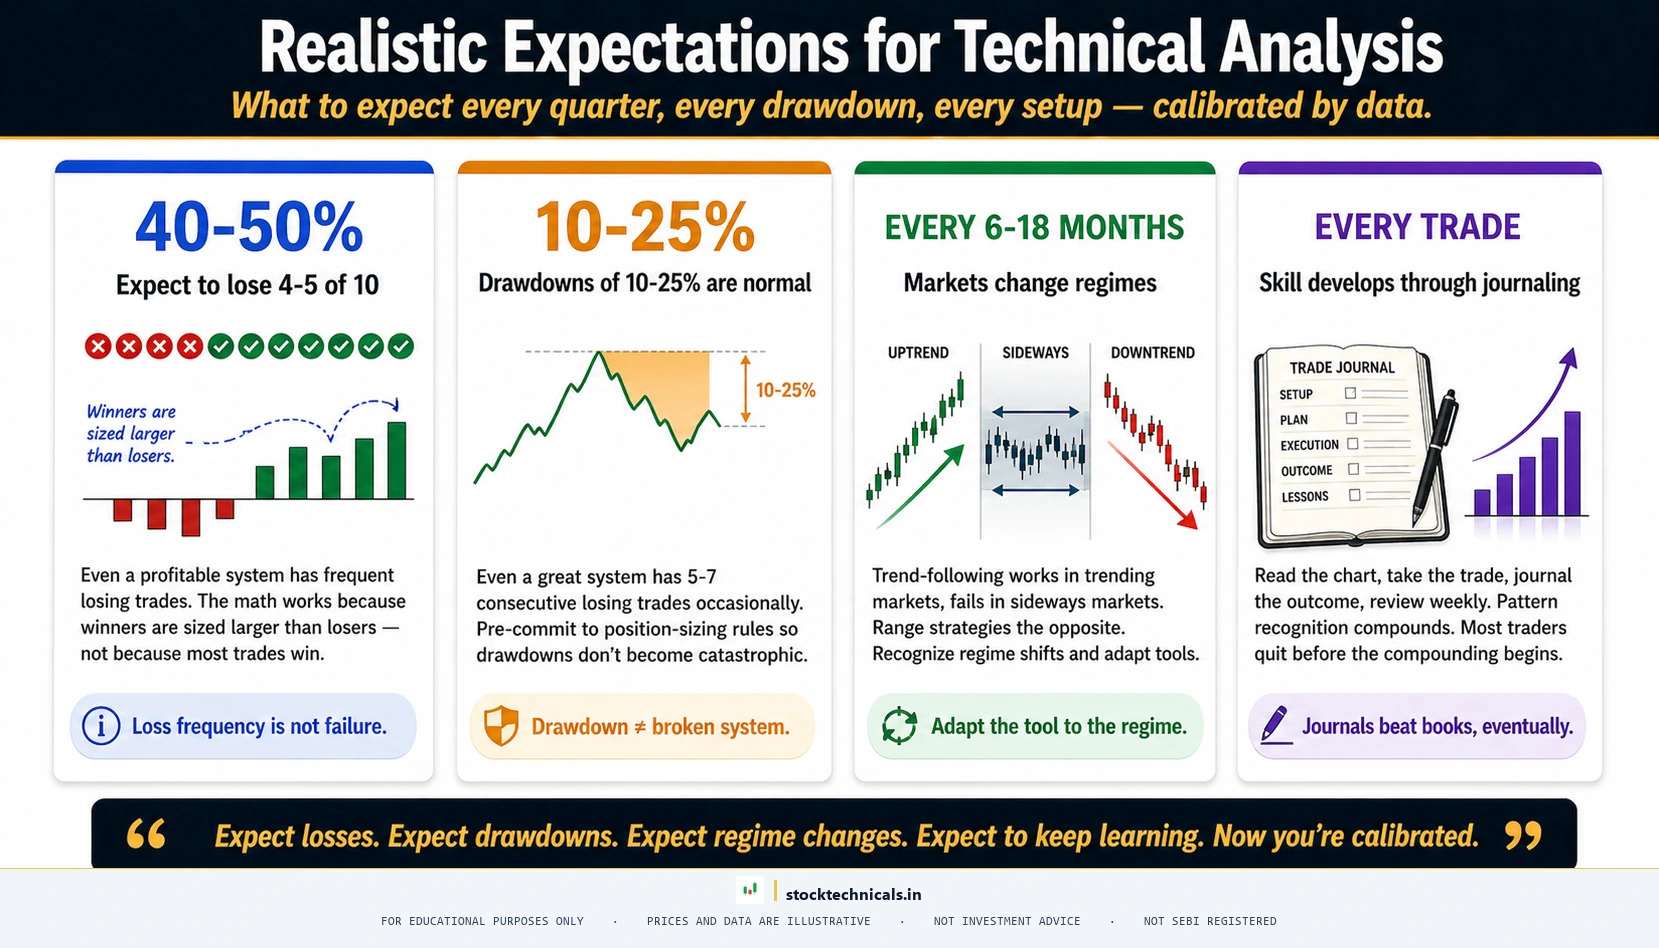
- Expect to be wrong 40-50% of the time. Even the best technical traders have win rates between 50-60%. Profitability comes from reward-to-risk ratio.
- Expect drawdowns. Every strategy has losing streaks. A system that wins 55% of the time can easily have 7-8 consecutive losses.
- Expect the market to change. A strategy that worked in trending markets may struggle during consolidation.
- Expect continuous learning. Technical analysis is a skill that improves with practice, review, and adaptation. Traders who keep a trading journal consistently outperform.
The The Bottom Line About Technical Analysis
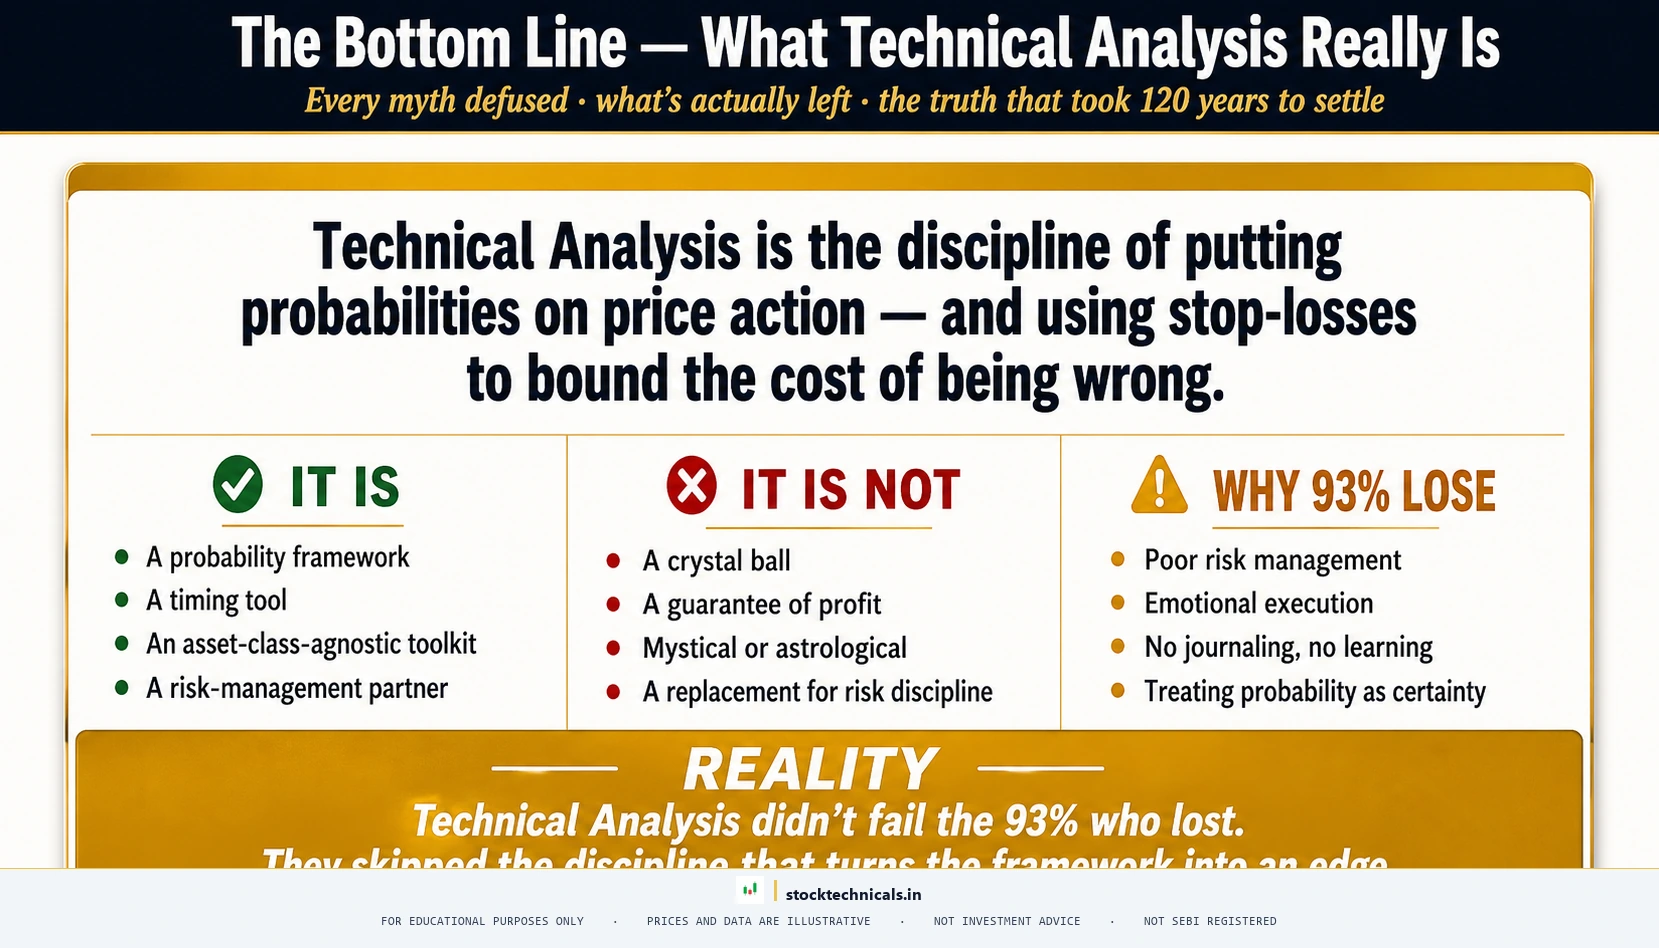
The Bottom Line
Technical analysis is a tool — nothing more. It does not think, it does not predict, and it does not care whether a trader profits or loses. The chart shows what happened. The trader decides what to do about it. The 93% of F&O traders who lose money (according to SEBI September 2024 data) are not losing because technical analysis is broken. They are losing because they skip risk management, overtrade, refuse to take stop losses, and expect a chart pattern to do the work that discipline should be doing. Technical analysis provides an edge. Discipline, risk management, and emotional control determine whether that edge translates into consistent profitability.
Real Talk: Why Most Traders Still Fail
Real Talk
Knowing that technical analysis works does not automatically make a trader profitable. The gap between understanding and execution is where most traders fail. They read about breakouts, study pullbacks, memorize candlestick patterns — then panic-sell the moment a trade goes against them. The myths in this article are easy to debunk intellectually. The hard part is building the discipline to actually trade based on probabilities rather than emotions. That takes practice, journaling, and honest self-assessment. There are no shortcuts.
Test Your Technical Analysis Myth Knowledge
Quick Quiz — 5 Questions
What does technical analysis actually provide?
Why do chart patterns form repeatedly?
How many indicators should a beginner chart have?
Which market condition is BEST suited for RSI?
A 55% win rate with 2:1 reward-to-risk ratio means what?
Frequently Asked Questions
| Common myth | Reality |
|---|---|
| Technical Analysis predicts the future | Technical Analysis reads probability — not destiny |
| Indicators are magic | Indicators are math on past prices |
| More indicators = more accuracy | Two complementary tools beat ten conflicting ones |
| Technical Analysis doesn't work in India | Same patterns play out on NSE as on NYSE |
| Day trading is easy money | 85% of retail intraday traders lose money (SEBI study) |
“The four most dangerous words in investing are: 'this time it's different.'”
— Sir John Templeton
Is technical analysis just guessing?
No. Technical analysis is based on observable price data and documented behavioral finance principles. Chart patterns form because of predictable human biases like anchoring, herding, and loss aversion — mechanisms validated by Nobel Prize-winning research from Daniel Kahneman (2002) and Richard Thaler (2017).
Does technical analysis work on NSE and BSE stocks?
Yes. Technical analysis works on any liquid market where prices are determined by supply and demand. NSE and BSE list some of the most liquid stocks and derivatives in the world. Support, resistance, EMAs, and volume analysis work on Indian stocks exactly as they work on any global exchange.
Can technical analysis predict stock prices?
No. Technical analysis identifies probabilities, not predictions. A head and shoulders pattern historically results in a decline about 65-70% of the time — but the remaining 30-35% fail. Successful traders manage risk around these probabilities rather than treating signals as certainties.
Is fundamental analysis better than technical analysis?
Neither is inherently better — they answer different questions. Fundamental analysis identifies good companies to own. Technical analysis identifies good times to buy or sell them. The most successful market participants use both approaches together.
Do traders need expensive software for technical analysis?
No. Free tools like TradingView and Zerodha Kite provide everything beginners and intermediate traders need — real-time data, 100+ indicators, drawing tools, and alerts. Expensive software adds convenience for advanced features like backtesting and algorithmic execution, but is not required for learning or profitable trading.
What percentage of traders lose money?
According to SEBI data, approximately 89% of individual F&O traders in India lost money over a three-year period. This is not because technical analysis does not work — it is because most traders lack proper risk management, trade without defined strategies, and let emotions drive decisions.
Does technical analysis only work in trending markets?
No. While trend-following tools like moving averages work best during trends, oscillators like RSI and Bollinger Bands are designed specifically for range-bound conditions. Markets spend approximately 70% of their time in consolidation, and technical analysis provides tools for both market conditions.
No indicator, no pattern, no strategy works 100 percent of the time. Every myth survives because someone profits from traders believing it. Per the SEBI FY24-25 study, 91 percent of individual equity F&O traders lost money — usually from trusting a myth.
Continue Learning
- What Is Technical Analysis? — The foundation of everything
- How to Read Stock Charts — Turn chart data into trading decisions
- Set Up Your First Chart on TradingView — Get the right tools configured
- What Is a Trend? — Identify market direction
- Support and Resistance — The most important concept in chart analysis
- EMA Basics — Master moving averages
Risk Mantra: Every trade can fail. Every pattern can break. Every indicator can lag. The only thing a trader truly controls is the risk taken per trade. Protect your capital. Everything else follows.