
Quick Answer
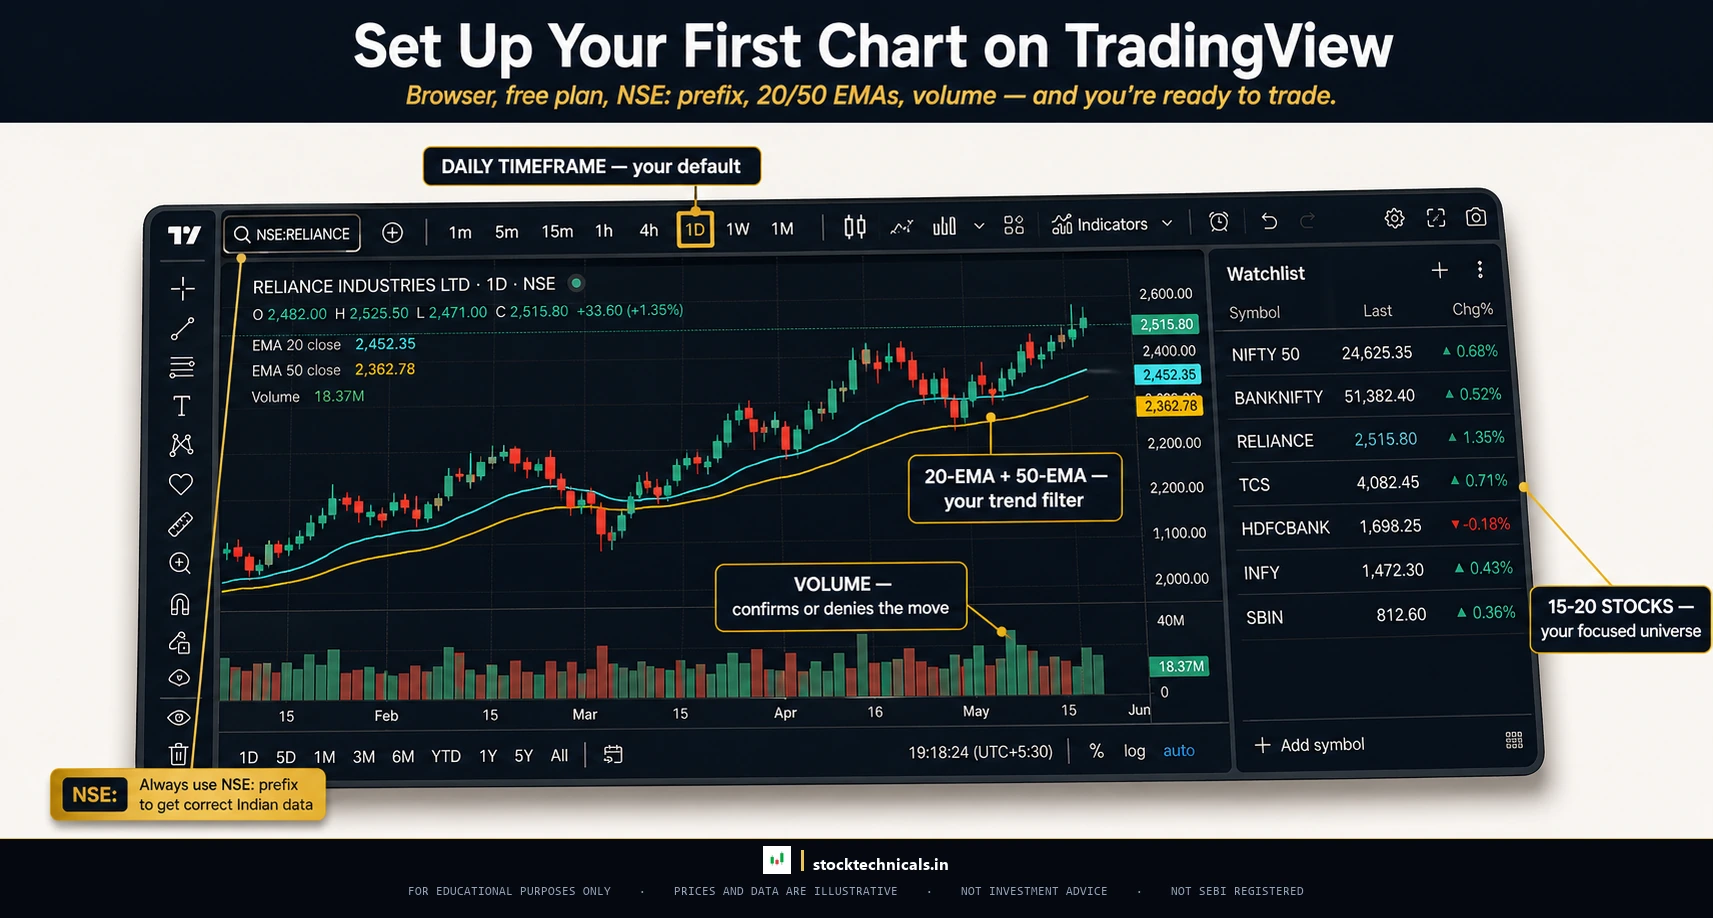
Set up TradingView with a free account, switch to candlestick charts on the daily timeframe, add three indicators (20-period EMA, 50-period EMA, and Volume), and save the layout as a template. That is the complete beginner setup — no more, no less.
Key Takeaways
- TradingView is free, browser-based, and covers NSE, BSE, and global exchanges
- The ideal beginner setup uses exactly three indicators: 20-EMA, 50-EMA, and Volume
- Always type NSE:SYMBOL when loading stocks to avoid pulling data from the wrong exchange
- Save the chart layout as a template so the setup never needs to be repeated
- Start on the daily timeframe — lower timeframes create noise and confusion for beginners
- Five keyboard shortcuts save more than 40 hours per year of charting time
- Use TradingView for analysis and a broker platform like Zerodha Kite for order execution
Why TradingView Is the Best Free Charting Platform
Before going into the setup, a quick word on why TradingView deserves the effort.
Published January 13, 2026 · Last refreshed April 27, 2026. Prices and data are compiled with reasonable care — always confirm against your broker before trading.
TradingView is a browser-based charting platform used by over 100 million traders worldwide. It works on any device — desktop, tablet, phone — without downloading software. The free plan gives access to features that most broker platforms charge for.
Here is what makes it stand out:
- Data for NSE, BSE, and global exchanges (free plan may have slight delay; paid plans get real-time)
- 100+ built-in indicators with full customisation
- Drawing tools that rival professional Bloomberg terminals
- Cloud-based — chart layouts save automatically and sync across devices
- Active community with shared ideas and scripts
- Pine Script for building custom indicators and strategies
Most for traders on NSE and BSE: TradingView has clean, fast, ad-free charts with proper exchange data. No other free platform comes close.
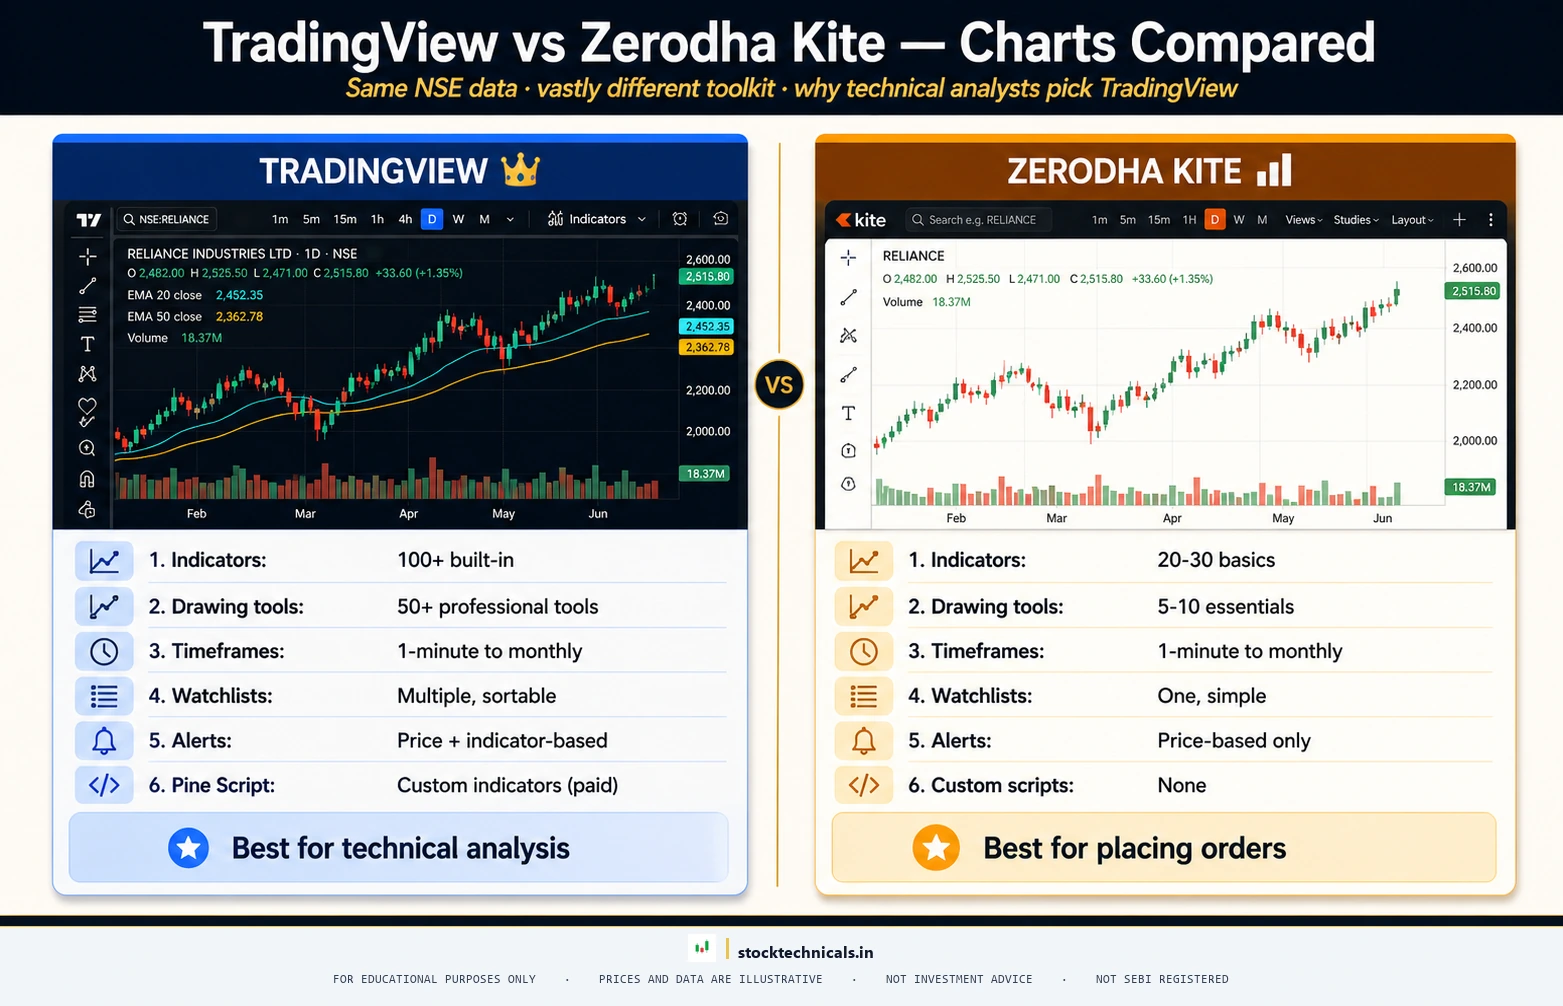
TradingView vs Zerodha Kite Charts

Zerodha Kite has decent charts for placing orders. But for actual technical analysis — identifying patterns, drawing trendlines, comparing multiple timeframes — Kite charts fall short.
| Feature | TradingView (Free) | Zerodha Kite |
|---|---|---|
| Indicators available | 100+ built-in | 100+ |
| Drawing tools | 90+ (Fibonacci, Gann, channels) | 30+ drawing tools |
| Timeframe options | 1-second to monthly | 1-minute to monthly |
| Multi-chart layout | Up to 2 (free) | Up to 8 (TradingView) / 4 (ChartIQ) |
| Alerts | 5 active (free) | Price alerts only |
| Community scripts | 100,000+ | None |
| Pine Script | Full access | Not available |
| Speed and smoothness | Excellent | Depends on connection |
The verdict: Use Kite for order execution. Use TradingView for analysis. That is the workflow most professional traders follow.
Free Plan vs Paid Plans — What Traders Actually Need
TradingView offers four tiers: Basic (free), Essential, Plus, and Premium.
The honest truth: the free plan is enough for 90% of beginners. Here is what the free plan includes:
- One chart per tab (enough for single-stock analysis)
- Three indicators per chart (EMA 20, EMA 50, and Volume — that is all most traders need)
- Five active price alerts
- Basic watchlist with multiple lists
- All drawing tools
- Full indicator library access
- Pine Script access for custom indicators
What the free plan does NOT include:
- Multiple charts side by side (need Essential plan at ~$12.95/month billed annually)
- More than three indicators per chart
- No ads (paid plans remove them)
- Extended hours data
- More than five active alerts
Recommendation: Start with the free plan. After three to six months of consistent charting, upgrade to Essential if the three-indicator limit becomes restrictive. Most traders never need more than that.
The The Bottom Line on TradingView
The Bottom Line
TradingView is the best free charting tool available. But it does not generate profits. No platform does. Most traders who fail on TradingView fail because of bad trading habits — impulsive entries, no stop-loss, no risk management — not because of bad software. The platform is a precision tool. In the hands of a disciplined trader, it is invaluable. In the hands of someone who treats markets like a casino, it is an expensive distraction. Set up the chart correctly, then focus on building the skills to actually use it. Read the guide on what technical analysis actually is before assuming that a chart tool will solve everything.
Create a TradingView Account
Setting up TradingView takes about two minutes. Here is the step-by-step process.
How to Sign Up
- Go to TradingView.com
- Click “Start free trial” or “Get started for free” — both lead to the same registration page
- Sign up using Google, Facebook, Apple, or email
- Choose a username — this is public, so pick something professional
- Select the free plan when prompted
That is it. No phone number required. No KYC. No payment details for the free plan.
First Things to Configure After Sign-Up
Before opening a single chart, configure these settings. Click the gear icon (Settings) in the top-right corner.
Timezone: Set to “Exchange” — this ensures candle timestamps match NSE trading hours (9:15 AM to 3:30 PM IST). Go to Settings, then Chart, then Timezone, and select “Exchange.”
Theme: TradingView defaults to light mode. Most traders prefer dark mode for extended screen time. Toggle it in Settings, then Appearance.
Language: English (default). No need to change unless preferred.
Session breaks: Enable this under Settings, then Chart, then Appearance. It adds vertical lines showing when the trading session starts and ends — helpful for identifying opening range and closing action.

Load the First Chart and Configure It
This is where the real work begins. Follow these steps exactly.
Opening a Stock Chart
In the top-left search bar, type the stock name. But here is the critical part — always prefix with “NSE:” for stocks listed on the National Stock Exchange.
- Type NSE:RELIANCE (not just "RELIANCE")
- Type NSE:INFY (not "INFY" — that might load a different exchange)
- Type NSE:HDFCBANK for HDFC Bank
- Type NSE:NIFTY for the Nifty 50 index
- Type NSE:BANKNIFTY for Bank Nifty
Why is this important? TradingView covers dozens of exchanges globally. Typing just "RELIANCE" might pull up Reliance stock from a different exchange with different data. Always use the NSE: prefix.
Pro tip: After selecting a stock, check the bottom-right of the chart. It should show "NSE" as the exchange source.

Setting the Chart Type to Candlesticks
By default, TradingView might show a line chart or a bar chart. Switch to candlestick charts immediately.
Click the chart type dropdown (usually shows a line icon in the top toolbar). Select "Candles" from the list.
Why candlesticks? Because they show four critical pieces of information — open, high, low, and close — in a single bar. Line charts only show the closing price. That is like watching a movie with the sound off.
For a detailed look into candlestick charts, read the guide on types of stock charts.
Setting the Timeframe
The timeframe dropdown is in the top toolbar (shows "D" for daily by default).
For beginners, start with the daily timeframe. Each candle represents one full trading day. This is the standard for swing trading and positional analysis.
Here is a quick reference:
- One-minute / Five-minute: Intraday scalping and day trading
- Fifteen-minute / One-hour: Intraday swing setups
- Daily: Swing trading and positional analysis (recommended starting point)
- Weekly: Long-term trend identification
- Monthly: Investment-grade analysis
Stick with Daily until the basics are solid. Switching to lower timeframes too early creates noise and confusion.
Adjusting the View and Navigation
- Scroll to zoom: Mouse wheel zooms in and out of the chart
- Click and drag: Moves the chart left and right to view history
- Double-click the price axis: Resets the vertical scale to auto-fit
- Double-click the time axis: Resets the horizontal zoom to show the full range
- Press Alt + R: Toggle between auto-scale and fixed scale
Add Essential Indicators — Keep It Simple
This is where most beginners go wrong. They add RSI, MACD, Bollinger Bands, Stochastic, SuperTrend, VWAP, ATR, and three different moving averages — all at once. The chart becomes unreadable.
The rule is simple: three indicators maximum on the free plan. And honestly, three is enough even on paid plans.
Adding the 20 EMA
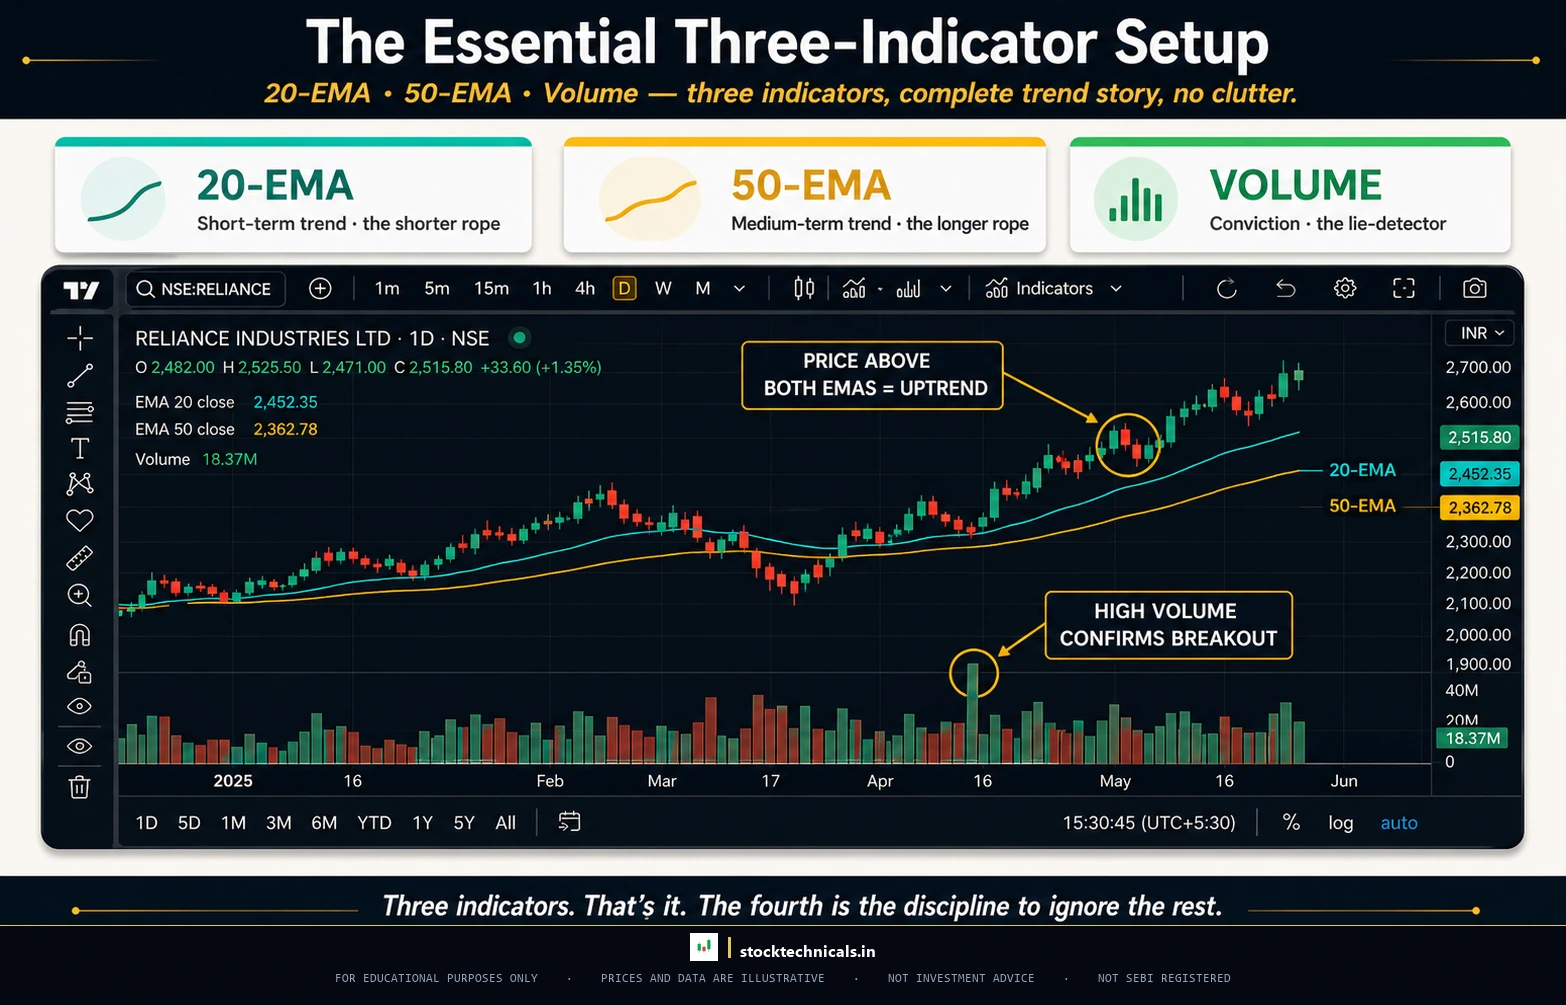
The 20-period Exponential Moving Average tracks short-term momentum. When price is above the 20 EMA, the short-term trend is bullish. Below it, bearish.
- Click the "Indicators" button in the top toolbar (looks like a wave icon, or press
/on the keyboard) - Type "EMA" in the search bar
- Select "Moving Average Exponential"
- In the indicator settings (click the gear icon on the indicator), change the "Length" to 20
- Set the colour to a bright teal or green for visibility
For more on how EMAs work, read the complete guide to EMA basics. To understand the difference between SMA and EMA, see SMA vs EMA.
Adding the 50 EMA
Add a second EMA with length set to 50. This tracks medium-term momentum. Use a different colour — gold or orange works well against the dark theme.
The 20 EMA and 50 EMA together create a powerful system:
- 20 EMA above 50 EMA: Bullish trend — look for buying opportunities
- 20 EMA below 50 EMA: Bearish trend — look for selling or staying out
- 20 EMA crossing above 50 EMA: Golden cross — potential trend reversal upward
- 20 EMA crossing below 50 EMA: Death cross — potential trend reversal downward
This concept is covered in detail in the guide on moving average crossovers.
Adding Volume
Volume shows how many shares were traded during each candle. High volume confirms price moves. Low volume warns of weak conviction.
- Click "Indicators" again (or press
/) - Type "Volume"
- Select "Volume" (the basic one, not Volume Profile or Volume Oscillator)
Volume appears as a histogram at the bottom of the chart. Green bars mean the close was higher than the open. Red bars mean the close was lower.
Why Only Three Indicators?
Every additional indicator adds noise. And on TradingView’s free plan, three is the hard limit anyway.
But even with unlimited indicators, three is the right number. Here is why:
- Indicators lag. They are all derived from the same price data. Adding more does not add new information.
- Conflicting signals. RSI says overbought, MACD says buy, Bollinger Bands says squeeze. Paralysis by analysis.
- Screen clutter. Price action becomes invisible under six overlapping lines.
The 20 EMA + 50 EMA + Volume setup covers trend direction, trend strength, and confirmation. That is a complete system for learning technical analysis.
Master the Drawing Tools
TradingView’s drawing tools are what separate it from broker platforms. These tools allow traders to mark up charts with support and resistance levels, trendlines, channels, and Fibonacci retracements.
Essential Drawing Tools
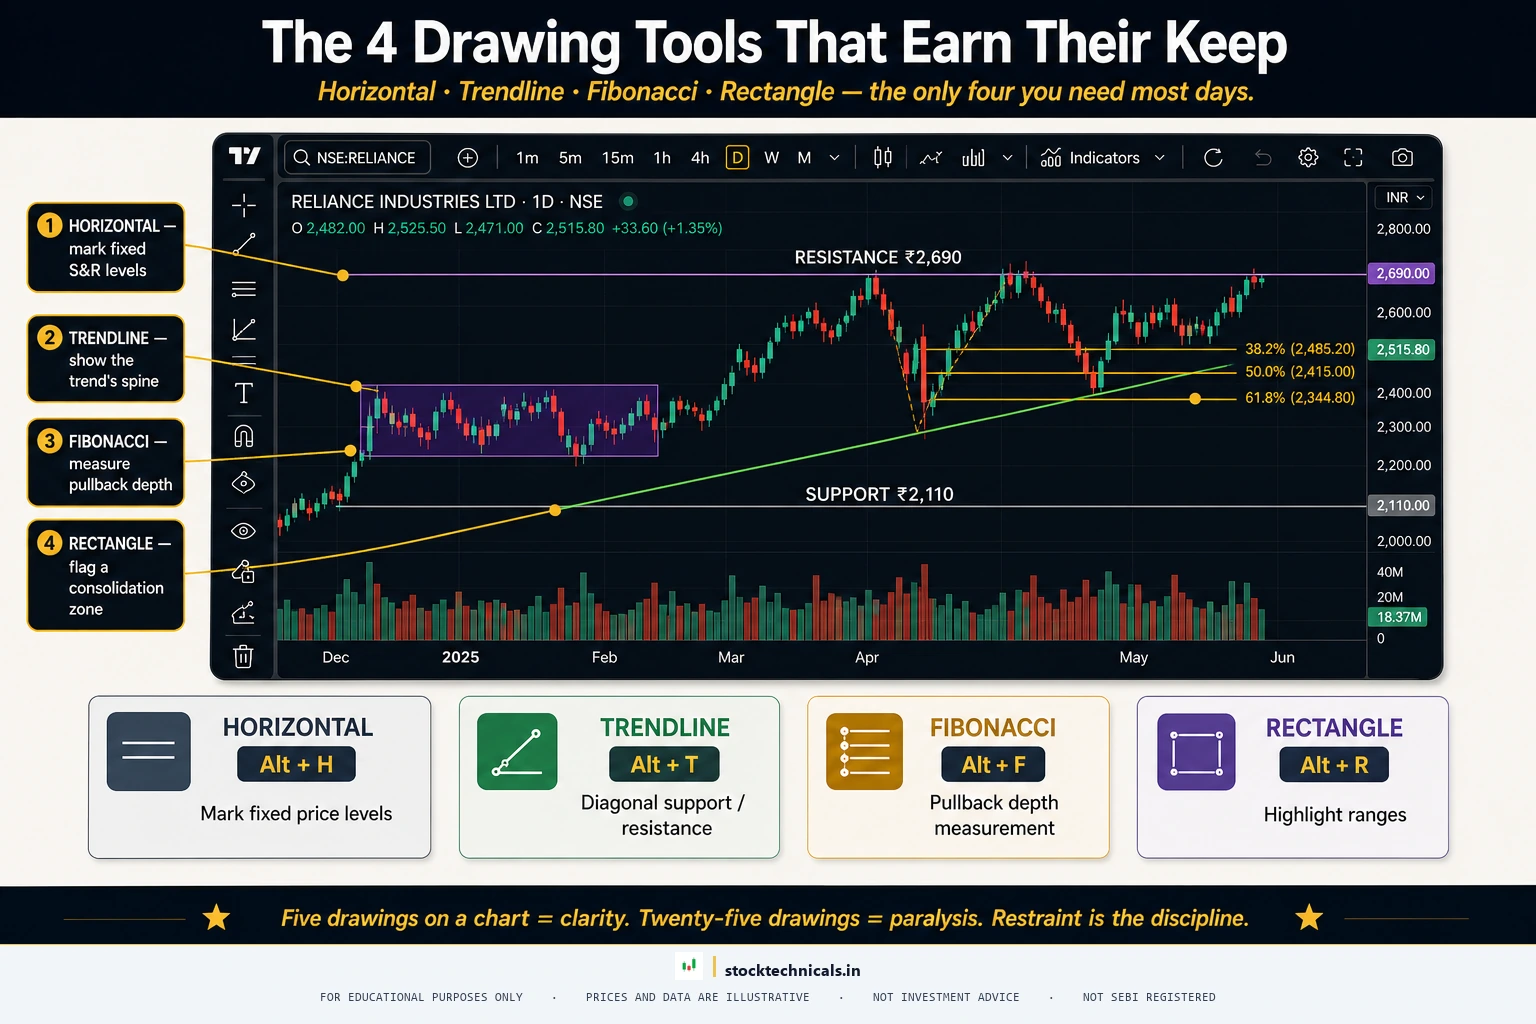
Horizontal Line — Used to mark support and resistance levels. Click the horizontal line tool (or press Alt + H), then click on the price level. These are the most important lines on any chart.
Trendline — Connect two or more swing lows for an uptrend line, or two or more swing highs for a downtrend line.
Fibonacci Retracement — Click the Fibonacci tool, then click on the swing low and drag to the swing high. The key levels — 38.2%, 50%, and 61.8% — automatically appear.
Rectangle — Used to highlight supply and demand zones, consolidation ranges, or key price areas.
Text and Label — Add notes directly on the chart. Useful for marking trade setups, noting key events, or adding reminders.
Drawing Tips That Save Time
- Lock drawings: Right-click any drawing and select "Lock" to prevent accidental moves
- Duplicate drawings: Select a drawing, then Ctrl + D to duplicate it
- Change colour and style: Double-click any drawing to open its settings panel
- Hide all drawings temporarily: Press Alt + D to toggle drawings on and off
- Magnetic mode: Enable the magnet icon in the toolbar — drawings snap to OHLC values automatically
How Many Drawings Should Be on a Chart?
Less than most traders think. A clean chart has two to three horizontal lines (major support and resistance), one trendline (if the trend is clear), one Fibonacci retracement (if a pullback is active) — and that is it.
If a chart has more than five or six drawings, it is cluttered. Remove old levels that price has clearly broken through.
Set Up Price Alerts
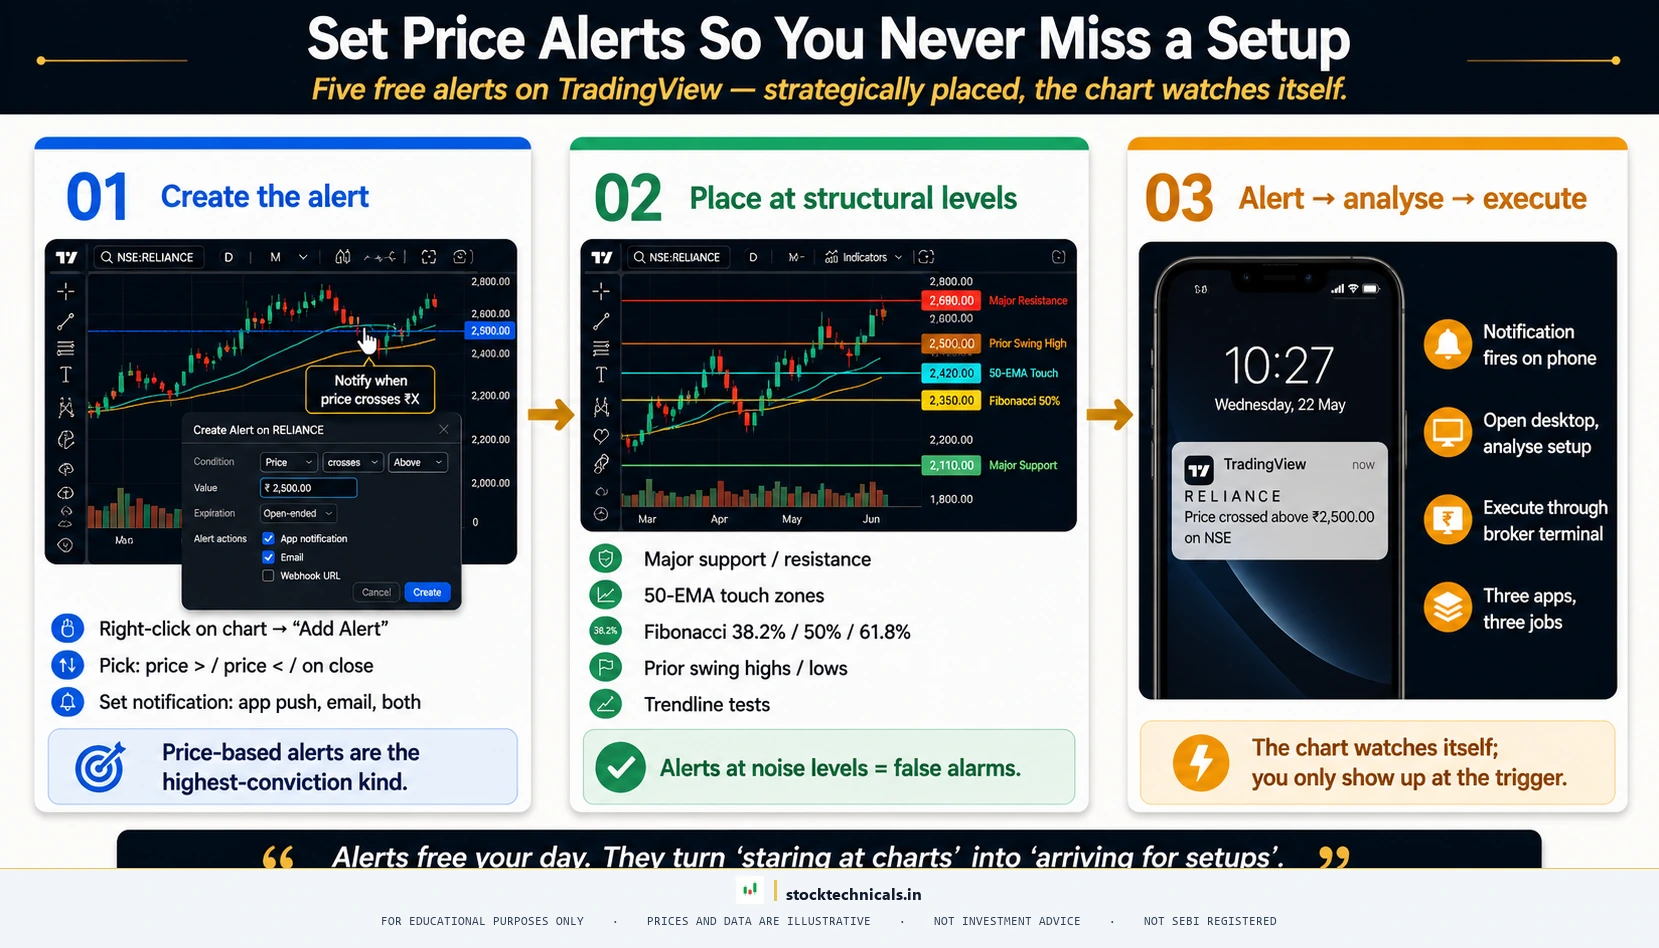
Alerts are one of TradingView’s most powerful features. Instead of staring at charts all day, set an alert and let TradingView notify when price reaches a key level.
How to Create a Price Alert
- Right-click on the chart at the desired price level
- Select "Add Alert"
- Set the condition (crossing, crossing up, crossing down, greater than, less than)
- Choose notification method — push notification (mobile app), email, or on-screen popup
- Add a name and message for the alert (for example: "RELIANCE near support — check for buy signal")
- Click "Create"
The free plan allows five active alerts. That is enough for five key levels across stocks being watched.
Alert Strategy for Swing Traders
- Set alerts at major support levels on two to three watchlist stocks
- Set alerts at breakout levels above consolidation patterns
- Set one alert on Nifty 50 at a key round number (like 23,000 or 24,000) as a market health check
- Set alerts at the 50 EMA on stocks that are pulling back in an uptrend
- Watch for false breakout scenarios — if an alert triggers and immediately reverses, that is a bull or bear trap
Managing the Five Alert Limit
- Prioritise: Only set alerts on the highest-conviction setups
- Rotate: When an alert triggers (or becomes irrelevant), delete it and set a new one
- Use expiration: Set alerts to expire after one to two weeks if the setup does not play out
- Combine conditions: Instead of three alerts on the same stock at different levels, set one alert at the most critical level
Build the Watchlist
A watchlist keeps favourite stocks organised and accessible. Without one, traders end up searching for the same stocks every morning.
Creating a Focused Watchlist
Recommended starter watchlist (15 to 20 stocks maximum):
- Indices: NSE:NIFTY, NSE:BANKNIFTY
- Large-cap leaders: NSE:RELIANCE, NSE:TCS, NSE:INFY, NSE:HDFCBANK, NSE:ICICIBANK
- High-beta movers: NSE:TATAMOTORS, NSE:ADANIENT, NSE:BAJFINANCE
- Sector representatives: NSE:ITC (FMCG), NSE:SUNPHARMA (Pharma), NSE:TATASTEEL (Metal), NSE:SBIN (PSU Bank)
The Morning Scan Routine
The spacebar shortcut is the most underrated feature on TradingView. With a 15-stock watchlist, pressing spacebar cycles through each stock in seconds. Open TradingView at 8:45 AM, start on the first stock, press spacebar to cycle through each stock, spend 20 to 30 seconds per chart assessing the current position relative to EMAs and support and resistance. After the full scan, set alerts on the two or three most interesting setups. This 15-stock scan takes about five minutes.
Save the Chart Layout as a Template
After configuring everything — candlesticks, EMA 20, EMA 50, volume, dark theme, NSE exchange — save it as a template. Never set this up again.
The Clean Swing Trading Layout
- Chart type: Candlestick
- Timeframe: Daily
- Indicator one: EMA 20 (teal or green colour, length 20)
- Indicator two: EMA 50 (gold or orange colour, length 50)
- Indicator three: Volume (default green and red)
- Theme: Dark
- Grid: Subtle (low opacity gridlines)
- Exchange: NSE (always verify)
Saving as a Template
- Set up the chart exactly as described above
- Click the template icon in the top toolbar (looks like a sheet of paper)
- Click "Save As" and name it "Clean Swing Setup"
- Check "Remember indicator parameters" and "Remember chart style"
- Click Save
Now, on any new chart, click the template icon and select "Clean Swing Setup." The entire configuration loads in one click.

What NOT to Add — Common Beginner Mistakes
- Multiple oscillators: Do not add RSI, Stochastic, AND MACD. Pick one oscillator. Start with RSI or MACD.
- Redundant moving averages: Two EMAs is enough. Adding SMA 50, SMA 200, EMA 9, and EMA 100 creates a mess.
- Bollinger Bands on top of EMAs: Both are moving average-based. They overlap and clutter. Learn about Bollinger Bands separately.
- Volume Profile with Volume histogram: Pick one. The basic Volume histogram is simpler for beginners.
- Community overlay scripts: Avoid unverified scripts — most repaint historical data.
Keyboard Shortcuts Every Trader Should Know
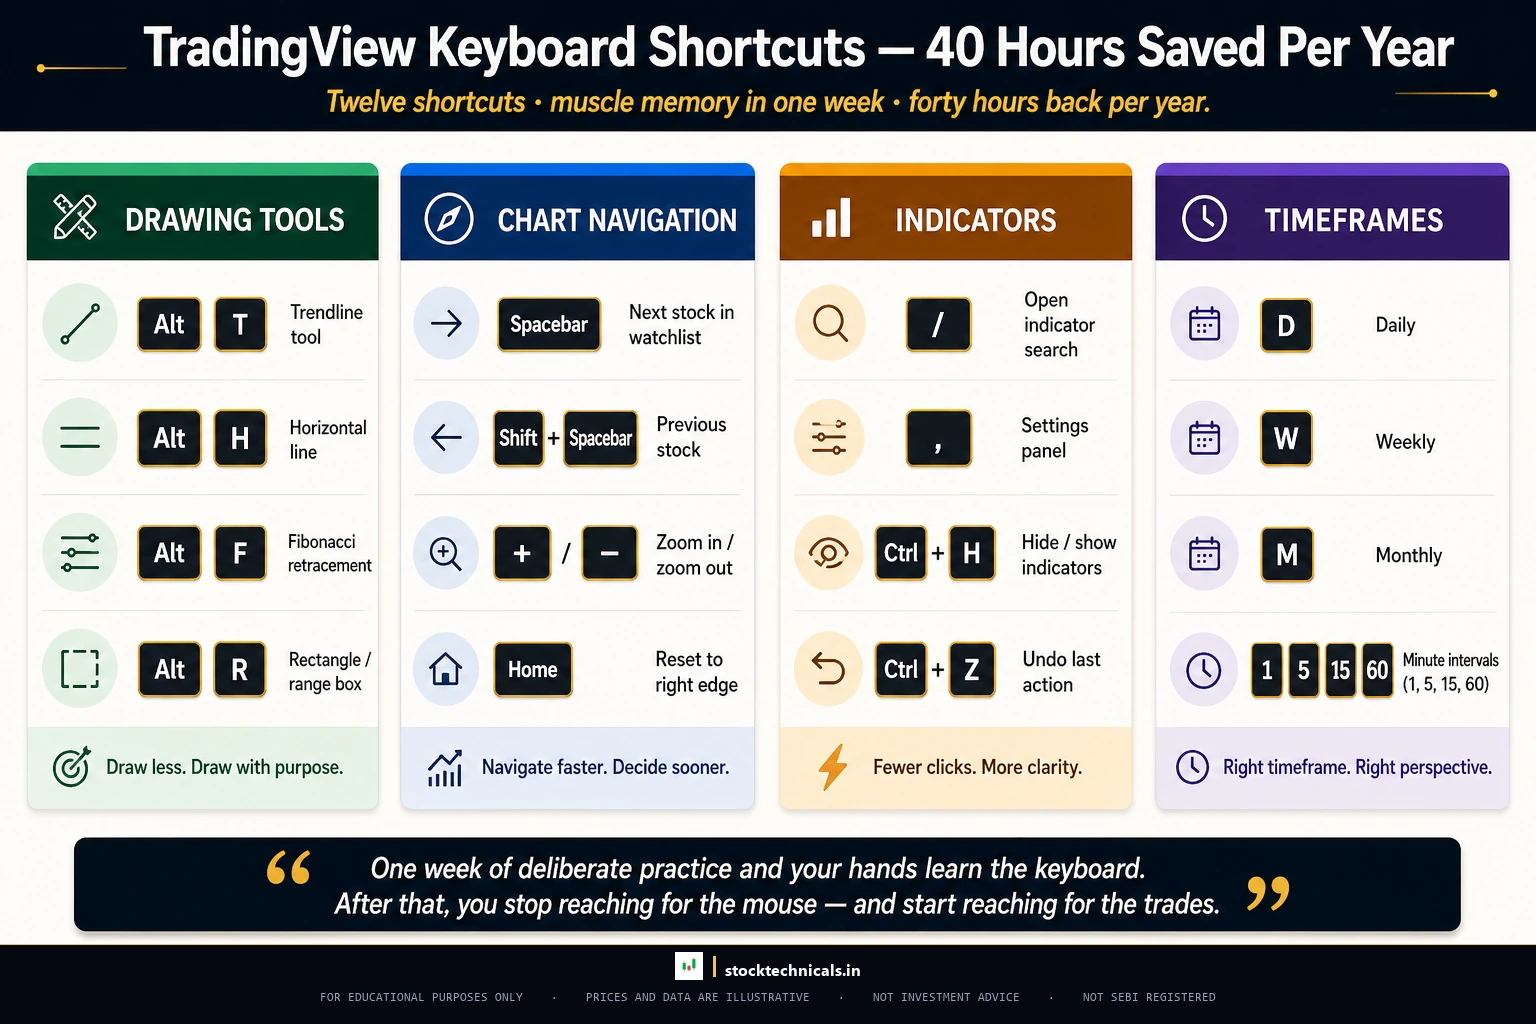
These shortcuts save hours over a week of charting. Memorise the top 12.
| Shortcut | Action |
|---|---|
| Alt + T | Trendline tool |
| Alt + H | Horizontal line tool |
| Alt + F | Fibonacci retracement tool |
| Alt + V | Vertical line tool |
| Alt + C | Crossline tool |
| Alt + D | Toggle all drawings on and off |
| / | Open indicators search |
| Alt + S | Take a screenshot of the chart |
| Ctrl + Z | Undo last action |
| Spacebar | Move to next stock in watchlist |
| Delete | Remove selected drawing |
TradingView on Mobile vs Desktop
Desktop (primary): Detailed chart analysis with drawing tools, multi-indicator setups, strategy backtesting, Pine Script development, template management.
Mobile (secondary): Checking alerts and watchlist, quick price checks, monitoring positions while away from desk, verifying alert triggers.
The rule: Do the analysis on desktop. Monitor on mobile. Trying to draw Fibonacci retracements on a six-inch phone screen is an exercise in frustration.
The Alert-to-Execution Workflow
For traders who use Zerodha Kite for order execution: TradingView alert triggers on phone → open TradingView mobile app, check the chart → if valid, switch to Kite app → place the order. This entire process takes under 30 seconds with practice.
Real Talk: What Beginners Discover After the First Month
Real Talk
After one month of using TradingView, most beginners hit the same wall: they can set up the chart perfectly but still do not know what to do when a stock is sitting at a level. That is because TradingView is just a tool. The actual skill is knowing how to read what the chart shows — reading stock charts takes practice. The setup described in this guide gives the clearest possible view. But the trader still needs to learn trends, support and resistance, breakouts, and pullbacks to turn that view into decisions.
Advanced TradingView Features Worth Exploring Later
Once the basics are solid, these features add more depth. But DO NOT explore them until the basic setup has been used consistently for at least four to six weeks.
Bar Replay — Practice Without Risk
TradingView’s Bar Replay feature lets traders practice chart analysis on historical data. It plays back the chart candle by candle, simulating real-time market movement. Note: Bar Replay requires the Essential plan or higher — it is not available on the free plan. Once available, click the "Replay" button in the top toolbar, select a starting date, and press Play.
Pine Script — Build Custom Indicators
TradingView has its own programming language called Pine Script (currently on version 6). It allows traders to build custom indicators, strategies, and alerts. Pine Script is free and does not require programming background for simple indicators. This is a future skill — master the basic charting first.
Stock Screener
TradingView has a built-in stock screener accessible from the bottom toolbar. Filter NSE stocks by performance, technicals (RSI, MACD, moving average position), and fundamentals (PE ratio, market cap, dividend yield). Useful for finding stocks to add to the watchlist.
Common TradingView Mistakes and How to Avoid Them
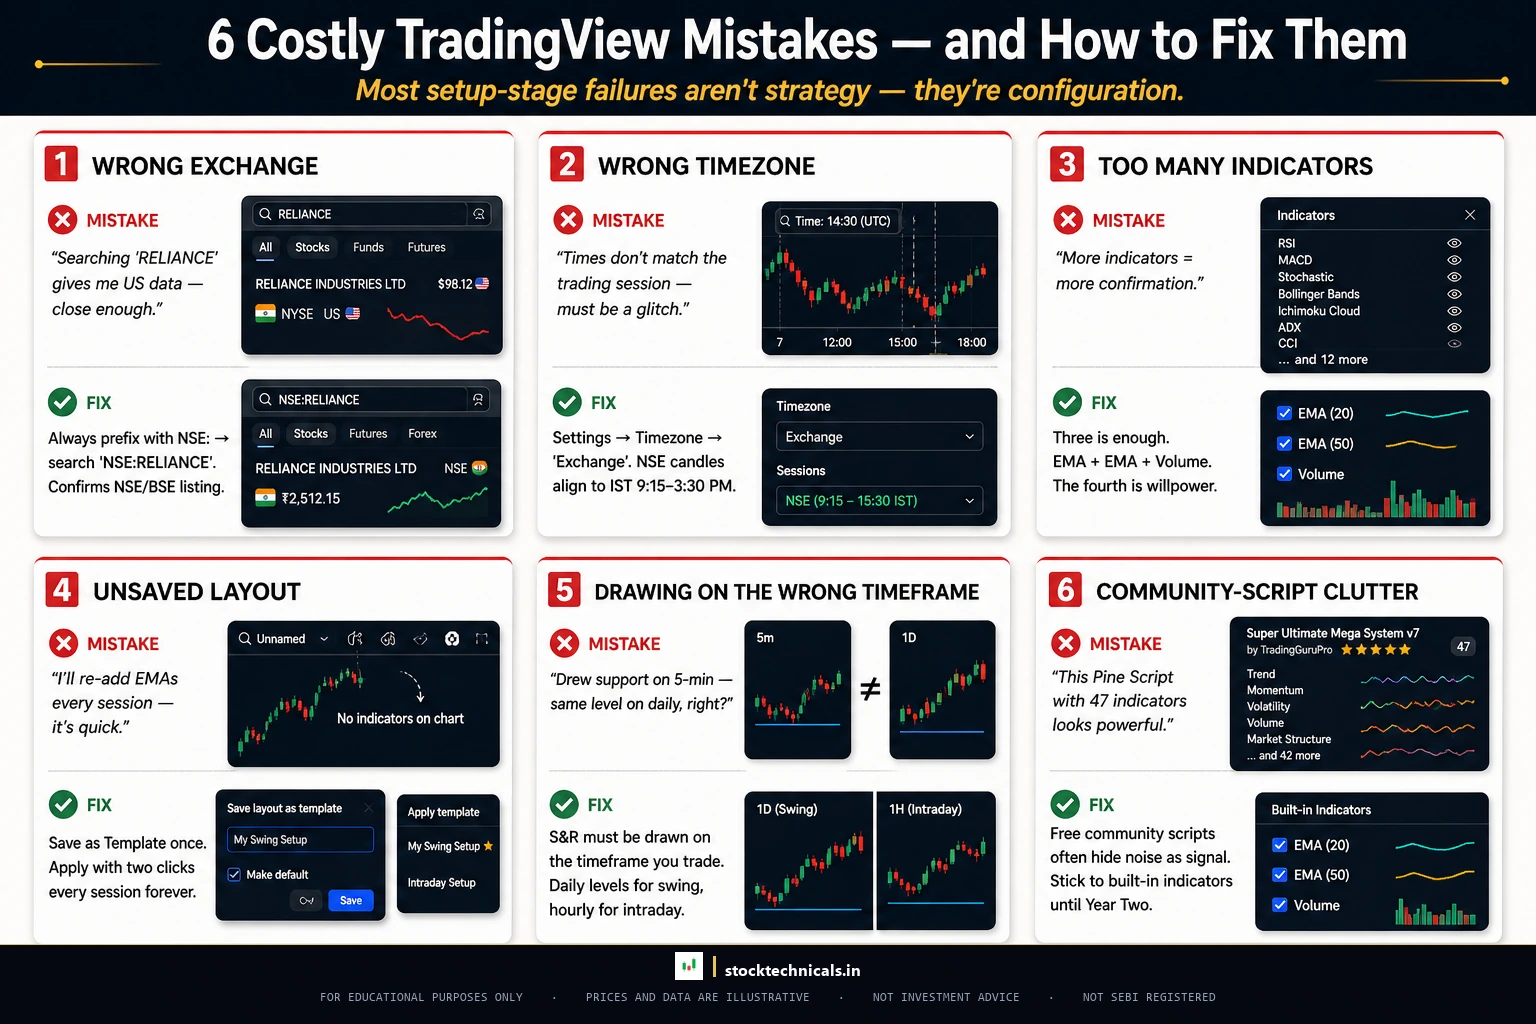
Using the Wrong Exchange
Searching "RELIANCE" without the NSE: prefix can pull up data from other exchanges. Always type NSE:SYMBOL. Check the exchange label in the bottom-right corner.
Wrong Timezone Setting
If candle timestamps do not match NSE market hours, the timezone is wrong. Set it to "Exchange" under Settings → Chart → Timezone.
Adding Too Many Indicators
Three indicators. Maximum. If the chart cannot breathe, remove something. The Supertrend indicator is useful, but not alongside three other indicators — learn it separately.
Not Saving the Layout
TradingView auto-saves chart changes but templates are a separate save. Always manually save the template after configuring.
Drawing on the Wrong Timeframe
A support line drawn on a five-minute chart means nothing on a daily chart. Always draw major levels on the daily or weekly timeframe first, then switch to lower timeframes for entry timing.
Cluttering with Community Scripts
TradingView’s library has over 100,000 community-created indicators. Most lag badly, repaint historical signals, or simply repackage basic indicators with fancy names. Stick with the built-in indicators.
Interactive Tool: TradingView Setup Checker
TradingView Setup Checker
Settings Verifier
Answer Yes or No to each question. Get a score with recommendations for any incorrect settings.
Keyboard Shortcut Quiz
Test your TradingView shortcut knowledge. Click the correct answer — instant feedback on each.
The Recommended Beginner Setup — Complete Summary
Account: Free plan (upgrade later only if needed)
Chart Configuration: Candlestick · Daily · Dark theme · Timezone set to Exchange
Indicators (three total): EMA 20 (teal) + EMA 50 (gold) + Volume
Drawing Tools: Horizontal line (support/resistance) + Trendline + Fibonacci retracement
Alerts: Five set at key support and resistance levels
Watchlist: 15 to 20 focused stocks with NSE: prefix
Template: Saved as "Clean Swing Setup" for instant loading
This setup is clean, functional, and sufficient for learning everything from chart reading to trend identification to pullback trading to head and shoulders patterns.
Rules for Using TradingView Effectively
Rule: Open TradingView at the same time every day. Whether before market open (8:45 AM) or after market close (3:45 PM), consistency builds routine.
Rule: Review the watchlist before looking at any other stock. Press spacebar to cycle through each stock, spend 30 seconds per chart assessing the current position relative to EMAs and support and resistance.
Rule: Take a chart screenshot before every trade. TradingView has a built-in screenshot tool (Alt + S). After 50 trades, review these screenshots to find patterns in decision-making.
Rule: Clean the chart every Friday. Remove old drawings, delete triggered alerts, archive inactive watchlist stocks.
Rule: Never trade directly from TradingView analysis. Use TradingView for analysis. Use the broker platform (Zerodha Kite, Angel One, Groww, Dhan) for execution. This separation prevents impulsive trades.
Test Your TradingView Knowledge
Quick Quiz — 5 Questions
What prefix should you always use when loading NSE stocks on TradingView?
How many indicators does the free plan allow per chart?
Which chart type shows Open, High, Low, and Close in a single bar?
What keyboard shortcut opens the indicator search on TradingView?
What should the timezone setting be for NSE stocks?
Frequently Asked Questions
Is TradingView free to use?
Yes. TradingView offers a free Basic plan that includes one chart per tab, three indicators per chart, five active alerts, all drawing tools, and access to the full indicator library. The free plan is sufficient for most beginners. Paid plans (Essential, Plus, Premium) add multi-chart layouts, more indicators, and ad-free experience.
Which timeframe should beginners use on TradingView?
Start with the daily timeframe. Each candle represents one full trading day, which gives enough data to identify trends, support and resistance levels, and chart patterns without the noise of lower timeframes. Switch to 15-minute or hourly charts only after mastering daily analysis.
How many indicators should a beginner chart have?
Three indicators maximum: a 20-period Exponential Moving Average (EMA) for short-term trend, a 50-period EMA for medium-term trend, and Volume for confirmation. This covers trend direction, trend strength, and trade validation. Adding more creates conflicting signals and chart clutter.
Is NSE data on TradingView real-time or delayed?
TradingView provides real-time data for NSE-listed stocks on all plans, including the free plan. However, some data providers may show a brief delay. Always verify the data freshness indicator at the bottom of the chart. For options and derivatives data, check the specific exchange requirements.
Can TradingView connect to Zerodha for live trading?
TradingView offers broker integration with select Indian brokers. However, most traders use TradingView purely for analysis and charting, then switch to their broker platform (Zerodha Kite, Angel One, Groww) for order execution. This separation prevents impulsive trades and is the workflow recommended by experienced traders.
Does the TradingView mobile app sync with desktop?
Yes. Every alert, watchlist, saved chart layout, and template syncs automatically between the mobile app and desktop browser. Changes made on one device appear instantly on the other. The mobile app is available on both Android and iOS.
How do beginners save chart layouts on TradingView?
After configuring the chart with candlesticks, EMA 20, EMA 50, and Volume on the daily timeframe, click the template icon in the top toolbar, click Save As, name it (for example, Clean Swing Setup), check Remember indicator parameters and Remember chart style, and click Save. On any new chart, load this template with one click.
A perfectly configured chart is still just a tool. The trader still has to pull the trigger and honour the stop. Per the SEBI FY24-25 study, 91 percent of individual equity F&O traders lost money — most with immaculate chart setups.
Continue Learning
Now that TradingView is set up, dive deeper into technical analysis:
- What Is Technical Analysis? — The foundation of everything
- How to Read Stock Charts — Turn chart data into trading decisions
- Types of Stock Charts — Line, bar, and candlestick explained
- What Is a Trend? — Identify market direction
- EMA Basics — Master the indicator you just added
- Support and Resistance — Draw the most important lines on any chart
Risk Mantra: Past chart patterns do not guarantee future results. Technical analysis is a probability tool, not a prediction tool. Never risk more than 2% of trading capital on a single trade. Protect your capital. Everything else follows.