Every trader eventually faces the same crossroads: which type of trading should I actually do? Some traders stare at screens for six hours straight, taking 30 trades a day. Others check their charts once a week. Both can be profitable, but only if the trader has chosen the right style for their capital, temperament, and life situation.
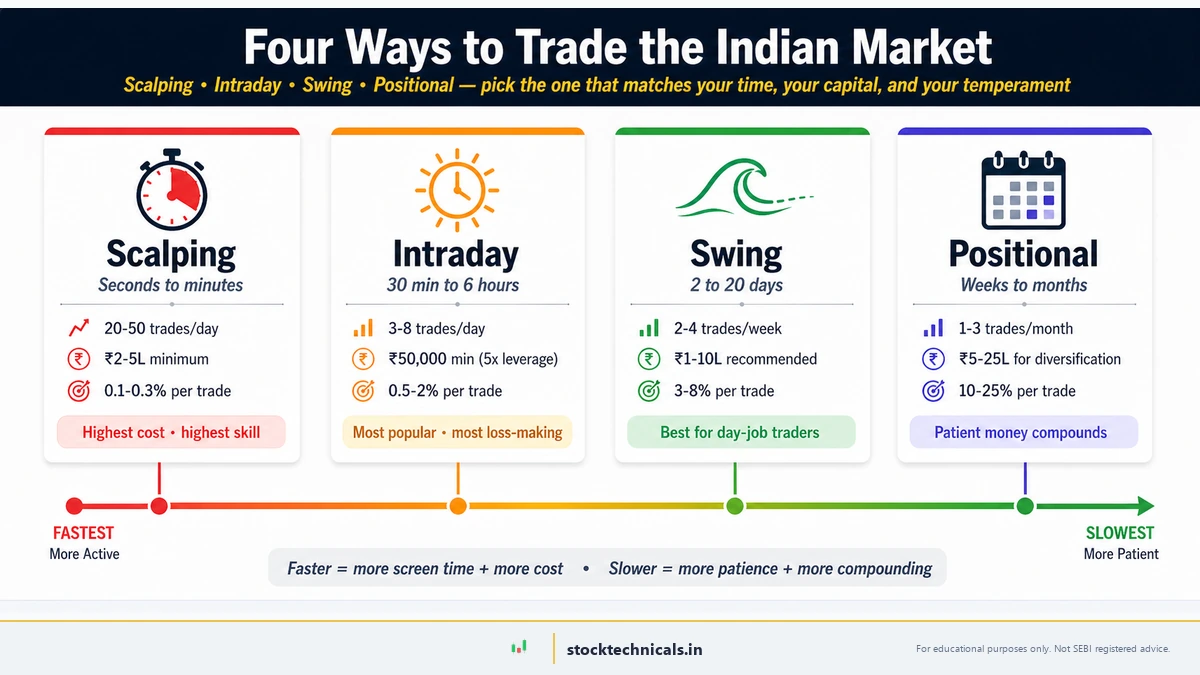
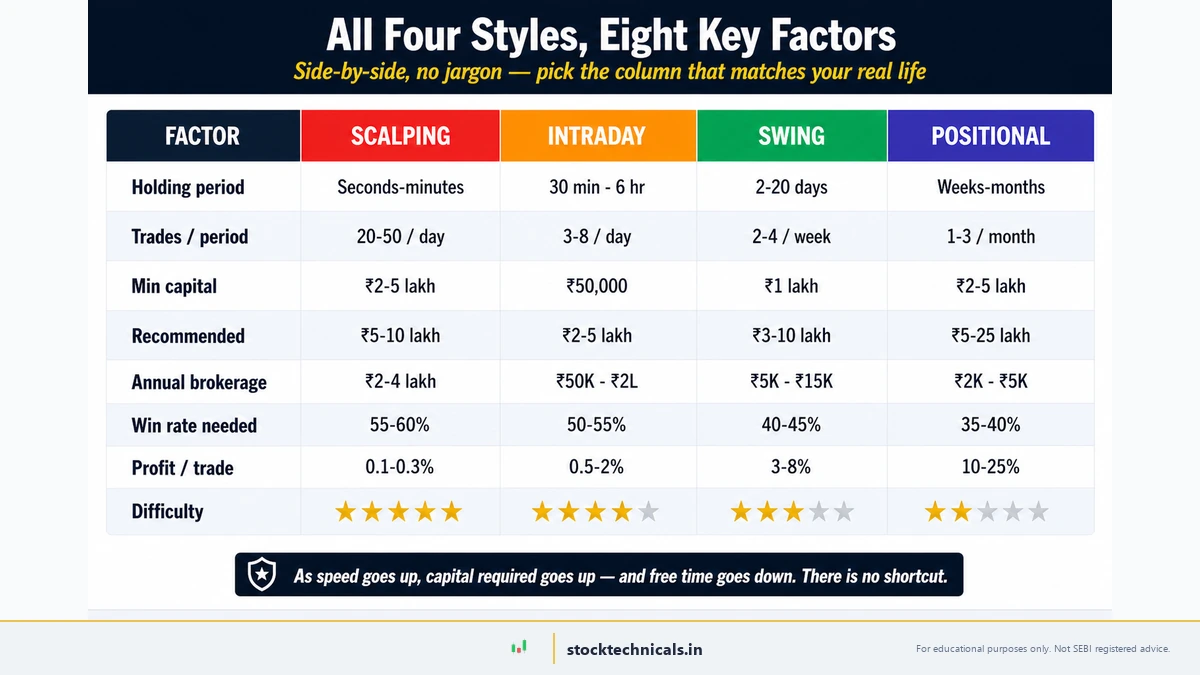
Quick Answer: The four main types of trading are scalping (seconds to minutes, 20 to 50 trades a day), intraday (minutes to hours, 3 to 8 trades a day), swing trading (2 to 20 days, 2 to 4 trades a week), and positional trading (weeks to months, 1 to 3 trades a month). Each demands a different combination of capital, screen time, and temperament. For most working professionals on NSE, swing trading is the realistic starting point — SEBI data confirms 91 percent of individual equity F&O traders lost money in FY24-25, and most of them were overtrading intraday.
This article breaks down the four main types of trading — scalping, intraday, swing, and positional — with real capital requirements in ₹, current SEBI regulations, verified stock examples from NSE, and an honest assessment of which style fits which trader. No sugar-coating. The SEBI comparative study released July 2025 confirms 91 percent of individual equity F&O traders in India lost money in FY24-25. The style a trader picks matters more than most realise.
Quick Answer: The four main types of trading are scalping (seconds to minutes, 20-50 trades per day), intraday (30 minutes to 6 hours, 3-8 trades per day), swing trading (2 to 20 days, 2-4 trades per week), and positional trading (weeks to months, 1-3 trades per month). Each requires different capital, screen time, and temperament. For most beginners and working professionals, swing trading offers the best balance of returns, risk, and time commitment.
Key Takeaways
- Scalping needs ₹2-10 lakh capital, 6+ hours of screen time, and expert-level execution speed — 93 percent of short-term traders lose money.
- Intraday trading requires 4-6 hours of undivided attention and ₹50K-5 lakh with margin — all positions must close by 3:20 PM IST.
- Swing trading is the sweet spot for most traders: 30-45 minutes per day, ₹1-10 lakh in delivery, and annual brokerage under ₹15,000.
- Positional trading suits patient capital (₹2-25 lakh) with weekly-only chart review — the lowest stress, lowest cost, highest tax efficiency approach.
- The SEBI FY24-25 study found 91 percent of individual F&O traders lost money, with aggregate net losses of ₹1.06 lakh crore. Choosing the right style is the first line of defence.
- Tax impact matters: delivery trades (swing and positional) attract 20 percent STCG or 12.5 percent LTCG, while intraday profits are taxed as speculative business income at the slab rate.
Why Choosing the Right Trading Style Matters
Here is what happens when traders pick the wrong style:
- A working professional with a 9-to-5 job tries scalping — misses entries because of meetings, takes impulsive trades during lunch breaks, blows up the account in two weeks.
- A retired person with ₹50 lakh sits in cash, too scared of intraday, missing 15 percent annual returns that positional trading on Nifty 50 would have delivered.
- A college student with ₹20,000 tries positional trading — capital too small, returns too slow, gets bored and switches to options gambling.
The trading style must match three things: available time, available capital, and emotional temperament. Get this wrong and no amount of technical analysis knowledge will save the account.
Every style covered here uses the same foundation — reading stock charts, understanding trends, and recognising candlestick patterns. The difference is in the holding period and trade frequency.
Scalping: The Fastest Game in the Market
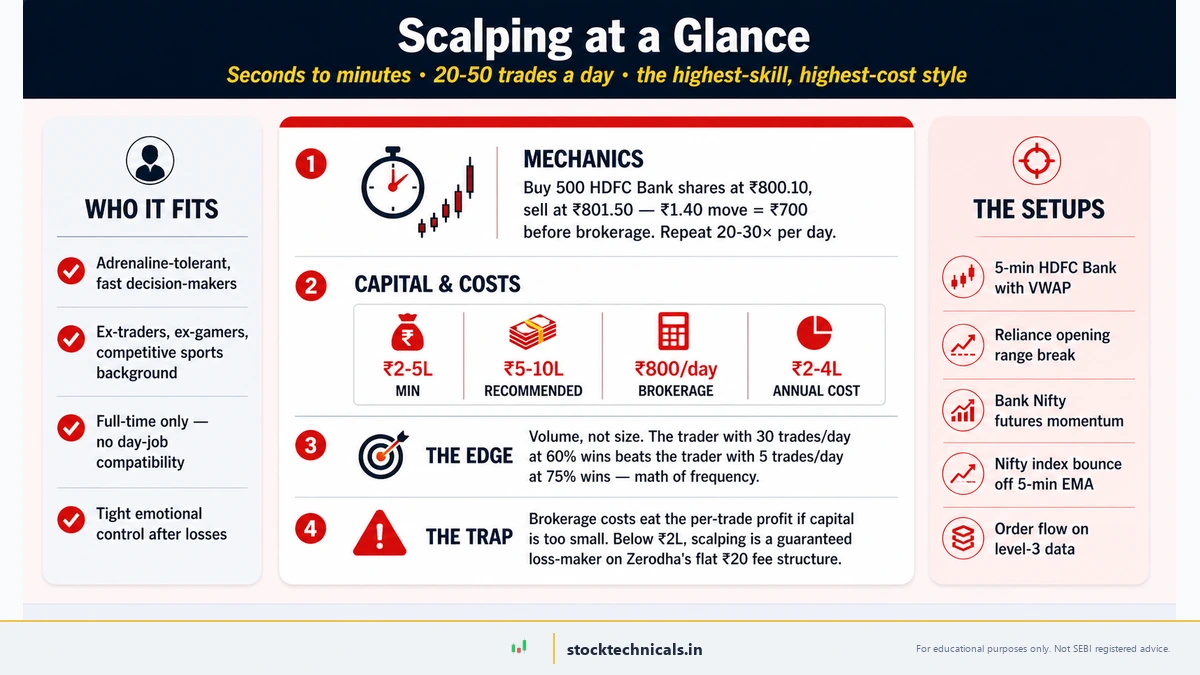
SCALPING (a trading style where positions are held for seconds to minutes, aiming for tiny profits on each trade) is the most intense form of trading. Scalpers enter and exit positions within seconds to minutes, targeting ₹0.50 to ₹5 per share movement.
How Scalping Works
A scalper on HDFC Bank (NSE: HDFCBANK) (trading around ₹800) might buy 500 shares at ₹800.10, sell at ₹801.50 — a ₹1.40 move — and pocket ₹700 before brokerage. Then repeat this 20 to 30 times per day. The math is simple: small profits multiplied by high frequency. A scalper making ₹200 to ₹500 per trade across 20 trades earns ₹4,000 to ₹10,000 daily — before costs.
Capital and Costs for Scalping
- Minimum capital: ₹2-5 lakh (equity) or ₹1-2 lakh (futures with leverage)
- Recommended: ₹5-10 lakh
- Brokerage impact: At ₹20 per order (Zerodha), 40 orders per day costs ₹800. Monthly brokerage alone hits ₹16,000-20,000. This is why scalpers need high capital — the per-trade profit must exceed costs.
- Annual brokerage: ₹2-4 lakh — the highest of any style
Who Scalping Suits and Who It Does Not
Suits: Full-time traders with zero distractions during market hours (9:15 AM to 3:30 PM IST), fast internet, at least 6 months of screen time experience, and people who thrive under pressure and make quick decisions without hesitation.
Does NOT suit: Anyone with a day job (even work-from-home with meetings), beginners learning how to read charts for the first time, traders who freeze under pressure, and anyone trading from a mobile phone.
Common Scalping Setups on NSE
Range breakout scalping is the most popular approach. The scalper identifies a stock trading in a tight ₹2-3 range for 15 to 20 minutes, then enters on a volume spike when price breaks the range. Tata Steel, SBIN, and ICICI Bank are popular scalping stocks due to tight spreads and high daily volume.
VWAP pullback scalping uses the volume-weighted average price as a dynamic reference. When price pulls back to VWAP from above, the scalper buys at VWAP and targets a quick ₹1-2 bounce.
The brutal truth: Scalping looks glamorous in YouTube videos. The SEBI comparative study (July 2025) shows that among short-term traders holding positions for less than an hour, the loss percentage is even higher than the overall 91 percent. A scalper who makes ₹500 on 12 trades and loses ₹600 on 8 trades ends the day with ₹1,200 net. After ₹800 in brokerage, the real profit is ₹400 for five hours of intense work.
Intraday Trading: Same-Day Positions
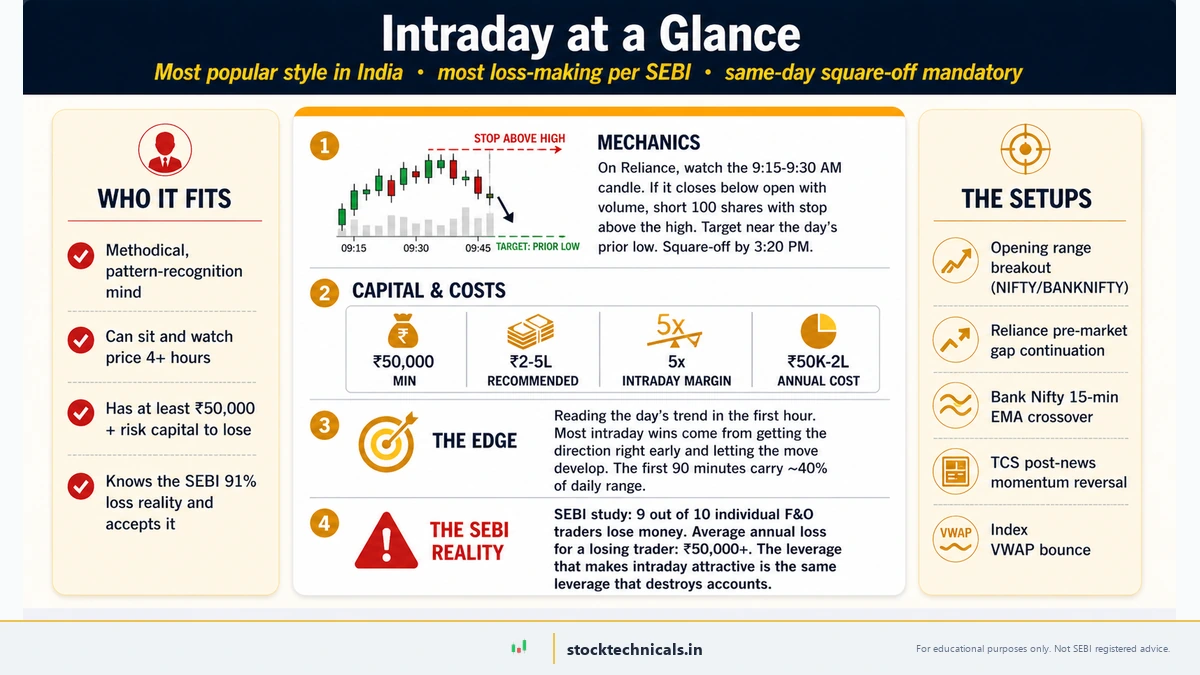
INTRADAY TRADING (buying and selling securities within the same trading day, with all positions squared off before 3:20 PM IST) is the most popular style among retail traders in India — and also the most loss-making.
How Intraday Trading Works
An intraday trader on Reliance (April 6, 2026) watches the first 15-minute candle open at ₹1,355 and close at ₹1,325 — a ₹30 drop confirming bearish momentum. They short 100 shares at ₹1,325 using margin, set a stop loss at ₹1,355 (above the opening high), and target ₹1,295 near the day’s low. The stock hits ₹1,290 by 12:30 PM. Unlike scalpers, intraday traders take 3 to 8 trades per day with larger targets. The holding period is 30 minutes to 6 hours.
Capital and Costs for Intraday
- Minimum: ₹50,000 (with margin leverage, effectively ₹2.5-5 lakh buying power)
- Recommended: ₹2-5 lakh
- Margin facility: Brokers like Zerodha offer up to 5x margin for intraday equity. For F&O, margins are defined by NSE’s SPAN calculator.
- Annual brokerage: ₹50,000 to ₹2 lakh
The SEBI Reality Check
The SEBI comparative study released July 2025 covering FY24-25 is worth reading twice:
- 91 percent of individual traders in the equity F&O segment incurred losses during FY24-25
- The average loss was ₹1.1 lakh per trader
- Aggregate net losses surged 41 percent year-on-year to ₹1.06 lakh crore
- The study analysed nearly 9.6 million individual investors
- Only 9 percent made a net profit — and even among them, many made less than their transaction costs
These numbers do not lie. Intraday trading, including the F&O variety, is a negative-sum game for most participants. The 9 percent who profit consistently have years of experience, disciplined risk management, and significant capital.
Common Intraday Setups on NSE
Opening Range Breakout (ORB): The first 15 to 30 minutes after market open establish a range. When price breaks above the high of this range with volume, intraday traders go long. This is the single most popular intraday strategy on Nifty and Bank Nifty.
VWAP mean reversion: When a stock deviates significantly above VWAP (1.5 to 2 percent), intraday traders short with a target to return to VWAP. HDFC Bank, Reliance, and Infosys respond well to this strategy.
Gap fill strategy: When a stock opens with a gap of 1 to 2 percent, experienced intraday traders often fade the gap during the first 30 to 60 minutes.
Swing Trading: Riding Multi-Day Moves
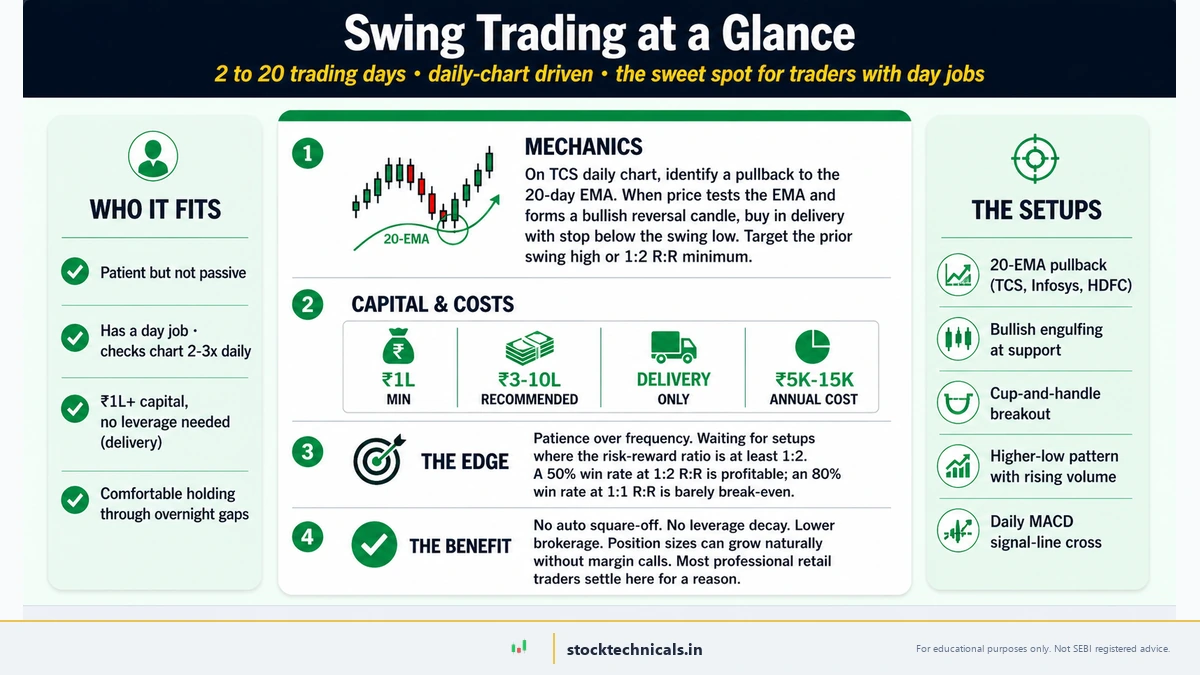
SWING TRADING (holding positions for 2 to 20 trading days, capturing one complete price swing from a swing low to a swing high or vice versa) is the sweet spot for most traders — especially those with day jobs.
How Swing Trading Works
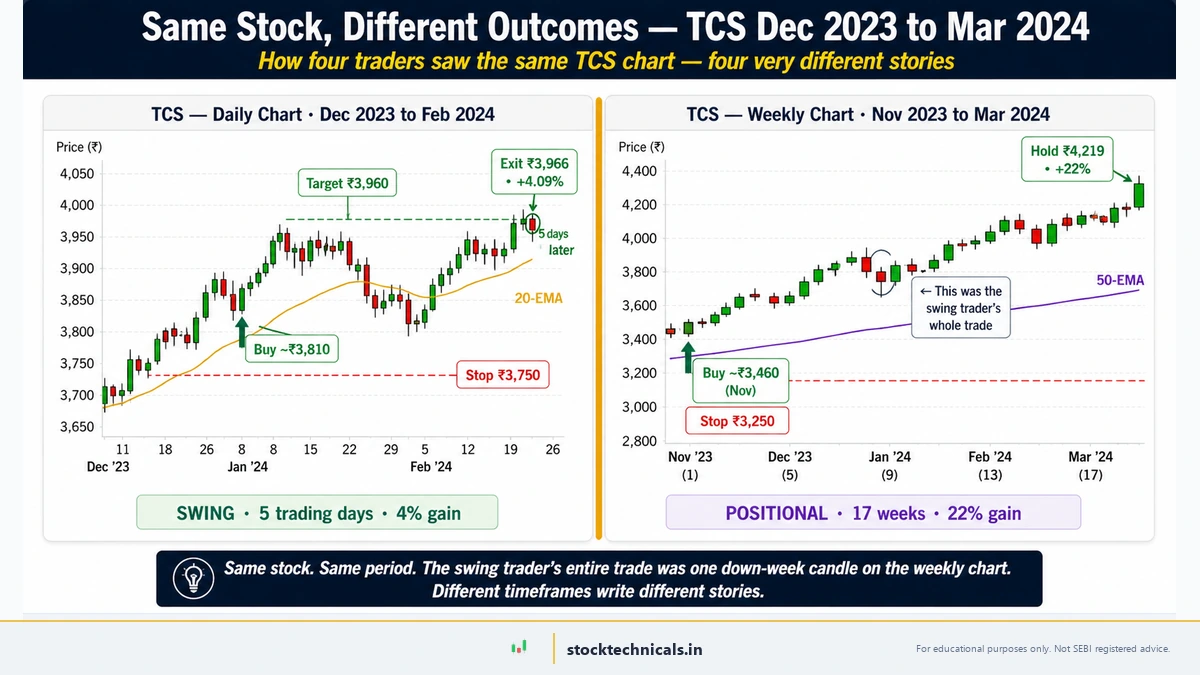
A swing trader on TCS (trading around ₹3,800 in January 2024) identifies a pullback to the 20-day EMA at ₹3,813. The Jan 25 close at ₹3,810.30 sat within 0.07 percent of the rising EMA — a near-perfect kiss. The trader buys at ₹3,810 in the delivery segment, sets a stop loss at ₹3,750 (below the swing low), and targets ₹3,960. Five trading days later, TCS closed at ₹3,966.30 — a 4.09 percent gain with a clean risk-reward of roughly 1:2.5.
The key difference from intraday: positions are held overnight and for multiple days. This means no margin facility for equity (delivery trades require full capital) but also no pressure to exit before 3:15 PM.
Capital and Costs for Swing Trading
- Minimum: ₹1 lakh (delivery, no leverage)
- Recommended: ₹3-10 lakh
- No margin pressure: Full share value is debited, but there is no risk of auto-square-off.
- Annual brokerage: ₹5,000-15,000 — dramatically lower than intraday or scalping
Why Experts Recommend Swing Trading for Beginners
The answer is math. Lower transaction costs: 2 to 4 trades per week versus 20 to 40 per day. More time to think: entries and exits are planned the evening before. Better risk-reward ratios: swing trades target 3 to 8 percent moves versus 0.5 to 1 percent for intraday. And the sleep factor — positions are set with stop losses, the trader does not need to watch every tick.
Common Swing Trading Setups on NSE
EMA pullback entry: The most reliable swing setup. When a stock in an uptrend pulls back to its 20-day EMA and forms a bullish candlestick pattern (hammer, bullish engulfing), the swing trader enters long with a stop below the recent swing low. TCS, Infosys, and HDFC Bank frequently offer this setup.
Breakout and retest: When a stock breaks above a key resistance level, it often pulls back to test that level as new support. The swing trader enters on this retest with confirmation from volume.
Positional Trading: The Patient Approach
POSITIONAL TRADING (holding positions for weeks to months, riding major trends and ignoring short-term noise) is closest to investing but with a technical analysis edge.
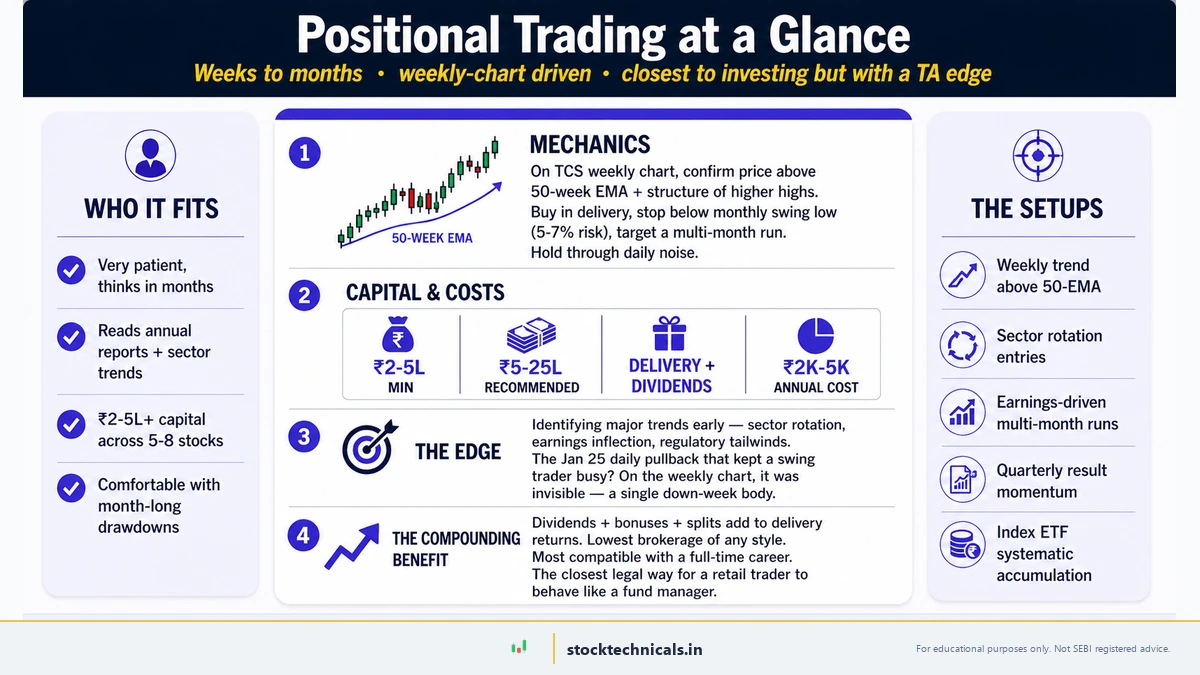
How Positional Trading Works
A positional trader on TCS in November 2023 identifies the stock trading above its 50-week EMA (₹3,381) on the weekly chart. They buy 50 shares in delivery at ₹3,460 with a stop loss at ₹3,250 (below the monthly swing low — a 6 percent risk). Target: ₹4,200 over 3 to 4 months. Seventeen weeks later, TCS closed at ₹4,219.25 — a 22 percent gain with the weekly close holding above the 50-week EMA every single week. The Jan 25 daily pullback that a swing trader would have actively traded? On the weekly chart, it was invisible — a single down-week body that barely dented the trend.
Capital and Costs for Positional Trading
- Minimum: ₹2-5 lakh (delivery only)
- Recommended: ₹5-25 lakh for proper diversification across 5-8 stocks
- Dividends and bonuses: Unlike intraday, positional traders benefit from corporate actions
- Annual brokerage: ₹2,000-5,000 — the lowest of any style
Common Positional Setups on NSE
Golden cross entry: When the 50-day EMA crosses above the 200-day EMA on the daily chart, it signals a potential long-term bullish trend. Positional traders enter and hold as long as the 50-day EMA stays above the 200-day EMA.
Monthly breakout: When a Nifty 50 stock breaks above its all-time high on the monthly chart with volume expansion, positional traders buy and trail with the 50-day EMA. These moves often run 15 to 30 percent over the next 3 to 6 months.
Sector rotation (quarterly): Positional traders review sector performance every quarter. Money flows from weak sectors to strong ones — a trader who was in Nifty IT in Q1 might rotate to Nifty Bank in Q2 if the relative strength shifts.
Head-to-Head Comparison: All Four Styles
Risk-Reward Profile by Style
Scalping: Tiny reward per trade (0.1 to 0.3 percent) executed 20 to 50 times daily. The edge comes from trade volume, not the size of any single move. A bad day might mean 15 losing trades out of 30.
Intraday: Moderate reward per trade (0.5 to 2 percent) with 3 to 8 trades daily. The edge comes from correctly reading the day’s trend direction in the first hour.
Swing: Larger reward per trade (3 to 8 percent) with 2 to 4 trades per week. The edge comes from patience — waiting for setups where the risk-reward ratio is 1:2 or better.
Positional: Largest reward per trade (10 to 25 percent) with 1 to 3 trades per month. The edge comes from identifying major trends early and holding through noise.
Same Stock, Different Outcomes
TCS between December 2023 and March 2024 tells the whole story. A swing trader spotted the Jan 25 pullback to the 20-day EMA, entered at ₹3,810, and exited at ₹3,966 in five days — a 4 percent swing gain. A positional trader was already in since November, held through that pullback without blinking, and exited in March at ₹4,219 — a 22 percent gain over 17 weeks. Same stock, same period, two completely different trades because the trading style determined the holding period.
Zoom out further and the Nifty 50 monthly chart shows why long-term positional traders and investors sleep well. From the COVID low of 7,610 in March 2020 to the November 2025 peak of 26,203, the index delivered 3.44 times growth — a 244 percent return over roughly 5 years. Three drawdowns of 14 to 17 percent are visible on the monthly chart, but each one was a temporary blip in the long-term uptrend.
Which Trading Style Fits Your Personality?
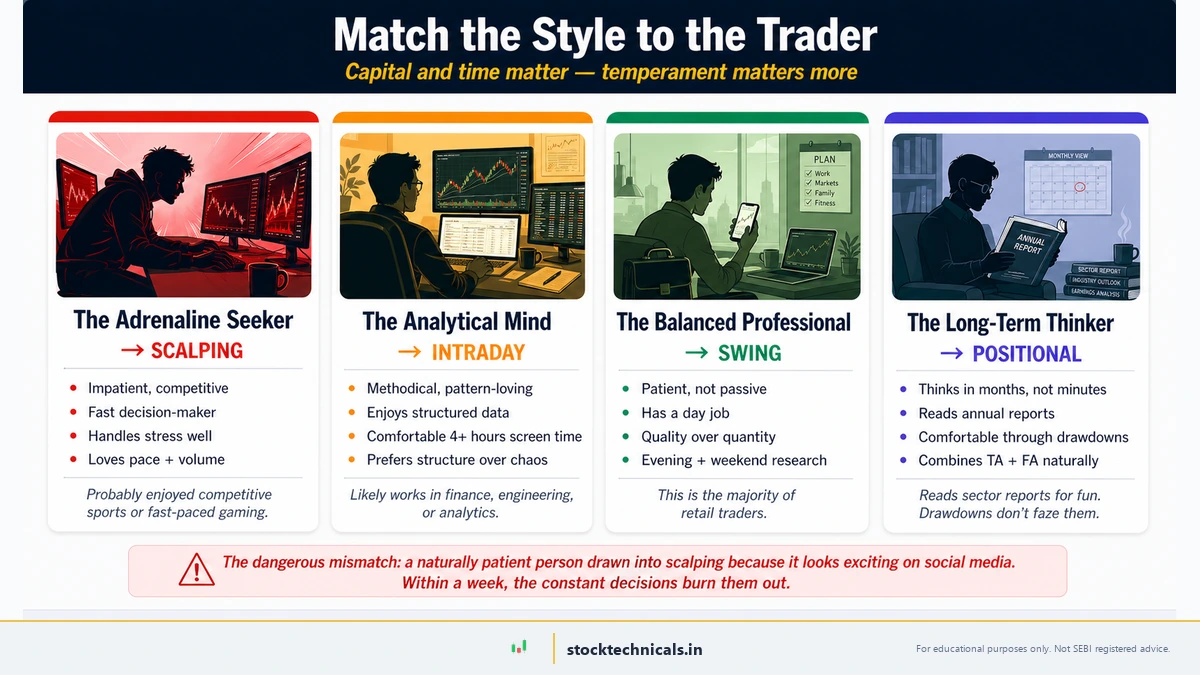
Trading style is not just about capital and time — it is about temperament.
The Adrenaline Seeker → Scalping: Impatient, fast decision-maker, competitive, handles stress well, does not dwell on losses. This person probably enjoyed competitive sports or fast-paced video games.
The Analytical Mind → Intraday: Methodical, enjoys patterns and data, can sit for hours analysing, prefers structure over chaos. This trader likely works in finance, engineering, or analytics.
The Balanced Professional → Swing Trading: Patient but not passive, enjoys research, has a day job, prefers quality over quantity. This is the majority of retail traders.
The Long-Term Thinker → Positional: Very patient, thinks in months not minutes, dislikes frequent decision-making, comfortable sitting through drawdowns. This trader reads annual reports, tracks sector trends, and combines technical analysis with fundamental analysis.
The Dangerous Mismatch
The most common failure pattern: a naturally patient person gets drawn into scalping because it looks exciting on social media. Within a week, the constant decision-making causes analysis paralysis, the rapid losses trigger revenge trading, and the account is down 30 percent before the trader understands what happened. Equally dangerous: an adrenaline seeker trying positional trading. The boredom sets in after two days. Matching temperament to style is the single biggest determinant of long-term survival in markets.
SEBI Rules Every Trader Must Know
Intraday and Scalping Rules
- Auto square-off: All intraday positions are automatically closed at 3:20 to 3:25 PM by the broker
- Margin requirements: SEBI mandates minimum VAR + ELM margins. Brokers can offer additional leverage (up to 5x for equity intraday)
- Peak margin reporting: Since 2021, SEBI requires 100 percent upfront margin collection
- STT (Securities Transaction Tax): 0.025 percent on sell side for intraday equity
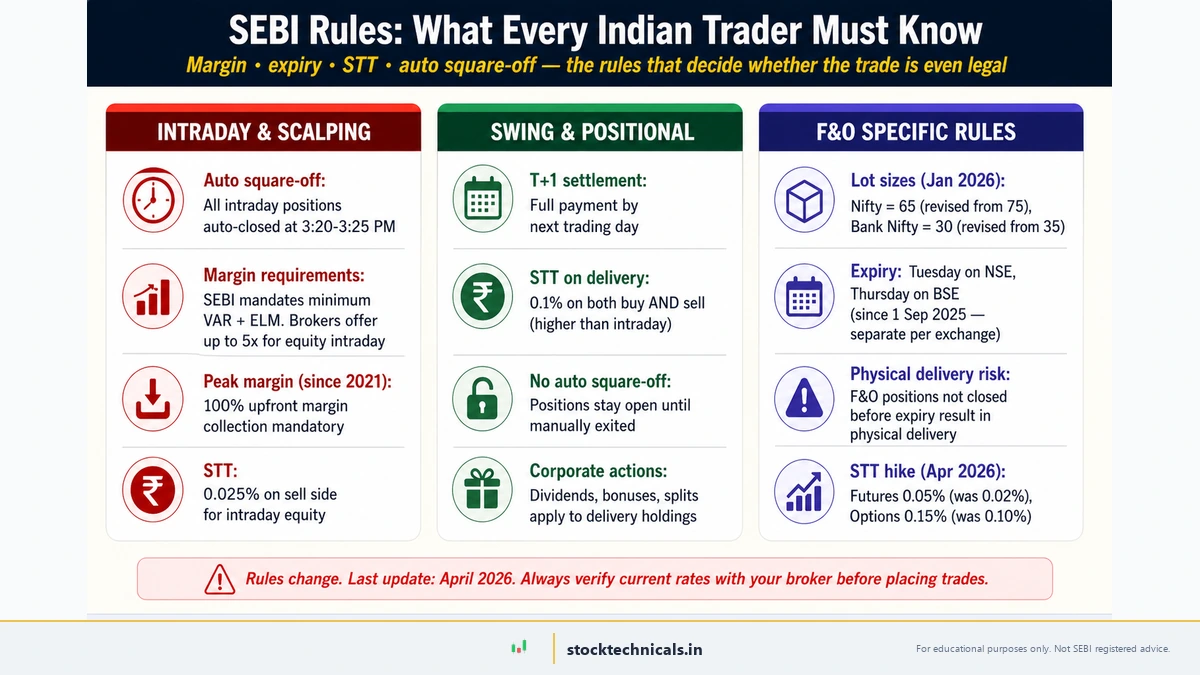
Swing and Positional Rules
- Delivery trades: Full payment required by T+1 (next trading day)
- STT on delivery: 0.1 percent on both buy and sell (higher than intraday)
- No auto square-off: Positions remain open until the trader exits manually
- Corporate action benefits: Dividends, bonuses, and splits apply to delivery holdings
F&O Specific Rules
- Lot sizes: Nifty = 65 units, Bank Nifty = 30 units (revised from 75 and 35 in January 2026)
- Expiry cycle: Weekly on Tuesday (NSE) and Thursday (BSE) since September 1, 2025 — this changed from the previous Thursday-only system after SEBI mandated separate expiry days per exchange
- Physical delivery risk: If F&O positions are not closed before expiry, stock options result in physical delivery requiring full capital
- F&O STT hike (April 2026): Futures STT increased from 0.02 percent to 0.05 percent, options STT from 0.10 percent to 0.15 percent — another signal from regulators to curb retail speculation
Taxation
- Intraday profits: Taxed as speculative business income — can only be offset against speculative losses. Taxed at the individual’s income tax slab rate.
- F&O profits: Taxed as non-speculative business income — can be offset against other business income
- Delivery profits (swing/positional) held less than 12 months: Short-term capital gains (STCG) taxed at 20 percent (revised from 15 percent in Budget July 2024)
- Delivery profits held more than 12 months: Long-term capital gains (LTCG) above ₹1.25 lakh taxed at 12.5 percent (revised from 10 percent above ₹1 lakh in Budget July 2024)
Tax treatment alone makes swing and positional trading more tax-efficient for most retail traders. A positional trader with ₹2 lakh annual profit pays ₹9,375 in LTCG (12.5 percent of ₹75,000 above the ₹1.25 lakh exemption). An intraday trader with the same profit might pay ₹40,000 to ₹60,000 depending on their tax slab.
Interactive Tool: Trading Style Selector
Answer five questions about your time, capital, temperament, experience, and goals. The tool recommends the trading style that best fits your profile and shows a score breakdown across all four styles.
Trading Style Selector
Four Trading Styles at a Glance
Every trader falls into one of these four buckets. Your ideal style depends on available time, capital, risk tolerance, and temperament — not what looks exciting on social media.
Find Your Trading Style
Answer each question honestly. The tool scores your fit across all four styles and recommends the best match for your situation.
Test Your Knowledge
Five questions on the four trading styles. Pick the best answer for each.
Common Mistakes When Choosing a Style
Switching styles after every loss: A trader starts with swing trading, takes a loss, switches to intraday the next day, takes another loss, tries scalping, blows up. Each style requires different skills, different chart settings, and different mental models. Master one before considering another.
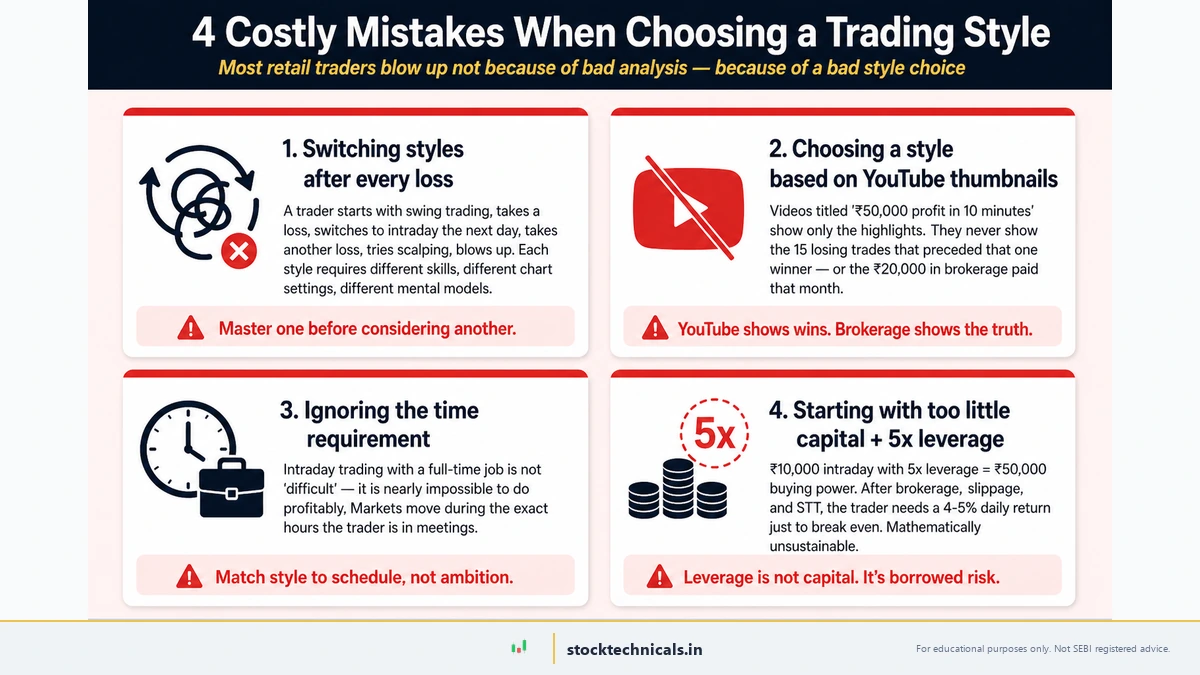
Choosing based on YouTube thumbnails: Videos titled “₹50,000 profit in 10 minutes” show scalping highlights. They never show the 15 losing trades that preceded that one winner, or the ₹20,000 in brokerage paid that month.
Ignoring the time requirement: Intraday trading with a full-time job is not “difficult” — it is nearly impossible to do profitably. Markets move during working hours.
Starting with too little capital: Trading ₹10,000 intraday with 5x leverage gives ₹50,000 buying power. After brokerage, slippage, and STT, the trader needs a 4 to 5 percent daily return just to break even. This is mathematically unsustainable.
Confusing leverage with skill: Brokers offer 5x to 20x leverage for intraday and F&O trades. A trader with ₹50,000 can control ₹2.5 to 10 lakh worth of positions. This feels like a superpower — until a 2 percent move against the position wipes out 10 to 40 percent of the account in a single trade.
Not accounting for total costs: A typical intraday trader on Zerodha pays ₹20 per executed order, plus STT, GST, SEBI charges, and stamp duty. For 10 round trips per day on ₹2 lakh turnover, total daily costs run ₹500 to ₹700. Over 22 trading days, that is ₹11,000 to ₹15,000 per month — the trader needs to earn at least that much just to break even.
The Beginner’s Transition Path
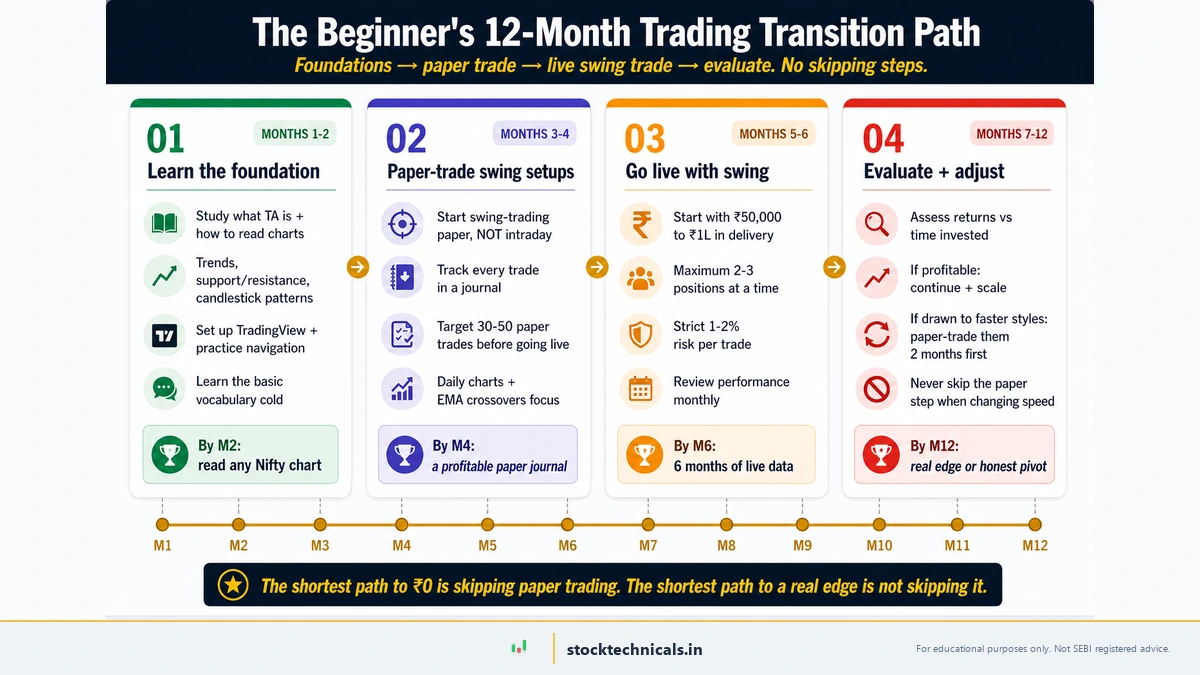
Month 1-2: Learn the Foundation — Study what technical analysis is, learn to read charts, understand trends and support-resistance. Set up TradingView and practice chart navigation. Learn basic candlestick patterns.
Month 3-4: Paper Trade Swing Setups — Start with swing trading, not intraday. Track every trade in a journal. Target 30 to 50 paper trades before going live. Focus on daily charts and EMA crossovers.
Month 5-6: Go Live with Swing Trading — Start with ₹50,000 to ₹1 lakh in delivery. Maximum 2 to 3 positions at a time. Strict 1 to 2 percent risk per trade. Review performance monthly.
Month 7-12: Evaluate and Adjust — After 6 months of live data, assess returns versus time invested. If profitable in swing, continue and scale. If drawn to shorter timeframes, paper trade intraday for 2 months first. Never skip the paper trading step when moving to a faster style.
Continue Learning
Now that the trading style is clear, the next step is building the skills that style demands:
- For all styles: What is Technical Analysis? — the foundation every trader needs
- For scalpers and intraday traders: VWAP Explained — the single most important intraday indicator
- For swing traders: EMA Basics and What is a Pullback? — the core swing entry framework
- For positional traders: Dow Theory and Moving Average Crossovers — trend confirmation tools
- Chart setup: How to Set Up Your First Chart on TradingView
- Pattern recognition: What Are Candlestick Charts? and Support and Resistance
The next step: set up a TradingView chart and start identifying trends on daily timeframes. That is where the swing trading journey begins.
The Bottom Line
Most beginners jump into intraday trading because it looks exciting. Most of them lose money. The SEBI numbers do not lie — 91 percent is not a rounding error, it is a massacre. Start with swing trading. Master the basics. Build a track record. Then decide whether faster styles are worth the added risk, cost, and screen time. The market does not reward speed — it rewards discipline and capital preservation.
Test Your Knowledge
Q1: A trader has ₹50,000 in capital and a full-time office job. Which trading style is the realistic starting point?
Q2: Which trading style typically holds positions for 2 to 20 trading days?
Q3: After SEBI’s January 2026 revision, what is the new Nifty options lot size?
Q4: A trader takes a swing-trading loss, switches to intraday the next day, takes another loss, then tries scalping. The core mistake is:
Q5: According to the 12-month beginner transition path, what should a new trader do in Months 3 to 4?
| Style | Holding period | Capital needed | Skill demand |
|---|---|---|---|
| Scalping | Seconds to minutes | ₹1L+ | Very high |
| Intraday | Same day | ₹50K+ | High |
| Swing | 2 days to 4 weeks | ₹25K+ | Medium |
| Positional | 1-6 months | ₹50K+ | Medium-low |
| Investing | 1+ year | Any | Fundamental focus |
Which type of trading is most profitable?
No single style is inherently more profitable. Profitability depends on the trader’s skill, capital, and consistency. Statistically, swing and positional traders have higher survival rates because lower transaction costs and less emotional pressure translate to fewer catastrophic mistakes. Scalping has the highest theoretical daily income potential but also the highest failure rate — the SEBI FY24-25 study found 91 percent of short-term traders lose money.
Can a beginner start with intraday trading?
Starting with intraday trading as a complete beginner is strongly discouraged. Intraday requires fast decision-making, understanding of breakouts and pullbacks, and comfort with rapid losses. Begin with swing trading to build skills, then transition to intraday after six or more months of profitable swing trading.
How much capital is needed to start trading?
The minimum depends on the style: scalping (₹2-5 lakh), intraday (₹50,000 with margin), swing (₹1 lakh delivery), positional (₹2-5 lakh delivery). Start with the minimum for swing trading and increase capital only after proving consistent profitability over 3 to 6 months.
Is swing trading better than intraday trading?
For most retail traders, especially those with day jobs, swing trading is objectively better. It requires less screen time (30-45 minutes versus 6 hours), lower brokerage (₹5,000-15,000 per year versus ₹50,000-2 lakh per year), and offers better tax treatment for delivery trades. The stress level is also significantly lower.
What is the difference between positional trading and investing?
The difference is in the decision-making framework. Investors primarily use fundamental analysis — earnings, revenue, management quality. Positional traders use technical analysis — chart patterns, moving averages, Dow Theory — to time entries and exits. A positional trader might exit TCS if the 50-day EMA breaks, even if fundamentals look strong.
What does the latest SEBI study say about trader losses?
The SEBI comparative study released July 2025 covering FY24-25 found that 91 percent of individual equity F&O traders incurred losses, with aggregate net losses of ₹1.06 lakh crore. The average per-person loss was ₹1.1 lakh. The study covered nearly 9.6 million individual investors.
Which trading style is best for a working professional?
Swing trading is the clear winner for working professionals. It requires only 30 to 45 minutes of chart review per day (after market hours), needs ₹1 to 10 lakh in delivery capital (no margin stress), and targets 3 to 8 percent moves per trade. Many successful swing traders review charts between 7 PM and 8 PM, set orders for the next day, and check once at lunch.
What day is NSE weekly expiry now?
Since September 1, 2025, NSE weekly expiry is on Tuesday (not Thursday). BSE weekly expiry is on Thursday. SEBI mandated that each exchange must have a separate expiry day to reduce volatility from overlapping expiry events. All monthly expiries follow the same day as the weekly expiry for each exchange.
Most beginners jump into intraday trading because it looks exciting. Most of them lose money. The SEBI FY24-25 numbers do not lie — 91 percent is not a rounding error. Pick a style that fits your time, your capital, and your temperament — not one that fits your Instagram feed.