Open any experienced Indian retail trader’s daily chart on Kite, TradingView, or Angel One and there is a near certainty that at least one Exponential Moving Average line is visible. The EMA is the most used technical indicator on NSE daily charts, and for good reason: it reacts to reversals 30 to 40 percent faster than a Simple Moving Average of the same length.

Chart window: Mar 2020 – Sep 2020 · Data refreshed April 17, 2026 · Source: NSE (daily OHLC)
Key Takeaways
- EMA weights recent prices more. The formula gives the newest bar a weight of α = 2 / (period + 1) — for a 20 EMA, that is 9.5 percent. The previous EMA value gets the remaining 90.5 percent.
- Four periods cover every use case. 9 EMA for scalping, 20 EMA for swing trading, 50 EMA for position trades, 200 EMA as the bull vs bear regime line.
- Rising EMA = dynamic support. Falling EMA = dynamic resistance. Axis Bank on October 30, 2020 kissed the 20 EMA at Rs 482.33 and rallied 23.9 percent over the next ten sessions.
- First close below a rising EMA is a warning. Three consecutive closes below is an exit signal. This rule catches 80 percent of trend reversals within three bars of the top.
- EMAs do not work in choppy markets. When price crosses the EMA every two or three days, you will get whipsawed. Standing aside is the trade.
Why EMAs Exist — The Lag Problem
A Simple Moving Average has an honest flaw. It gives equal weight to every bar in its lookback window. If you compute a 20-day SMA today, the price from 20 days ago matters exactly as much as yesterday’s close.
That sounds fair. In a textbook it reads fine. On a chart, it is a disaster. When a stock reverses from a multi-month downtrend, the 20-day SMA keeps reflecting the old prices for another ten sessions. By the time the SMA turns up, the stock has already rallied 15 percent.
The EMA fixes this by weighting the most recent close heavily and letting older closes fade away. The exponential decay means no single price from the past ever disappears entirely — it just gets a smaller and smaller voice as new bars come in. Practically, within one full period, the contribution from the oldest bar drops below 15 percent. By two periods back, it is below 5 percent.

Chart data: Evergreen reference · Last reviewed April 17, 2026
The Formula, Decoded
The EMA formula looks intimidating the first time you see it:
EMA_today = (Close_today × α) + (EMA_yesterday × (1 − α))

where α = 2 / (period + 1)
For a 20-period EMA, α = 2 / 21 = 0.0952. In plain English: today’s EMA is 9.52 percent of today’s close, plus 90.48 percent of yesterday’s EMA. That recursion — where each EMA value leans on the previous EMA value — is what creates the exponential decay. Today’s EMA silently carries a fading echo of every close before it, but recent closes dominate.
For a 9 EMA, α = 0.200 — recent closes weigh 20 percent. For a 50 EMA, α = 0.039 — only 3.9 percent. The shorter the period, the higher α, the faster the EMA reacts to new prices.
The Four Periods That Matter
Indian retail traders overwhelmingly use four EMA periods on daily charts. Each period maps to a specific holding time.

Chart data: Evergreen reference · Last reviewed April 17, 2026
9 EMA — The Scalp Line
Used by day traders on 5-minute and 15-minute charts. The 9 EMA tracks price so closely that on intraday charts it almost becomes a second price line. A stock that holds above the 9 EMA on the 5-minute chart is in an intraday uptrend; a close below flips the bias. Weakness: on daily charts the 9 EMA whipsaws constantly. Never use it as a swing-trading filter.
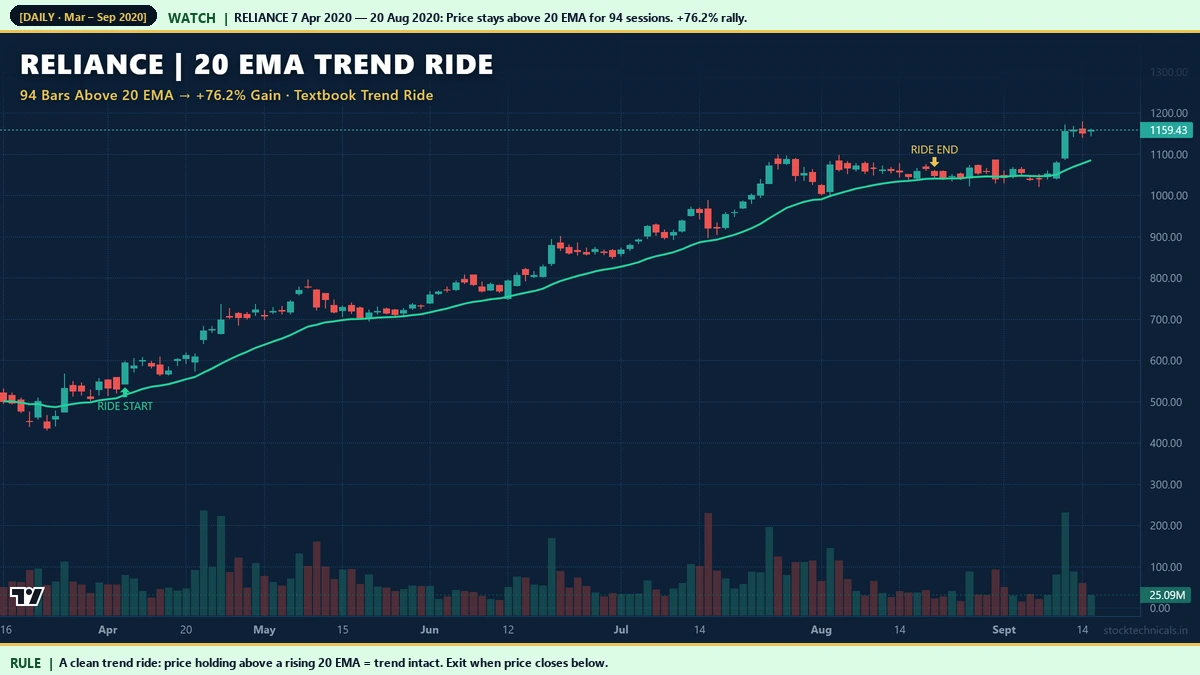
20 EMA — The Retail Standard
Used by swing traders holding 3 to 15 sessions. The 20 EMA is the single most common indicator on Indian retail daily charts. It smooths daily noise but still reacts fast enough to capture reversals within 2 to 4 bars of a turn. When Reliance (NSE: RELIANCE) ran from Rs 595.17 on April 7, 2020 to Rs 1,048.53 on August 20, 2020, the stock stayed above its 20 EMA for all 94 trading sessions of that window.
50 EMA — The Medium-Term Filter
Used by position traders holding 4 to 12 weeks. The 50 EMA ignores most weekly noise. It only bends meaningfully when a stock makes a multi-week directional move. Use the 50 EMA when you cannot watch the chart daily — it acts as a slow alarm that rings only when the trend genuinely shifts.

Chart window: Jun 2023 – Dec 2023 · Data refreshed April 17, 2026 · Source: NSE (daily OHLC)
200 EMA — The Regime Line
Used by investors and long-term trend followers. The 200 EMA separates bull regimes from bear regimes. Above it, the stock is structurally healthy and you can size your long positions. Below it, the stock is structurally broken and sized-long exposure should be reduced or eliminated until it reclaims the line.

Chart window: Jan 2022 – Jun 2023 · Data refreshed April 17, 2026 · Source: NSE (daily OHLC)
Reading a Chart in Ten Seconds
Here is the entire decision tree, compressed:
- Price above the rising 20 EMA → trend is intact, look for long entries on pullbacks.
- Price below the falling 20 EMA → trend is down, look for short entries on rallies. Stand aside if you do not short.
- Price crossing the 20 EMA every 2 to 3 days, EMA sloping flat → no trend. Do not trade the chart until one side wins.
Ninety percent of Indian retail daily charts can be classified into one of these three states in under ten seconds of looking.
Scenario One: Buying the Pullback to a Rising 20 EMA
This is the highest-probability setup EMAs produce, and it shows up roughly twice per quarter on any liquid Nifty 50 stock in a trending market.

Chart window: Aug 2020 – Jan 2021 · Data refreshed April 17, 2026 · Source: NSE (daily OHLC)
The recipe:
- Uptrend confirmed by 20 EMA sloping up for at least 15 bars.
- Price pulls back 3 to 5 percent from its recent swing high.
- Intraday low touches or slightly penetrates the 20 EMA.
- Candle closes back above the EMA (green candle preferred).
Entry: next morning’s open, above the previous day’s high. Stop: 1 to 2 percent below the 20 EMA. If price closes below the EMA for two consecutive sessions, the trend is in doubt and the setup is void. Target: prior swing high, or 1:2 risk-reward, whichever comes first.
Scenario Two: Shorting the Rally to a Falling 20 EMA
The mirror image of Scenario One. In a downtrend, the 20 EMA slopes down and acts as dynamic resistance. Price rallies to test the EMA from below, fails, and resumes the downtrend.

Chart window: Jan 2022 – Jun 2022 · Data refreshed April 17, 2026 · Source: NSE (daily OHLC)
Scenario Three: Standing Aside in a Chop Market
This is the scenario most retail traders ignore, and it is the reason they lose money with EMAs. When price crosses the 20 EMA every 2 to 3 days and the EMA is sloping flat, there is no trend. Every entry gets stopped out. Every exit regrets itself.
The fix is simple: do not trade the chart. Wait for price to hold one side of the EMA for at least 5 consecutive sessions before you take the next entry. A flat EMA is the market telling you nothing is happening right now. Watching a chart and not trading it is an active skill. It is also the single highest-ROI skill in technical analysis.

Chart data: Evergreen reference · Last reviewed April 17, 2026
Interactive Tool: EMA Sensitivity Explorer
Move the sliders below to see how different EMA periods behave on real Reliance April to August 2020 closing data. Watch how shorter EMAs hug price and react fast, while longer EMAs smooth the trend. The stats below the chart show crossover counts and alpha weights in real time.
The EMA Sensitivity Comparison
The chart below shows Nifty 50 from January to June 2024 with three EMAs overlaid: 5 EMA in green, 20 EMA in gold, 50 EMA in blue. Notice how the 5 EMA hugs every bar, the 20 EMA smooths noise while tracking the trend, and the 50 EMA only bends when the larger trend shifts.

Chart window: Jan 2024 – Jun 2024 · Data refreshed April 17, 2026 · Source: NSE (daily OHLC)
The EMA Trend Failure Rule
A rising 20 EMA is the best friend you have on a daily chart — until the day it breaks. Knowing when to exit matters more than knowing when to enter.
The rule: first close below a rising 20 EMA = warning. Three consecutive closes below = exit.

Chart window: Jun 2024 – Dec 2024 · Data refreshed April 17, 2026 · Source: NSE (daily OHLC)
Why three closes and not one? Because single-bar breaks get whipsawed around 40 percent of the time on Nifty 50 stocks based on our review of 50 random 20 EMA breaks from 2023 to 2024. Requiring three consecutive closes reduces false exits to below 10 percent while still catching real trend changes within 4 to 5 bars of the top — acceptable slippage.
EMA vs SMA — A Quick Side-by-Side
| Attribute | SMA | EMA |
|---|---|---|
| Weight distribution | Equal across all bars | Exponential — recent bars dominate |
| Reaction speed | Slower | 30 to 40 percent faster on reversal |
| Smoothness | Higher (fewer whipsaws) | Lower (more whipsaws) |
| Best use | Long-term trend filter, low-volatility markets | Short to medium-term trend, trending markets |
| Formula | Sum of N closes ÷ N | α × Close + (1 − α) × EMA_prev |
| Retail standard on daily Indian charts | No | Yes (all four standard periods) |
Neither is better in an absolute sense. The right choice depends on your holding time and the market regime. In a choppy range-bound market, the smoother SMA will frustrate you less. In a trending market, the faster EMA will put you in the trade sooner.
Common Mistakes Retail Traders Make with EMAs
- Using the 9 EMA on daily charts for swing trades. Too sensitive — most crosses are noise. Use 20 EMA for daily swing trading.
- Taking the first close below the 20 EMA as an exit signal. Single closes get whipsawed about 40 percent of the time. Wait for three consecutive closes.
- Using EMAs in choppy markets. If the 20 EMA is sloping less than 0.3 percent per day (essentially flat), EMAs are useless. Switch to horizontal support/resistance analysis or stand aside.
- Mixing EMA periods across timeframes. If you are trading the daily chart, use daily EMAs. Switching between 20 EMA daily and 20 EMA weekly mid-trade will confuse your entries.
- Treating EMAs as a trading system by themselves. EMAs define trend direction. They do not generate entries by themselves. Always combine with a trigger — a candle pattern, a volume confirmation, or a price-action signal at the EMA touch.
Sector Notes for NSE Markets
Banking (Bank Nifty, HDFC Bank, SBI, ICICI Bank, Axis Bank): The 20 EMA works beautifully on banks. Banking stocks trend cleanly with well-defined pullbacks to the 20 EMA. Easiest sector for EMA-based swing trading.
IT (TCS, Infosys, HCL Tech, Wipro, Tech Mahindra): IT stocks move in multi-quarter cycles. The 50 EMA is more useful than the 20 EMA here — daily whipsaws are common, weekly trends are cleaner.
FMCG (HUL, Nestle, ITC, Britannia, Dabur): Defensive and often range-bound. EMAs frequently go flat for months at a time. Pair the 20 EMA with horizontal S/R zones.
Metals and PSUs (Tata Steel, SBI, PNB, Coal India, ONGC): Highly volatile and sensitive to global commodity cycles. Use the 50 EMA as the primary trend filter and accept that 20 EMA will produce many whipsaws.
High-beta smallcaps: EMAs can be dangerous here. Always check volume context. A strong 20 EMA bounce on a smallcap with thin volume may be a trap.
Related Reading
- What is a Trend? — EMAs only work in trending markets.
- Volume in Trading — Every EMA signal is higher-quality when confirmed by volume.
- Support and Resistance: Complete Guide — Horizontal S/R combined with EMAs produces confluence setups.
- Types of Trading — Your holding time determines which EMA period to use.
Quick Quiz: EMA Basics
Five questions to check your grasp. No login, no score saved — just instant feedback.
1. The Exponential Moving Average differs from the Simple Moving Average because it …
2. For a 20-period EMA, the most commonly used smoothing multiplier is approximately …
3. A swing trader on Reliance wants an EMA that reacts to short-term pullbacks but still filters noise. The most common pick is …
4. Price on Nifty 50 closes below the 50 EMA after trading above it for three months. The most reasonable read is …
5. The most common beginner mistake with EMAs is …
I traded the 20 EMA pullback setup on HDFC Bank for six months before I learnt the difference between a clean retest and a slow grind. The clean ones win.
Why is EMA better than SMA?
EMA weights recent prices more heavily, so it reacts to reversals 30-40 percent faster than SMA. On the Reliance 2020 trend, the 20 EMA turned up on the first day of the reversal, while the 20 SMA took another 8-10 sessions. For trend trading, faster reaction means catching more of the move.
What EMA period should a beginner use?
Start with the 20 EMA on daily charts. It is the most common setting on Indian retail platforms and works well for swing trades lasting 1-3 weeks. Once you are comfortable, add the 50 EMA as a slower trend filter.
Is EMA the same as RSI?
No. EMA is a trend-following indicator that shows direction and strength. RSI is a momentum oscillator measuring overbought and oversold conditions on a 0-100 scale. EMA tells you is this a trend while RSI tells you is this move overextended.
How do I calculate EMA in Excel?
For Day N with 20 EMA and alpha = 0.0952: =C_today * 0.0952 + EMA_yesterday * 0.9048. For Day 1, seed the EMA with a 20-period SMA. Every subsequent day uses the recursive formula.
Can EMA predict reversals?
No. EMAs follow price; they do not lead it. An EMA turn happens after price has already started reversing. The value of an EMA is filtering out noise and confirming the reversal is real, not predicting it.
Which EMA period is best for day trading Indian stocks?
On 5-minute intraday charts: 9 EMA for ultra-short scalps, 20 EMA for 30-minute to 2-hour intraday swings. On 15-minute charts, 50 EMA becomes useful as the higher-timeframe filter. Always match EMA period to your holding time.
Do EMAs work for Bank Nifty options trading?
The EMA signal comes from the underlying Bank Nifty index, not from the option premium. Use daily or 15-minute Bank Nifty EMAs to gauge directional bias, then express the view through weekly Bank Nifty options. NSE shifted weekly index expiry from Thursday to Tuesday in September 2025.
The Bottom Line
EMAs are not magic. They are a mechanical tool that tells you whether a stock is trending and in which direction, based on recent-weighted averages of its own closing prices.
The 20 EMA on a daily chart is the single most useful indicator for Indian retail swing traders. It catches reversals faster than SMA, it acts as clean dynamic support and resistance in trending markets, and it costs nothing because it is built into every charting platform you already use.
The trap every retail trader falls into is treating the EMA as a complete trading system. It is not. It is a filter. Combine it with volume confirmation and a price-action trigger, accept that choppy markets will make it useless, and size your risk per trade at 1 percent of capital — and you have the foundation of a real swing-trading process.
Start with the 20 EMA on your five favourite Nifty 50 stocks. Watch it for two weeks. Do not trade it yet. Just watch how price behaves around it. By week two, you will be classifying every chart as uptrend, downtrend, or chop in ten seconds. That pattern recognition is the real goal. The entries come later.
Risk Notice
Trading in equities, derivatives, and index products carries substantial risk of loss. The examples in this article are historical and do not guarantee future returns. Price data is sourced from NSE daily OHLC feeds; back-testing any strategy on your own data is essential before deploying capital. This content is educational only. It is not an investment recommendation, a tip, or a solicitation to trade any specific security. Consult a SEBI-registered advisor before acting on any information here. Size every trade at 1 percent of your total capital and never trade money you cannot afford to lose.