OBV: On-Balance Volume Explained for Traders

OBV: On-Balance Volume Explained for Traders — featured chart

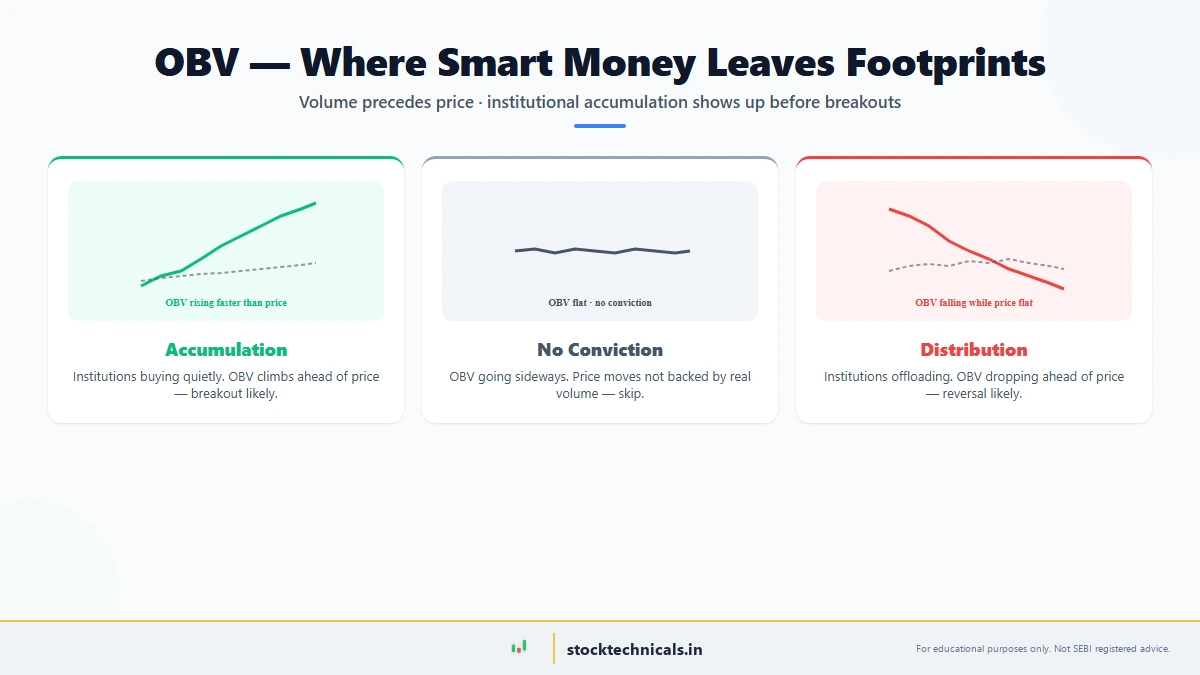
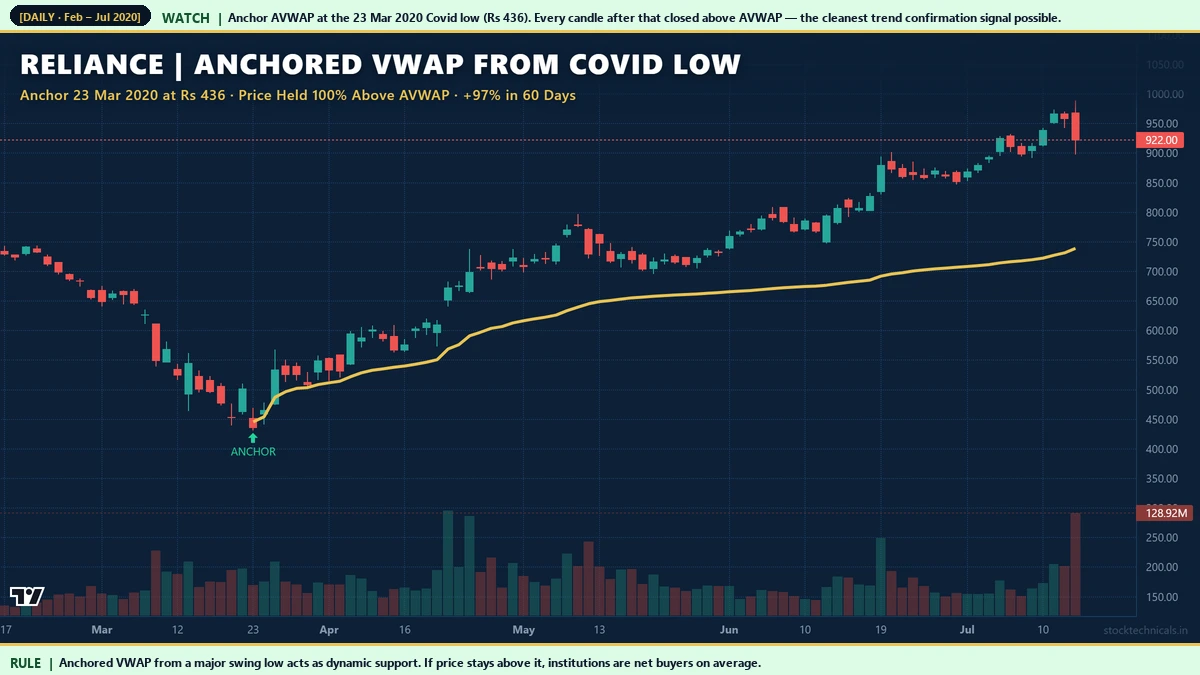
Quick Answer: On-Balance Volume (OBV) is a cumulative volume indicator that reveals institutional accumulation and distribution. Volume on up days adds; volume on down days subtracts. The absolute number is meaningless — track the trend instead. OBV divergence (price up while OBV down) predicts reversals before they happen. Published February 27, 2026 · Last refreshed … Read more

ATR: Average True Range Explained

ATR: Average True Range Explained — featured chart

Quick Answer: ATR (Average True Range) measures how much a stock typically moves per period, combining intraday gaps and regular high-low ranges. Use it to place volatility-adjusted stops (1.5-2× ATR) and size positions consistently (Risk ÷ ATR). It never tells direction — only magnitude. Published February 26, 2026 · Last refreshed April 27, 2026. Prices … Read more

Stochastic Oscillator

Stochastic Oscillator — featured chart

Quick Answer: The Stochastic Oscillator measures where a stock’s closing price sits within its 14-day high-low range (0-100 scale). It generates %K and %D lines that spot momentum shifts — especially powerful for timing entries in ranging markets. Above 80 = overbought · below 20 = oversold. Published February 25, 2026 · Last refreshed April … Read more

ADX: Measuring Trend Strength with the Average Directional Index

ADX: Measuring Trend Strength with the Average Directional Index — featured chart

Quick Answer: ADX answers the question every trader asks: “Is this trend real, or will it reverse?” It measures trend strength (not direction) on a 0-100 scale. ADX above 25 = strong tradeable trend · below 20 = choppy ranging market where trend-following loses money. Published February 24, 2026 · Last refreshed April 27, 2026. … Read more

Supertrend Indicator: ATR-Based Trend Following and Trailing Stop

Adani Enterprises July 2018 Supertrend bullish flip red to green 62 percent rally

Supertrend is a trend-following indicator that combines Average True Range (ATR) with a dynamic trailing line. It plots as a single line on the chart: green below price in uptrends, red above price in downtrends. When price closes through the line, the trend flips and the line switches colour and position. Supertrend doubles as an … Read more

Bollinger Bands: Volatility Indicator with Squeeze, Walking, and Mean Reversion

Vedanta November 2020 Bollinger Band squeeze breakout up 52 percent rally metals recovery

Bollinger Bands are a volatility indicator developed by John Bollinger in the 1980s. Three bands are plotted on the price chart: a middle band (20-period simple moving average), an upper band (middle + 2 standard deviations), and a lower band (middle – 2 standard deviations). The bands expand when volatility rises and contract when volatility … Read more

MACD Basics: The Moving Average Convergence Divergence Explained

Reliance 26 March 2020 MACD bullish crossover below zero Covid recovery 48 percent rally

The Moving Average Convergence Divergence (MACD) is a momentum-trend indicator developed by Gerald Appel in 1979. It measures the relationship between two exponential moving averages of price, plotted as a line along with a signal line and histogram. MACD works in two modes: short-term crossovers between the MACD and signal lines, and longer-term regime changes … Read more

RSI Basics: The Relative Strength Index Explained with NSE Examples

Reliance 23 March 2020 Covid low RSI 25.77 oversold bounce 78 percent rally in 30 sessions

The Relative Strength Index (RSI) is a momentum oscillator that measures how fast and how far prices have moved recently. Developed by J. Welles Wilder in 1978, it ranges from 0 to 100 and is one of the most widely used indicators in technical analysis. Readings above 70 suggest overbought conditions; readings below 30 suggest … Read more