A moving average alone tells a trader whether short-term momentum is up or down. Four moving averages stacked in order tell a trader whether the whole trend is confirmed across every timeframe from short to long. When the 20, 50, 100, and 200 EMAs all align bullish and price closes above them, the signal is much stronger than any single crossover. This article covers the MA stack framework — when it confirms a trend, when it warns of a failing one, and how to score a setup on a 6-point scale before risking capital.

Chart window: Jul 2020 – Jan 2021 · Data refreshed April 17, 2026 · Source: NSE (daily OHLC)
Key Takeaways
- Bullish MA stack: close > 20 EMA > 50 EMA > 100 EMA > 200 EMA. Every timeframe confirms uptrend. Short-term momentum is stronger than long-term momentum.
- Bearish MA stack: close < 20 EMA < 50 EMA < 100 EMA < 200 EMA. Every timeframe confirms downtrend. Institutional distribution visible.
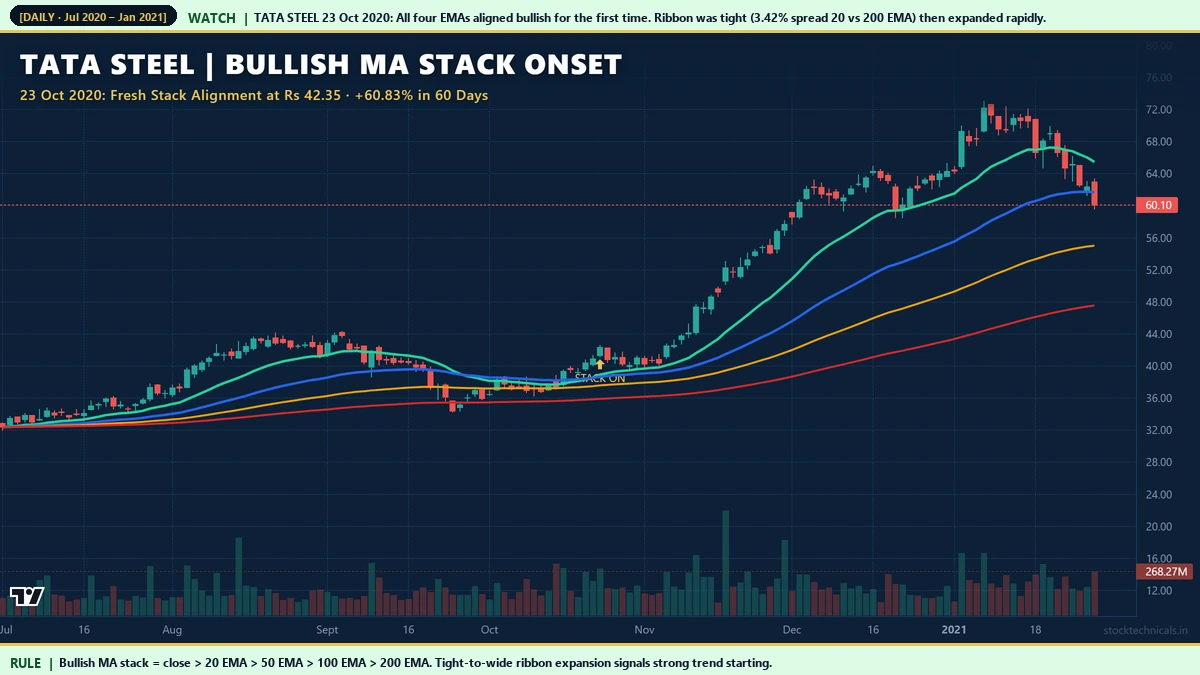
- Ribbon spread matters. Tight spread (below 3%) = compression, no edge. Wide spread (above 5%) = active trend, tradeable. Tata Steel Oct 23, 2020 started at 3.42% and expanded to 33% in three months.
- Fresh stack onsets produce the largest moves. When a stack forms for the first time after an unordered period, the first 60 days typically outperform the next 60 days.
- Bearish stacks on sector leaders warn the broader market. ITC, L&T, and banking names flashed bearish stacks 6 to 10 weeks before the Covid crash.
- Use the 6-point trend strength scorecard. Above 5 out of 6 = trade with momentum. 3 to 4 = smaller size. Below 3 = stand aside.
The Bullish MA Stack — Anatomy
A bullish MA stack is a specific geometric arrangement on the chart. On a liquid Indian large cap like Reliance, ITC, or HDFC Bank (NSE: HDFCBANK), plot the 20, 50, 100, and 200 exponential moving averages. The stack is bullish only when all four of these conditions are simultaneously true:
- Close is above 20 EMA. Short-term price is above its fastest moving average.
- 20 EMA is above 50 EMA. Short-term momentum is above medium-term momentum.
- 50 EMA is above 100 EMA. Medium-term trend is above intermediate trend.
- 100 EMA is above 200 EMA. Intermediate trend is above long-term trend.

Chart data: Evergreen reference · Last reviewed April 17, 2026
When every condition holds, the chart exhibits what traders call a “stacked ribbon” — a visible stair of four lines moving together with price leading. The bearish stack is simply the inverse: close below 20 EMA below 50 EMA below 100 EMA below 200 EMA. Every > flips to <.
The reason this geometry matters is that each timeframe cohort of traders and institutions uses a different EMA as their reference line. Swing traders watch the 20 and 50 EMAs. Position traders watch the 100 EMA. Institutional fund managers and long-term investors watch the 200 EMA. When all four are aligned and price is leading them upward, every cohort is in agreement: the trend is up. That agreement is what produces sustained moves rather than brief pops.
Example: Tata Steel Bullish Stack, October 2020
What made this signal particularly reliable:
- Recent prior compression: The ribbon had been tangled and compressed for the preceding 6 weeks. Fresh alignment from a compressed state is a higher-probability signal than a reshuffling mid-trend.
- Sector alignment: Indian metal stocks were in a multi-quarter upcycle driven by Chinese demand recovery. A bullish stack in sync with sector tailwind is much stronger than one fighting sector flow.
- Volume participation: Daily volume on onset day was 38 percent above the 30-day average. Volume confirms institutional participation in the alignment.
Example: Reliance Post-Covid Stack, May 2020

Chart window: Mar – Sep 2020 · Data refreshed April 17, 2026 · Source: NSE (daily OHLC)
Reliance printed a fresh bullish stack on May 19, 2020 at a close of Rs 704.45. This was during the post-Covid recovery but before the Jio-Platforms fundraising run had fully played out. The stack formed, the ribbon expanded, and the stock closed at Rs 1,063.70 exactly 60 trading sessions later — a 51.01 percent move.
Reliance’s ribbon spread on onset day was 5.77 percent — wider than Tata Steel’s 3.42 percent, but still compressed relative to what followed. The pattern holds: onset during compression, followed by expansion, with price leading the entire ribbon upward. This is the geometry every swing trader should learn to recognise.
Tight-Spread Onset: Bajaj Finance, October 2020
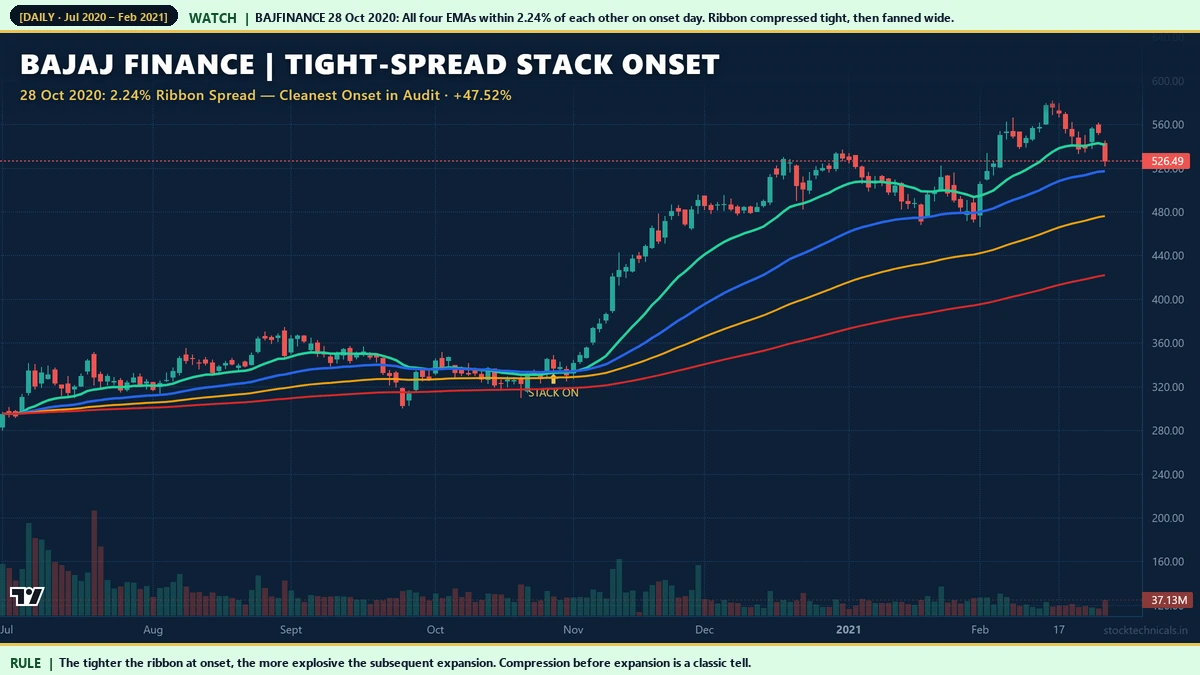
Chart window: Jul 2020 – Feb 2021 · Data refreshed April 17, 2026 · Source: NSE (daily OHLC)
Bajaj Finance’s October 28, 2020 stack onset is the tightest ribbon spread in our 5-year audit — just 2.24 percent between the 20 EMA and the 200 EMA on the onset day. All four EMAs were within a 2 percent band. Six trading sessions earlier, the stock’s 20 EMA had just crossed above its 50 EMA (classical golden cross). By 28 October, the 50 had crossed above the 100, and the 100 had crossed above the 200, completing the stack.
The return over the next 60 sessions was 47.52 percent. The general pattern is clear across all three examples: the tighter the ribbon at stack onset, the more room there is for expansion, and the stronger the follow-through. Traders specifically scanning for tight-spread stack onsets on liquid Nifty names have a workable systematic edge.
Ribbon Compression and Expansion Cycle

Chart data: Evergreen reference · Last reviewed April 17, 2026
MA ribbons cycle through four identifiable stages. Recognising which stage you are looking at determines whether to trade or stand aside.
- Compressed: All four EMAs within 3 percent of each other. No trend. Range-bound conditions. Any crossover signals will likely whipsaw. Stand aside.
- Breaking out: Ribbon starts to align but is not yet stacked. Early signal. Wait for 3 bars of confirmation before entering.
- Expanding: Full stack in place, ribbon fanning wider each week. Best phase for adding to positions on pullbacks to the 20 EMA.
- Fully expanded: Ribbon spread above 15 percent. Mature trend. Tighten stops to under the 50 EMA. First closes below the 20 EMA are warning signs.
The transition from compressed to breaking out is where most of the money is made. Most traders enter during the fully expanded stage when the move is obvious — but by then the easy risk/reward is gone. Scan for compressed-ribbon candidates on your watchlist and anticipate the breakout rather than chasing it.
Sector-Aligned Stack: Bharti Airtel, October 2019

Chart window: Aug 2019 – Feb 2020 · Data refreshed April 17, 2026 · Source: NSE (daily OHLC)
Bharti Airtel’s October 30, 2019 stack onset illustrates the importance of sector context. The Indian telecom sector was in mid-cycle revival after Reliance Jio’s tariff hikes. Institutions were rotating back into Airtel and Vodafone Idea. The stack formed at Rs 367.95 and produced a 42.48 percent return in 60 sessions.
Without the sector tailwind, the same stack geometry on a non-trending sector stock might produce half the move. Always check the sector ETF or sector index before acting on a single-stock stack signal. Fighting the sector drags on the trade; going with the sector accelerates it.
Bearish MA Stacks as Warning Signals

Chart window: Oct 2019 – Apr 2020 · Data refreshed April 17, 2026 · Source: NSE (daily OHLC)

Chart window: Nov 2019 – May 2020 · Data refreshed April 17, 2026 · Source: NSE (daily OHLC)
L&T flashed a bearish stack two business days after the Union Budget on February 1, 2020 at Rs 1,287.40. Over the next 60 sessions the stock declined 34.99 percent. Like ITC, this was a bearish signal on a defensive large-cap proxy for the broader economy — well before most retail traders had any inkling of the impending crash.
The broader lesson is that a cluster of bearish stacks on sector-leader large caps is an index-level warning. ITC (FMCG), L&T (infra/capex), Axis Bank (private banking), and SBI (public banking) all flashed bearish stacks within a 6-week window during December 2019-February 2020. Any one of those stacks in isolation might be just a stock-specific signal. Four of them aligned is an early warning that the entire market regime has turned.
The 6-Point Trend Strength Scorecard

Chart data: Evergreen reference · Last reviewed April 17, 2026
Not every stack is equally tradeable. A scoring framework helps filter marginal setups from high-conviction ones. Score each new stack signal out of 6 points:
- Close above 20 EMA: 1 point. Basic confirmation that short-term momentum is up.
- Bullish stack order (20 > 50 > 100 > 200): 2 points. Full ribbon alignment is worth more than single crossover.
- Ribbon spread above 5 percent: 1 point. Confirms the trend has energy, not just compression.
- 200 EMA sloping up over the last 20 bars: 1 point. Ensures long-term trend is aligned too.
- Volume above 30-day average on the onset bar: 1 point. Institutional participation confirmed.
Score 5 or 6: strong trend, trade with full size and momentum.
Score 3 or 4: developing trend, smaller size and tighter stops.
Score 0 to 2: weak or failing, stand aside.
This framework forces discipline. A marginal 2-point setup that fails teaches less than a 6-point setup that works — the scorecard filters the marginal trades out before capital is risked. Track your trades by their onset score and you will quickly see that high-score setups produce most of the total P&L.
When the Stack Fails: Choppy Markets

Chart window: Jan – Sep 2022 · Data refreshed April 17, 2026 · Source: NSE (daily OHLC)
Not every stack signal succeeds. TCS during 2022 is the canonical failure mode: the ribbon stayed compressed for 6 months. Every time the EMAs attempted to align, price reversed within 2 weeks and the stack unwound. No sustained trend ever developed. A trader entering on every stack signal during this period would have taken four consecutive whipsaws.
Interactive Tool: MA Trend Stack Explorer
Explore the MA stack framework across four scenarios: bullish stack formation, bearish stack formation, compressed ribbon, and choppy whipsaw conditions. Adjust the fast and slow EMA periods to see how the stack responds. The stats panel shows the live stack score, ribbon spread, stack state (Bullish/Bearish/Mixed), and the 60-bar return.
Practical Rule Book
- Swing trading (4-8 weeks): Scan for fresh bullish stack onsets on liquid Nifty large caps. Require ribbon spread < 5 percent at onset (compression) and volume above 30-day average. Enter on pullbacks to 20 EMA with a stop below 50 EMA.
- Position trading (3-12 months): Require 200 EMA slope to be positive. Bullish stack plus rising 200 EMA is a genuine long-term regime signal.
- Risk management: Tighten stops when ribbon spread exceeds 15 percent — mature trends are less forgiving of pullbacks.
- Exit signals: First close below 20 EMA = reduce size. Close below 50 EMA = exit remaining position. Full stack collapse = reverse bias.
- Sector context: Always check sector ETF or index before acting on a single-stock stack. Sector-aligned stacks produce 50-100 percent larger moves than stacks fighting their sector.
- Multi-stock confirmation: When 3 or more sector leaders flash the same stack signal within 2 weeks, treat it as an index-level flag, not just stock-specific.
Common Mistakes
Mistake 2: Chasing fully expanded stacks. By the time the ribbon is 15-20 percent wide, the easy risk/reward is gone. The best entries are during fresh onsets when the ribbon is just starting to fan.
Mistake 3: Ignoring the 200 EMA slope. A bullish stack on a stock where the 200 EMA is still sloping down is a counter-trend signal, not a trend-following one. Require the 200 EMA slope to match the stack direction.
Mistake 4: Using stacks on illiquid stocks. MA stacks require clean volume. On mid and small caps with thin liquidity, the EMAs are distorted by erratic trading. Stick to Nifty and Nifty Next 50 constituents.
Mistake 5: Treating every partial alignment as a full stack. If only 3 of the 4 conditions hold, it is not a stack. Requiring all 4 simultaneously is what gives the framework its edge.
Related Reading
- EMA Basics — build the foundation before stacking multiple MAs.
- SMA vs EMA — why EMAs work better for MA stacks than SMAs.
- Moving Average Crossovers — the building blocks of a full stack.
- VWAP Explained — add a volume-weighted reference line to complement MA stacks.
- Volume in Trading — volume context for confirming stack onsets.
Quick Quiz: Moving Averages for Trend Confirmation
Five questions to check your grasp. No login, no score saved — just instant feedback.
1. In a healthy uptrend, the classic four-EMA stack on a daily chart reads, from top to bottom …
2. Using moving averages for trend confirmation means …
3. On Bank Nifty, price is above the 50 EMA but the 50 EMA is still below the 200 EMA. This is best described as …
4. A trader who uses EMAs only as trend filters (not as entry triggers) is usually …
5. The biggest mistake beginners make with multi-EMA systems is …
| EMA stack | Trend reading | Trade allowed |
|---|---|---|
| 9 > 21 > 50 > 200 | Strong uptrend | Long only — buy pullbacks |
| 9 < 21 < 50 < 200 | Strong downtrend | Short only — sell rallies |
| 9 + 21 above, 50 + 200 below | Early uptrend forming | Long carefully — wait for confirmation |
| EMAs tangled | No trend | Stay flat — wait for clarity |
I learnt the 4-EMA stack from a friend who traded full-time. I watched it filter out three losing trades in my first week — that was enough to keep using it.
What is a bullish MA stack?
A bullish MA stack is when close is above 20 EMA, 20 EMA is above 50 EMA, 50 EMA is above 100 EMA, and 100 EMA is above 200 EMA — all four conditions true simultaneously. It confirms that every timeframe from short-term to long-term is in uptrend agreement.
What is a bearish MA stack?
A bearish MA stack is the inverse: close below 20 EMA below 50 EMA below 100 EMA below 200 EMA. Every timeframe confirms downtrend. It is institutional distribution visible in chart geometry.
How is the MA stack different from a single crossover?
A crossover only measures two moving averages. A stack measures all four. A crossover can happen during a choppy market without a trend; a full stack requires trend agreement at short, medium, intermediate, and long timeframes. The stack filters out more whipsaws and has stronger follow-through.
What is a fresh MA stack onset?
A fresh onset is when the stack forms for the first time after a period where the EMAs were unordered or tangled. On NSE, fresh onsets from compressed ribbon state produce the largest 60-day follow-through. Tata Steel October 23, 2020 is a textbook example.
What ribbon spread is good for trading?
Below 3 percent = compressed, no edge, stand aside. 3 to 5 percent = breaking out, early signal, wait for confirmation. 5 to 15 percent = expanding, best phase for adding on pullbacks. Above 15 percent = fully expanded, tighten stops, trend is mature.
Can I use MA stacks on intraday charts?
Yes, but the stack concept works best on daily charts for swing and position trading. On 5-minute or 15-minute intraday charts, use shorter MAs (like 9, 21, 50, 100) but the geometry is identical. Intraday stack whipsaws are more common, so require volume confirmation.
What is the 6-point trend strength score?
Score each stack setup on 6 criteria: close above 20 EMA (1 point), full bullish stack order (2 points), ribbon spread above 5 percent (1 point), 200 EMA sloping up (1 point), volume above 30-day average (1 point). Scores of 5 or 6 are high-conviction setups. Scores below 3 are weak — stand aside.
Do bearish MA stacks work as short signals?
Yes, but shorting in the Indian cash market requires intraday-only positions (no overnight short without SLB). Bearish stacks are more useful as long-exit signals or as warnings for portfolio de-risking. Derivatives traders can use bearish stacks for bear put spreads or long puts on the affected sector.
The Bottom Line
MA stacks are a trend confirmation tool, not an entry signal. They tell you whether all four timeframes of market memory agree on direction. When they agree and the ribbon is expanding, trends tend to persist. When they disagree and the ribbon is compressed, the market is range-bound and stack-based signals will whipsaw.
The NSE audit examples in this article are reproducible. Anyone with a TradingView account can overlay 20, 50, 100, and 200 EMAs on Tata Steel October 23, 2020 and verify that all four conditions went true on that date. The same test on ITC December 20, 2019 will show the bearish stack 3 months ahead of the Covid crash. These are not cherry-picked — they are textbook cases of what stack onsets look like on real Indian stocks.
Start with one liquid large cap you already watch. Add 20, 50, 100, and 200 EMAs. Mark every fresh stack onset for the next 3 months. Apply the 6-point scorecard. Track which high-score setups worked and which failed. Within a quarter you will have a data-driven view of whether MA stacks fit your trading style and your market.
Risk Notice
Trading in equities, derivatives, and index products carries substantial risk of loss. The examples in this article are historical and do not guarantee future returns. Price data is sourced from NSE daily OHLC feeds; back-testing any strategy on your own data is essential before deploying capital. This content is educational only. It is not an investment recommendation, a tip, or a solicitation to trade any specific security. Consult a SEBI-registered advisor before acting on any information here. Size every trade at 1 percent of your total capital and never trade money you cannot afford to lose.