Volume Weighted Average Price (VWAP) is the running average price of a security weighted by how much volume traded at each price. Unlike a simple moving average, VWAP accounts for the fact that a big trade at Rs 500 means more than a small trade at Rs 495. It tells you what price most of the money actually paid — not what price the average candle closed at.

Chart window: Feb – Jul 2020 · Data refreshed April 17, 2026 · Source: NSE (daily OHLC)
Key Takeaways
- VWAP is the volume weighted average price since an anchor point. Formula: cumulative (Typical Price × Volume) divided by cumulative Volume. Typical Price = (High + Low + Close) / 3.
- Daily VWAP resets each session. Used for intraday execution benchmarks. Institutions try to buy below VWAP and sell above it.
- Anchored VWAP lets swing traders pick any starting point. Swing low, swing high, earnings date, or major news event. Valid for days or months, not just one session.
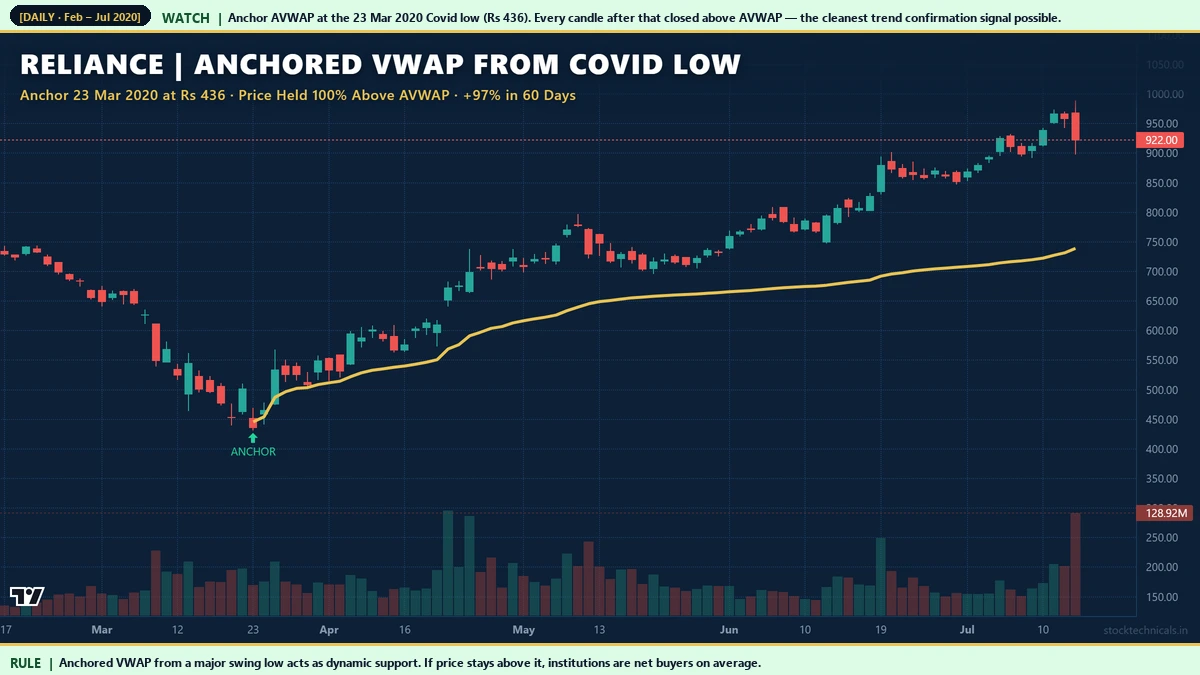
- Price above rising AVWAP confirms institutional buying. Reliance March 23, 2020 Covid low anchor held 100 percent of candles above AVWAP and rallied 97.2 percent in 60 days.
- Price below falling AVWAP confirms institutional distribution. Maruti July 24, 2018 cycle top saw every rally fail at AVWAP and the stock declined 31.2 percent in 60 days.
- AVWAP works as dynamic support or resistance. Tata Steel September 24, 2020 anchor was retested twice in October — both bounces produced new highs.
What Is VWAP?
VWAP stands for Volume Weighted Average Price. It is a running average of price that gives more weight to bars with higher volume. The intuition is simple: if 10,000 shares traded around Rs 500 and only 500 shares traded around Rs 505, the “average” price most traders paid is much closer to Rs 500 than to the arithmetic mean of Rs 502.50. VWAP captures that reality.
The indicator was invented in the 1980s for institutional execution desks. A fund manager placing a large buy order wants to know: am I buying below the average price paid by the market today, or above it? If below, my execution is adding alpha. If above, I am giving up price to get filled. VWAP became the industry standard benchmark for intraday order execution quality.
Over time VWAP moved from institutional dealing rooms to retail charting platforms. TradingView, Zerodha Kite, and most Indian broker platforms now offer VWAP as a built-in overlay. Today it serves three distinct purposes:
- Intraday execution: Institutions grade their fills against session VWAP.
- Short-term bias: Intraday traders use VWAP as the line between bullish and bearish intraday regimes.
- Swing and position trading: Traders use Anchored VWAP from a specific event date to measure institutional accumulation or distribution over days, weeks, or months.
The VWAP Formula Explained

Chart data: Evergreen reference · Last reviewed April 17, 2026
VWAP is computed bar by bar and maintained as a running cumulative total. The formula has three steps:
- Calculate Typical Price for each bar: Typical Price = (High + Low + Close) / 3. This gives one representative price per bar instead of just using the close.
- Multiply Typical Price by Volume for each bar. This is the “volume weight.” A high-volume bar contributes more to the running total than a low-volume bar.
- Take the cumulative ratio: VWAP = sum of (Typical Price × Volume) divided by sum of Volume, from the anchor point up to the current bar.
This cumulative structure means VWAP becomes progressively less sensitive to new bars as the session or anchor window extends. At the start of a session, VWAP moves sharply with each bar. By the last hour of an intraday session, a single bar barely shifts VWAP at all. The same pattern holds for Anchored VWAP across days and weeks — the line smooths out as more data accumulates.
Daily VWAP vs Anchored VWAP
The formula is the same for both. What differs is when the running total resets. Daily VWAP resets every trading day at 9:15 AM IST and is used on intraday timeframes (1-minute, 5-minute, 15-minute bars). Anchored VWAP lets the trader pick any starting point and keeps the running total going until manually reset.

Chart data: Evergreen reference · Last reviewed April 17, 2026
For an intraday scalper on Bank Nifty (NSE: BANKNIFTY) futures, Daily VWAP is the relevant line. For a swing trader deciding whether to hold a Reliance position through earnings, Anchored VWAP from the results-day open is the relevant line. The two tools answer different questions even though the underlying math is identical.
One practical note: most Indian broker platforms label the two differently. On Zerodha Kite and TradingView, “VWAP” usually means Daily VWAP resetting at session open. Anchored VWAP is a separate drawing tool (labeled “Anchored VWAP” on TradingView) that lets the user click a specific bar to start the cumulative calculation. Knowing which one is on your chart matters — a Daily VWAP on a weekly chart is nearly meaningless.
Example: Reliance Anchored at the Covid Low
Three factors made this particular anchor so productive:
- Clear capitulation volume: March 23, 2020 printed one of Reliance’s largest single-day volume bars on record. High volume at a major low anchors the VWAP at genuine “fair price” from the crash.
- No bar closes below AVWAP: Every candle from 24 March through the following 60 sessions closed above the cumulative AVWAP line. This 100 percent hold rate is rare — most bullish anchors hold 70-80 percent of the time, not 100.
- Institutional reaccumulation: Rising AVWAP in a stock that had just fallen 40 percent confirms that new buyers were taking stock from panic sellers. Domestic mutual funds and foreign institutional investors were net buyers of Reliance through April-May 2020.
Bullish Anchored VWAP in Practice

Chart window: Nov 2016 – Jun 2017 · Data refreshed April 17, 2026 · Source: NSE (daily OHLC)
Bullish anchors are not limited to crash lows. Any clean swing low where a stock starts a sustained uptrend is a candidate. Bajaj Finance’s December 22, 2016 low at Rs 76.54 is a pre-Covid example. The stock had been in a multi-week correction; 22 December was the lowest daily close of the move. Anchoring VWAP there and holding 60 sessions produced a 53.5 percent return with 100 percent of closes above AVWAP.

Chart window: Apr – Oct 2016 · Data refreshed April 17, 2026 · Source: NSE (daily OHLC)
SBI’s May 24, 2016 swing low at Rs 169.50 is another clean pre-Covid setup. The state bank had been consolidating ahead of the RBI rate-decision cycle. Anchoring on 24 May gave traders a rising AVWAP that held as dynamic support through every pullback over the next 3 months. Return: +46.5 percent over 60 sessions.
The common thread across all three examples — Reliance, Bajaj Finance, SBI — is that the anchor marks the lowest close of a corrective swing that was immediately reversed. The first 5-10 bars after the anchor all close above AVWAP. When that early hold rate is 80 percent or better, the anchor is likely valid. When price closes back below AVWAP within the first 5 bars, the anchor failed and should be reset.
Bearish Anchored VWAP as Warning Signal
The mirror of a bullish swing-low anchor is a bearish swing-high anchor. When a stock prints a clear high and then fails to recover that level, anchoring VWAP at the high often produces a line that every subsequent rally fails to reclaim. This is institutional distribution in visible form.

Chart window: Jun – Dec 2018 · Data refreshed April 17, 2026 · Source: NSE (daily OHLC)

Chart window: Jan – Jun 2020 · Data refreshed April 17, 2026 · Source: NSE (daily OHLC)
Axis Bank’s February 12, 2020 swing high at Rs 755 produced one of the cleanest bearish AVWAP patterns in the audit window. The stock topped 5 weeks before the broader Covid panic. Anchoring VWAP at 12 February, every rally over the following 60 sessions failed at AVWAP from below — including a March rally attempt and an April bounce. Net return over 60 sessions: -48.5 percent. A trader reading the AVWAP as dynamic resistance could have avoided long positions on Axis Bank through the entire Covid decline.
Bearish AVWAPs are particularly useful because they often fire before price action traders notice the weakness. A lower high plus a falling AVWAP is a stronger short signal than a lower high alone — the AVWAP adds a volume-weighted layer that captures institutional selling that raw price action misses.
Anchored VWAP as Dynamic Support or Resistance
The most practical use of AVWAP for swing traders is as dynamic support in an uptrend and dynamic resistance in a downtrend. “Dynamic” means the line moves with each new bar — unlike a horizontal support level, AVWAP rises as an uptrend accumulates volume, giving pullback entries a moving reference line.

Chart window: Aug 2020 – Feb 2021 · Data refreshed April 17, 2026 · Source: NSE (daily OHLC)
The actionable pattern here is: anchor AVWAP at a confirmed swing low, wait for the first pullback to touch AVWAP, then enter long with a stop just below the anchor low. Target is the prior swing high or a fixed multiple of the stop distance (1.5R or 2R typical). When AVWAP acts as dynamic support and price bounces cleanly, successive pullbacks tend to produce similar setups — which is how swing traders pyramid into trending positions without chasing.
Where to Anchor Your VWAP

Chart data: Evergreen reference · Last reviewed April 17, 2026
Not every bar is a valid anchor. A useful anchor must mark a moment where something meaningful happened — where institutional positioning can plausibly be measured from. Four anchor categories have proven edge on NSE data:
- Major swing lows: The lowest daily close during a sharp correction. Requires visible capitulation volume. Examples: Reliance Mar 23, 2020, Bajaj Finance Dec 22, 2016, Tata Steel Sep 24, 2020.
- Major swing highs: The highest daily close before a confirmed decline. Often a failed breakout or a double-top right shoulder. Examples: Maruti Jul 24, 2018, Axis Bank Feb 12, 2020.
- Earnings dates: The session when results are announced (typically after market close; anchor on the next open). Measures the average price paid by institutions who repositioned on the fundamental data. Works well for large caps with consistent institutional ownership.
- Major news events: Union Budget day, RBI rate decisions, geopolitical shocks. The anchor captures flow around the event until the market digests the news. Useful for 5-15 session windows.
Avoid anchoring at arbitrary dates. “Last Friday” or “start of the month” are not meaningful anchors — nothing changed on those dates that institutional positioning would have shifted around. An anchor only adds value when there was a genuine inflection point at that bar.
Interactive Tool: VWAP Intraday Tool
Watch VWAP update bar by bar across a simulated intraday session. Pick one of four scenarios (trending up, trending down, choppy range, news spike), shift the anchor bar to see how VWAP reacts to different starting points, and adjust the volume profile between Low, Normal, and High. The stats panel reports what percentage of bars closed above VWAP and classifies the session as Bullish, Neutral, or Bearish.
How Institutions Use VWAP
Understanding institutional VWAP usage helps retail traders interpret the line correctly. Three common institutional patterns:
- Execution benchmarking: A large order to buy 500,000 shares is usually sliced into small child orders across the session. The execution desk grades its fill against session VWAP. Beating VWAP (average fill below session VWAP for a buy) is the benchmark for good execution.
- Passive buy/sell around VWAP: "VWAP algos" place limit orders at or slightly below VWAP for buys (slightly above for sells), scaling size as VWAP moves. This is why intraday price action often oscillates around VWAP in range-bound sessions — algos are mechanically filling on either side of the line.
- Multi-anchor monitoring: Hedge funds often overlay several AVWAP lines on the same chart: one from the last earnings date, one from a recent major news event, one from the year-to-date open. Price action relative to each line signals whether different institutional cohorts are net long or net short.
The multi-anchor technique is powerful and underused by retail traders. Two AVWAP lines from different events reveal regime changes more clearly than any single line. Reliance in 2019-2020 is a case study: anchoring from December 20, 2019 gave a bearish AVWAP that dominated the Covid decline, while anchoring from March 23, 2020 gave a bullish AVWAP that dominated the recovery. Both lines on the same chart show the regime change visibly.

Chart window: Dec 2019 – Aug 2020 · Data refreshed April 17, 2026 · Source: NSE (daily OHLC)
Practical Rule Book
- Intraday trading: Use Daily VWAP on 5-minute or 15-minute charts. Long bias when price is above VWAP; short bias below. Reversion trades (fade the extreme) work best in range sessions, trend-continuation trades (buy dips to VWAP) in trending sessions.
- Swing trading (4-8 weeks): Anchor VWAP at a confirmed swing low or swing high. Enter on pullbacks to AVWAP with a stop just beyond the anchor. Target 1.5R to 2R or the prior swing high/low.
- Position trading (3-12 months): Use long-horizon AVWAP anchored at a quarterly earnings release or a major macro event. Hold as long as price respects the anchored line.
- Cross-check with volume: An anchor is only as good as the volume at the anchor bar. Low-volume anchors fail more often. Require volume above its 30-day average at the anchor bar.
- Multi-anchor for regime analysis: Overlay 2-3 AVWAP lines from different anchor dates. A regime change is visible when price breaks one line and holds the other.
Common Mistakes
Mistake 2: Using Daily VWAP on higher timeframes. Daily VWAP resets at 9:15 AM every session. It is nearly useless on daily charts and completely meaningless on weekly charts. For those timeframes use Anchored VWAP instead.
Mistake 3: Anchoring at arbitrary dates. An anchor is only useful when something meaningful happened at that bar — a clear swing high or low, an earnings announcement, a major news event. Random dates produce random AVWAP lines.
Mistake 4: Trading every touch of VWAP without context. Price touches VWAP multiple times per day in normal markets. Not every touch is a setup. Require additional confluence: a candlestick pattern, a support level, or a volume signal.
Mistake 5: Abandoning an anchor too quickly. A bullish AVWAP can have 2-3 minor violations and still be valid overall. Look at the broader context — a single weak close below AVWAP is not a regime change. A week of closes below is.
Related Reading
- EMA Basics — faster moving average cousin of VWAP for trend identification without volume weighting.
- SMA vs EMA — when to use simple vs exponential moving averages.
- Moving Average Crossovers — golden and death crosses for swing and position traders.
- Volume in Trading — volume context that makes VWAP meaningful in the first place.
- Support and Resistance — how AVWAP relates to static S/R levels.
Quick Quiz: VWAP
Five questions to check your grasp. No login, no score saved — just instant feedback.
1. VWAP stands for …
2. VWAP resets at …
3. A Nifty 50 intraday trader sees price holding above VWAP all morning. The common interpretation is …
4. Who uses VWAP most heavily in daily practice?
5. A common misconception about VWAP is …
| VWAP signal | Price location | Trade response |
|---|---|---|
| Above VWAP, rising | Strong intraday bull trend | Buy pullbacks to VWAP |
| Below VWAP, falling | Strong intraday bear trend | Short rallies to VWAP |
| VWAP rejection | Touches VWAP and reverses | Trade in rejection direction |
| VWAP break + volume | Crosses VWAP on heavy volume | Trend reversal warning |
I traded VWAP rejection on Bank Nifty intraday for a year before I trusted it. We tested the rule across the F&O top 50 — the edge held when volume was above average.
What does VWAP stand for?
VWAP stands for Volume Weighted Average Price. It is a running average of Typical Price (high plus low plus close divided by three) weighted by the volume traded at each bar. The formula is cumulative (Typical Price times Volume) divided by cumulative Volume from an anchor point forward.
Is VWAP good for day trading?
Yes. Daily VWAP is the primary reference line for intraday traders. A long bias when price is above VWAP and a short bias when below is a standard intraday framework. Reversion trades work in range-bound sessions, continuation trades work in trending sessions.
What is Anchored VWAP?
Anchored VWAP is a VWAP calculation that starts from any user-selected bar instead of resetting at session open. It lets swing traders and position traders measure average price from a significant event: a swing low, a swing high, an earnings release, or a major news date.
How is VWAP different from a moving average?
A simple moving average gives equal weight to every bar in its lookback window. VWAP gives more weight to bars with higher volume. On a bar with 10 times normal volume, VWAP shifts much more than an SMA does. This makes VWAP a better indicator of where real money transacted, not just where the price printed.
Can I use VWAP on weekly charts?
Daily VWAP on weekly charts is not useful because it resets each trading day. Anchored VWAP on weekly charts is useful when anchored at a major event like a macro shock or a quarterly earnings release. For long-term institutional flow analysis, a weekly AVWAP anchored at the start of a fiscal year can reveal accumulation or distribution patterns.
Why do institutions care about VWAP?
Institutions use VWAP to grade execution quality. A fund manager buying 500,000 shares compares the average fill price to session VWAP. Beating VWAP (buying below the session average) adds alpha. Missing VWAP (buying above) gives up price. This is why VWAP is the industry-standard execution benchmark.
What is a good anchor point for Anchored VWAP?
Good anchors mark real inflection points: a major swing low with capitulation volume, a swing high with failed breakout, an earnings announcement day, or a major macro event like a Union Budget or RBI rate decision. Avoid arbitrary dates like a random Friday or the start of the month — nothing changed on those dates that institutional positioning would have shifted around.
Does VWAP work on all Indian stocks?
VWAP works best on liquid large caps and indices where volume is meaningful: Nifty 50, Bank Nifty, Reliance, TCS, Infosys, HDFC Bank, SBI. It is less reliable on illiquid mid and small caps where a single large trade can distort the volume profile. Always check volume consistency before relying on VWAP or AVWAP signals.
The Bottom Line
VWAP is not magic. It is a cumulative average that weights each bar by its volume. What makes it powerful is that volume-weighting captures where real money actually traded — which is different from where the average candle closed. Daily VWAP is the standard reference for intraday traders. Anchored VWAP is the standard reference for swing and position traders who want to measure institutional flow from a specific inflection point.
The NSE audit examples in this article are reproducible. Anyone with a TradingView account and 20 minutes can anchor VWAP at the March 23, 2020 Covid low on Reliance and verify that every candle closed above it for 60 sessions. The same exercise on Maruti from July 24, 2018 will show every rally failing at a falling AVWAP. These are not cherry-picked — they are the textbook cases of what bullish and bearish anchored VWAPs look like on real Indian stocks.
Start with one anchor on one stock you already watch. Identify the most recent clear swing high or swing low on the daily chart. Anchor VWAP there. Watch what price does on the first 10 bars. If 80 percent or more close on the expected side of AVWAP, you have a valid anchor — and a reference line that can guide entries and exits for weeks.
Risk Notice
Trading in equities, derivatives, and index products carries substantial risk of loss. The examples in this article are historical and do not guarantee future returns. Price data is sourced from NSE daily OHLC feeds; back-testing any strategy on your own data is essential before deploying capital. This content is educational only. It is not an investment recommendation, a tip, or a solicitation to trade any specific security. Consult a SEBI-registered advisor before acting on any information here. Size every trade at 1 percent of your total capital and never trade money you cannot afford to lose.