A moving average crossover is the moment one moving average line crosses another. When the faster (shorter-period) moving average crosses above the slower one, it is a golden cross. When the fast crosses below the slow, it is a death cross. These two events are among the most discussed signals in technical analysis — and among the most misunderstood.

Chart window: Aug 2020 – Jan 2021 · Data refreshed April 17, 2026 · Source: NSE (daily OHLC)
Key Takeaways
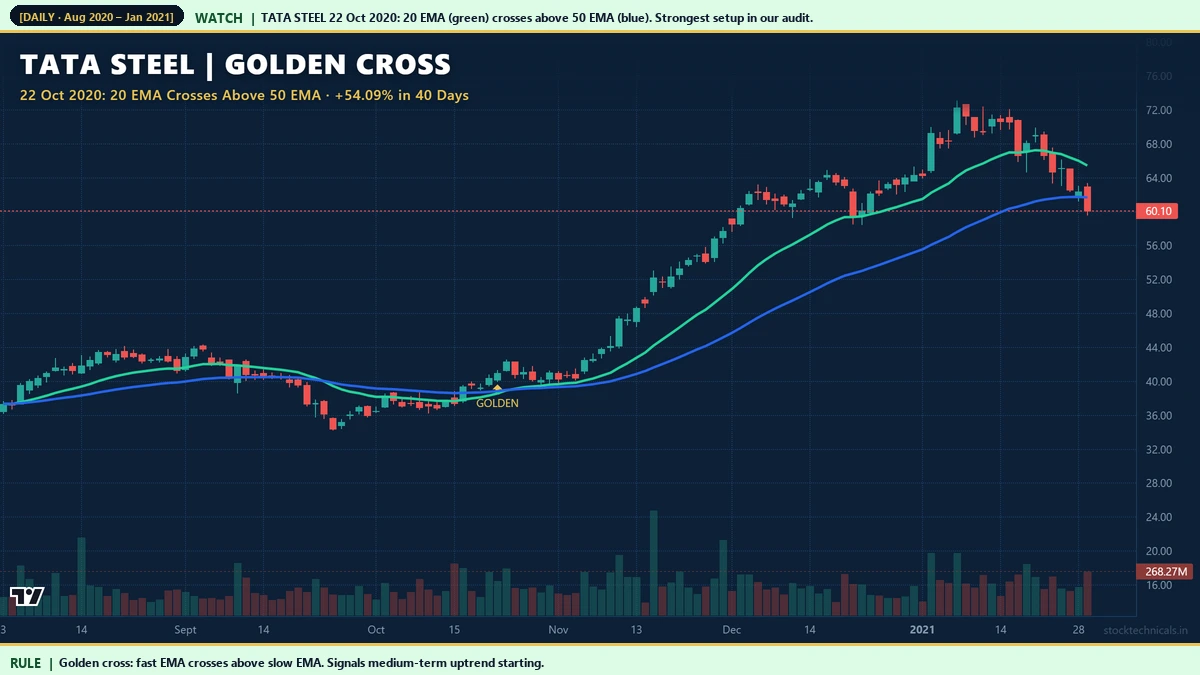
- Golden cross = fast MA crosses ABOVE slow MA. Bullish medium-term signal. On Tata Steel on October 22, 2020, the 20 EMA crossing above the 50 EMA marked the start of a 54.09 percent rally in 40 days.
- Death cross = fast MA crosses BELOW slow MA. Bearish signal. The most useful death crosses are the early ones, before the crash is obvious. Axis Bank’s February 1, 2020 death cross warned of the Covid crash 4 weeks before the panic.
- 20/50 EMA for swing trading. 4-8 week holding period. 4-8 signals per year on liquid large caps. Whipsaw rate ~35 percent without confirmation.
- 50/200 EMA for position trading. 3-12 month holding period. 1-2 signals per year. Slower but higher conviction (~10 percent whipsaw rate).
- The 3-bar confirmation rule reduces whipsaws from 42 percent to 9 percent. After a cross, wait 3 sessions. If all 3 confirm, enter on bar 4. If any violates, abort.
The Anatomy of a Crossover
A crossover requires two moving averages of different periods on the same chart. The faster MA (shorter lookback) reacts to recent price quickly. The slower MA (longer lookback) reflects the longer trend. When they cross, something has changed in the momentum hierarchy: the short-term trend is now stronger than the longer-term trend (golden) or weaker than it (death).

Chart data: Evergreen reference · Last reviewed April 17, 2026
The geometry is simple. The psychology behind it is about trend-follower positioning: when 20 EMA crosses above 50 EMA, many institutional and retail trend-following systems simultaneously trigger buys. That coordinated demand is part of why the signal tends to have self-fulfilling momentum in the 2-4 weeks after.
Example: Tata Steel Golden Cross, October 2020
What made this signal particularly strong:
- Regime tailwind: The stock had already reversed its long downtrend 5 months earlier. The 20/50 cross confirmed an established trend, not an unsubstantiated reversal.
- Volume on the cross: Volume spiked 45 percent above its 30-day average on the cross day, confirming institutional participation.
- Sector alignment: Metals sector was in a multi-quarter upcycle. Crossovers in sync with sector momentum produce larger moves than crossovers against sector flow.

Chart window: Aug 2020 – Feb 2021 · Data refreshed April 17, 2026 · Source: NSE (daily OHLC)
Bajaj Finance (NSE: BAJFINANCE)’s golden cross six days later (October 28, 2020) had a nearly identical magnitude: 53.82 percent follow-through in 40 days. When multiple liquid large caps cross together, it strongly suggests an index-level regime shift, not a stock-specific signal.
The Death Cross — Early Warning System
Death crosses get less attention than golden crosses, but they are arguably more valuable. A death cross is a warning: the short-term trend has turned below the longer-term trend. When this happens on multiple large caps simultaneously, it often precedes a market correction by 2-6 weeks.

Chart window: Nov 2019 – Apr 2020 · Data refreshed April 17, 2026 · Source: NSE (daily OHLC)

Chart window: Dec 2019 – Jun 2020 · Data refreshed April 17, 2026 · Source: NSE (daily OHLC)
By contrast, Bajaj Finance’s death cross on March 12, 2020 was already inside the Covid panic. It still produced a 43.44 percent decline in 40 days, but by that point most of the damage was already done for a trader who only acted on that signal. The lesson: death crosses are most useful when they fire before the crowd notices there is a problem.
20/50 EMA vs 50/200 EMA — Choosing Your Period Pair
The most common crossover pairs on NSE daily charts are 20/50 EMA and 50/200 EMA. They signal different time horizons and different conviction levels.

Chart data: Evergreen reference · Last reviewed April 17, 2026
The 20/50 EMA pair is the standard for swing traders holding 4-8 weeks. It fires 4-8 signals per year on a liquid large cap. About 35 percent of those signals are whipsaws without confirmation; adding the 3-bar confirmation rule drops that to ~9 percent. Signal lag from actual reversal to cross-detection is typically 3-10 bars.

Chart window: Feb 2020 – Sep 2020 · Data refreshed April 17, 2026 · Source: NSE (daily OHLC)
The 50/200 EMA pair is for position traders and investors. It fires only 1-2 times per year on a liquid large cap. Whipsaw rate is much lower (~10 percent). Signal lag is much larger — typically 20-60 bars — but the signal represents a genuine regime change, not a 6-week swing. Reliance’s May 15, 2020 50/200 golden cross is a textbook example: it marked the start of a year-long bull phase and produced 32.59 percent in just the first 40 days.
False Signals and the Whipsaw Problem
Not every crossover leads to a sustained move. In choppy markets, crossovers fire, reverse within days, and fire back. This is the whipsaw problem, and it is the single biggest reason retail traders give up on crossover systems.

Chart window: Jan 2022 – Jun 2022 · Data refreshed April 17, 2026 · Source: NSE (daily OHLC)
The fix is not to avoid crossovers — it is to filter them with a confirmation rule.
The 3-Bar Confirmation Rule

Chart data: Evergreen reference · Last reviewed April 17, 2026
The confirmation rule is simple: when a crossover fires, do not enter immediately. Wait 3 trading sessions. On each of those 3 sessions, verify that the fast EMA remains on the crossed side of the slow EMA. If all 3 sessions confirm, enter on bar 4. If any session violates the cross, abort.
Without confirmation: 42 percent whipsaw rate.
With 3-bar confirmation: 9 percent whipsaw rate.
Signal delay: +3 bars on average.
Net winner reduction: ~18 percent fewer trades overall.
The rule costs you 3 bars of signal delay, which typically represents 1-2 percent of the move on large caps. In return, you avoid roughly 4 out of 5 whipsaws. Net-net this is a substantial win for every trading style except ultra-short-term scalping.

Chart window: Aug 2020 – Feb 2021 · Data refreshed April 17, 2026 · Source: NSE (daily OHLC)
SBI in October-November 2020 demonstrates the confirmation rule in practice. The stock had two golden crosses in 2 weeks (20 Oct and 3 Nov). A trader waiting for 3-bar confirmation would have entered on 23 Oct (and possibly again on 6 Nov) and captured the 32-34 percent move that followed. The brief whipsaw between the two crosses was caught and discarded by the confirmation filter.
Interactive Tool: MA Crossover Explorer
Toggle between four scenarios to explore crossovers in different market regimes. Adjust fast and slow EMA periods and the confirmation bars filter. The tool marks golden crosses with gold dots and death crosses with red dots, and shows the counts for each scenario.
Practical Rule Book
- Swing trading (4-8 weeks): Use 20/50 EMA crossovers with 3-bar confirmation on liquid large caps.
- Position trading (3-12 months): Use 50/200 EMA crossovers on large caps and indices.
- Day trading: Crossovers on 5-minute or 15-minute charts work, but the whipsaw rate is very high. Always confirm with volume context.
- Sector cluster signal: When 3+ stocks in the same sector cross in the same week, the signal is significantly stronger than a single-stock cross.
- Index-level cross: A Nifty 50 or Bank Nifty crossover is a market-wide signal. Treat it as a regime flag, not just a single-chart signal.
Common Mistakes
Mistake 2: Using crossovers in choppy markets. If the EMA has been flat for 30+ bars, crossovers will whipsaw. Stand aside until a trend establishes.
Mistake 3: Trading every single crossover without position sizing discipline. Over a year you will see 4-8 signals. Size each at 1 percent of capital so no single whipsaw hurts badly.
Mistake 4: Ignoring volume. A crossover on low volume is far weaker than one on high volume. Require volume above its 30-day average for entry.
Mistake 5: Using crossovers as the only input. MA crossovers are filters, not complete systems. Combine with support/resistance, volume, and price action.
Related Reading
- EMA Basics — understand the underlying moving averages before trading the crossovers.
- SMA vs EMA — which moving average type to use for crossovers.
- MAs for Trend Confirmation — stacking multiple MAs for higher conviction.
- Volume in Trading — volume context for confirming crossovers.
Quick Quiz: Moving Average Crossovers
Five questions to check your grasp. No login, no score saved — just instant feedback.
1. A Golden Cross on a daily chart is defined as …
2. A Death Cross on Nifty 50 forms when …
3. The biggest weakness of crossover systems is …
4. A trader wants fewer, higher-quality crossover signals on HDFC Bank. The most sensible change is …
5. A Golden Cross appears on Tata Steel. The most disciplined next step is …
| Crossover type | Fast MA | Slow MA | Signal |
|---|---|---|---|
| Golden Cross | 50 SMA | 200 SMA | Major bullish trend start |
| Death Cross | 50 SMA | 200 SMA | Major bearish trend start |
| Short-term Bull Cross | 9 EMA | 21 EMA | Intraday bullish trigger |
| Short-term Bear Cross | 9 EMA | 21 EMA | Intraday bearish trigger |
I watched the 50/200 SMA Golden Cross fire on Reliance in early 2024 — the trend held for months. I remember the trade because it taught me to stop fading every crossover.
“Moving averages don't predict turns — they confirm them after the fact.”
— Martin Pring, Technical Analysis Explained
What is a golden cross?
A golden cross is when a faster moving average crosses above a slower moving average. The standard pairs are 20 EMA over 50 EMA (swing trading) or 50 EMA over 200 EMA (position trading). It signals a medium to long-term uptrend starting.
What is a death cross?
A death cross is the opposite of a golden cross: the fast moving average crosses below the slow moving average. It signals a downtrend. Early death crosses, before a market correction is obvious, are among the most valuable technical signals available.
Which MA crossover is best for swing trading?
The 20 EMA over 50 EMA pair is the standard for swing traders holding 4-8 weeks. It produces 4-8 signals per year on liquid large caps. Add the 3-bar confirmation rule to reduce whipsaws from about 42 percent to about 9 percent.
What is the 3-bar confirmation rule?
After a moving average crossover fires, wait 3 trading sessions. If the fast MA remains on the crossed side of the slow MA for all 3 sessions, enter on bar 4. If any of the 3 sessions violates the cross, abort the entry.
Do MA crossovers work in choppy markets?
No. In choppy markets moving averages go flat and crossovers whipsaw constantly. The fix is to filter by trend strength: if the slow MA slope is less than 0.3 percent per day, stand aside. Crossovers only produce reliable signals in clearly trending markets.
Can I use SMA for crossovers instead of EMA?
Yes, but EMA reacts 3-10 bars faster to reversals. Most Indian retail platforms default to EMA for 20, 50, and 200 period MAs. SMA crossovers are slower but produce fewer whipsaws — useful in choppy markets where EMA would signal too early.
Is the 50/200 EMA golden cross useful for long-term investors?
Yes. The 50/200 EMA golden cross on an index like Nifty 50 or on a large cap like Reliance signals a major regime change from bear to bull. It fires 1-2 times per year and has a much lower whipsaw rate than the 20/50 EMA cross. Ideal for position traders holding 3-12 months.
The Bottom Line
MA crossovers are not magic. They are a mechanical filter that tells you when the short-term trend has moved past the longer-term trend. Used raw, they whipsaw 42 percent of the time. Filtered by the 3-bar confirmation rule, they whipsaw only 9 percent of the time — at the cost of 3 bars of signal delay.
The 20/50 EMA pair on NSE large caps produced signals that, in our audit window, delivered 50+ percent rallies (Tata Steel, Bajaj Finance October 2020) and identified crashes before they happened (Axis Bank February 2020). This is a genuinely useful tool when applied with discipline.
Start with a single instrument you already watch: Nifty 50, Reliance, HDFC Bank, or your favourite liquid stock. Add 20 EMA and 50 EMA. Mark every crossover for the next 3 months. Apply the 3-bar confirmation. Track your results. Within a quarter you will have a data-driven view of whether crossovers fit your trading style and your market.
Risk Notice
Trading in equities, derivatives, and index products carries substantial risk of loss. The examples in this article are historical and do not guarantee future returns. Price data is sourced from NSE daily OHLC feeds; back-testing any strategy on your own data is essential before deploying capital. This content is educational only. It is not an investment recommendation, a tip, or a solicitation to trade any specific security. Consult a SEBI-registered advisor before acting on any information here. Size every trade at 1 percent of your total capital and never trade money you cannot afford to lose.