Quick Answer: On-Balance Volume (OBV) is a cumulative volume indicator that reveals institutional accumulation and distribution. Volume on up days adds; volume on down days subtracts. The absolute number is meaningless — track the trend instead. OBV divergence (price up while OBV down) predicts reversals before they happen.
Published February 27, 2026 · Last refreshed April 27, 2026. Prices and data are compiled with reasonable care but — always confirm against your broker before trading.
Key Takeaways
- Cumulative volume tracker: OBV adds volume on higher closes and subtracts on lower closes, exposing smart money moves behind the price.
- Volume precedes price: Institutional accumulation shows in OBV before price breaks out — giving an early warning signal.
- Divergence is the power signal: When price makes new highs but OBV does not, expect a reversal within days. Act immediately, do not wait.
- Combine with trend confirmation: Use OBV with ADX, RSI, and MACD to avoid false signals in choppy, range-bound markets.
- Hourly+ only: OBV works on hourly, 4-hour, and daily charts. 1-5 minute charts are too noisy for reliable signals.

OBV: On-Balance Volume Explained for Traders
Introduction
If you’ve been following along with our technical analysis journey, you already understand that volume is the heartbeat of price movement. Volume tells us how much buying and selling interest exists at each price level. But here’s the problem: raw volume numbers alone don’t tell you if smart money is accumulating or distributing. You might see volume spikes, but you won’t know if it’s supporting the trend or warning of a reversal.
This is where OBV (On-Balance Volume) becomes your secret weapon.
OBV is one of the most underrated volume indicators in technical analysis. While traders obsess over RSI, MACD, and Bollinger Bands, OBV quietly works in the background to reveal what institutional traders are actually doing. It shows you accumulation (smart money buying) and distribution (smart money selling) before price confirms these moves on the chart.
Think of OBV as a volume momentum tracker. It accumulates volume on days when price closes higher and reduces volume on days when price closes lower. The result? A cumulative line that moves higher when volume confirms uptrends and falls when volume confirms downtrends. When price and OBV move in opposite directions, you get divergence—one of the most powerful predictive signals in technical analysis.
In this article, you’ll learn:
- What OBV is and how Joe Granville (its creator) revolutionized volume analysis
- The exact formula used to calculate OBV with step-by-step examples using Nifty 50 and Bank Nifty
- Why the OBV number itself is meaningless—it’s the trend that matters
- How to spot OBV divergence: the setup that predicts price reversals before they happen
- How to use OBV to confirm breakouts above resistance levels
- How to combine OBV with RSI, MACD, ADX, and other indicators
- Exactly how to set up OBV on TradingView and Zerodha Kite
- Five actionable rules for trading with OBV
- Common OBV mistakes that cost traders money
By the end of this article, you’ll have a complete toolkit for using volume analysis to confirm your chart patterns, trend trades, and breakout strategies. Let’s dive in.
What is OBV? Understanding the Creator’s Vision

OBV stands for On-Balance Volume. It was created by Joe Granville in 1963 and is built on one simple but revolutionary idea: volume should lead price.
This philosophy—volume precedes price—is the foundation of all modern volume analysis. If smart money (institutional traders, fund managers, large traders) are accumulating, they do it quietly over many days or weeks. Volume increases during accumulation, but the price might not move much. However, once the accumulation phase completes, price explodes higher. By that time, if you wait for price confirmation, you’ve already missed much of the move.
OBV lets you see accumulation before the price breakout happens.
How does OBV work?
OBV is a cumulative volume indicator. Here’s the core concept:
- When price closes higher than the previous close: Add the day’s volume to the OBV line
- When price closes lower than the previous close: Subtract the day’s volume from the OBV line
- When price closes unchanged (same as previous close): OBV stays the same
That’s it. OBV is a running total—a cumulative sum—that reflects whether volume is flowing into (up days) or out of (down days) the market.
Think of it like a bank account. Every up-close day adds a deposit (volume). Every down-close day withdraws (volume). If deposits (up-volume) exceed withdrawals (down-volume), your account balance (OBV) keeps rising. If withdrawals exceed deposits, the balance falls.
The key insight: If OBV is rising while price moves sideways or slightly down, smart money is quietly accumulating. When the breakout finally happens, volume is already on the buying side. But if price rises while OBV falls, that’s a warning sign—the move is failing because sellers (distributors) are overwhelming buyers (accumulators).
This is why OBV is so powerful. It reveals hidden accumulation and distribution that raw price charts miss.
How OBV is Calculated: Step-by-Step Example with Real Numbers
Let’s walk through a real calculation using a 5-day example from a Nifty 50 (NSE: NIFTY 50) 1-hour chart. This will cement your understanding of how OBV actually works.
OBV Formula:
“`
OBV = Previous OBV + (Volume on up-close days) or – (Volume on down-close days)
“`
Example: Nifty 50 — 1-Hour Chart, 5-Day Period
| Day | Close Price | Previous Close | Volume | OBV Calculation | OBV Value |
|---|---|---|---|---|---|
| Day 1 | ₹23,450 | — | 1,250,000 | Starting OBV = 0 | 0 |
| Day 2 | ₹23,520 | ₹23,450 | 1,500,000 | Up-close: 0 + 1,500,000 | +1,500,000 |
| Day 3 | ₹23,480 | ₹23,520 | 900,000 | Down-close: 1,500,000 – 900,000 | +600,000 |
| Day 4 | ₹23,610 | ₹23,480 | 1,800,000 | Up-close: 600,000 + 1,800,000 | +2,400,000 |
| Day 5 | ₹23,600 | ₹23,610 | 1,100,000 | Down-close: 2,400,000 – 1,100,000 | +1,300,000 |
What does this tell us?
Over these 5 days, the Nifty 50 closed higher 3 times and lower 2 times. But more importantly, the OBV ended at +1,300,000, indicating that the cumulative volume on up-close days (1,500,000 + 1,800,000 = 3,300,000) exceeded the volume on down-close days (900,000 + 1,100,000 = 2,000,000). This means volume is flowing into the market—smart money is accumulating.
Real-World Bank Nifty Example:
Now let’s use Bank Nifty, which has higher volatility and more dramatic OBV swings:
| Day | Close Price | Previous Close | Volume | OBV Calculation | OBV Value |
|---|---|---|---|---|---|
| Day 1 | ₹49,200 | — | 800,000 | Starting OBV = 0 | 0 |
| Day 2 | ₹49,350 | ₹49,200 | 1,200,000 | Up-close: 0 + 1,200,000 | +1,200,000 |
| Day 3 | ₹49,100 | ₹49,350 | 950,000 | Down-close: 1,200,000 – 950,000 | +250,000 |
| Day 4 | ₹49,500 | ₹49,100 | 2,100,000 | Up-close: 250,000 + 2,100,000 | +2,350,000 |
| Day 5 | ₹49,600 | ₹49,500 | 1,500,000 | Up-close: 2,350,000 + 1,500,000 | +3,850,000 |
In this example, Bank Nifty had four up-close days out of five, and OBV soared to +3,850,000. This tells us that volume is overwhelmingly on the buying side. Smart money is aggressively accumulating. If you see this on a chart, you should expect the uptrend to continue.
The Critical Point About OBV Numbers:
Here’s where most traders get confused: The OBV number itself means nothing. Don’t look at whether OBV is at +1,300,000 or +5,000,000. Those are arbitrary numbers that depend entirely on the time period and volume levels.
What matters is the trend of the OBV line, not the value.
If OBV is rising, accumulation is happening. If OBV is falling, distribution is happening. If OBV is flat, there’s no conviction either way. That’s all you need to know.
Reading OBV: The Trend Matters, Not the Number
This section is critical because it separates traders who understand volume from those who waste time chasing OBV numbers.
The Golden Rule: OBV is a directional indicator, not a magnitude indicator.
You do NOT trade OBV by saying “OBV is positive, so buy” or “OBV is negative, so sell.” That’s fundamentally wrong and will cost you money.
Instead, you read OBV the same way you read price action:
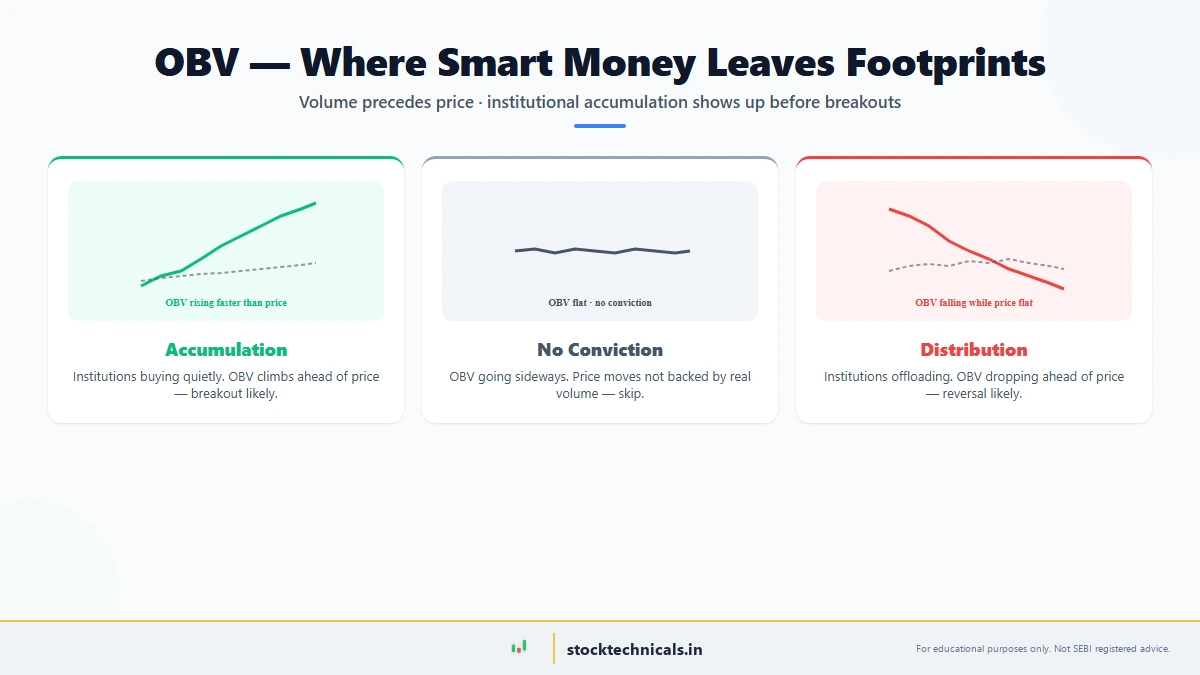
1. Rising OBV = Accumulation
When the OBV line is trending upward, it means volume on up-close days is exceeding volume on down-close days. Smart money is buying. Accumulation is happening. If you see a rising OBV during a sideways consolidation phase, expect a breakout to the upside soon.
Example: Reliance stock consolidates between ₹2,800 and ₹2,850 for 3 weeks. Volume is moderate. But OBV is quietly rising. This tells you that during these sideways days, buyers are dominating the volume flow. When the breakout finally comes, volume will be ready to support it.
2. Falling OBV = Distribution
When the OBV line is trending downward, it means volume on down-close days is exceeding volume on up-close days. Smart money is selling. Distribution is happening. If you see falling OBV while price is near all-time highs, be cautious. A reversal is likely coming.
Example: TCS rallies to ₹4,200 on increasing volume. But OBV starts falling. This mismatch—price up, OBV down—tells you that even though price is rising, volume is favoring sellers. Smart money is distributing their shares to retail buyers. The uptrend is weakening.
3. Flat OBV = No Conviction
When OBV is neither rising nor falling—it’s trading sideways—the market has no conviction. Accumulation and distribution are balanced. This often happens during choppy, range-bound market conditions. Don’t trade with OBV signals when OBV itself is flat. Wait for OBV to show a clear trend first.
Combining OBV Trend with Price Action:
The real power of OBV emerges when you combine the OBV trend with price direction:
| Price Trend | OBV Trend | Interpretation | Action |
|---|---|---|---|
| Uptrend | Rising OBV | Strong uptrend. Volume confirms price. | BUY on any pullback |
| Uptrend | Falling OBV | Weak uptrend. Volume divergence warns of reversal. | BE CAUTIOUS — don’t chase |
| Downtrend | Falling OBV | Strong downtrend. Volume confirms price. | SELL or stay in short |
| Downtrend | Rising OBV | Weak downtrend. Volume divergence warns of reversal. | BE CAUTIOUS — upside breakout coming |
| Sideways | Rising OBV | Accumulation in range. Breakout up coming soon. | WATCH for breakout above resistance |
| Sideways | Falling OBV | Distribution in range. Breakdown down coming soon. | WATCH for breakout below support |
This table is your roadmap. Bookmark it.
OBV Divergence: The Most Powerful Signal in Volume Analysis
Now we’re getting to the really powerful stuff. OBV divergence is one of the most reliable predictive signals in technical analysis. When you master this concept, you’ll start seeing reversal setups before they happen on price charts.
What is OBV Divergence?
OBV divergence occurs when price and OBV move in opposite directions. Price makes higher highs while OBV makes lower highs (bearish divergence), or price makes lower lows while OBV makes higher lows (bullish divergence).
Divergence signals a loss of momentum. If price is making new highs but volume (reflected in OBV) is decreasing, it means fewer buyers are willing to push price higher. The uptrend is losing fuel. A reversal is coming.
Bullish OBV Divergence:
Setup: Price makes lower lows, but OBV makes higher lows.
What it means: Even though price is falling, volume is flowing into the market (OBV rising). Smart money is buying the dip. The downtrend lacks conviction because volume isn’t supporting the sell-off. An upside reversal is likely coming.
Example: HDFC Bank
Imagine HDFC Bank (₹1,600 to ₹1,500 to ₹1,480) is falling. Price makes new lows every few days. But OBV, instead of falling with price, starts rising. This tells you that during the sell-offs, buyers are stepping in and absorbing the selling. Smart money is accumulating at lower prices.
When the next green candle closes, price explodes upward—often with volume confirmation. This is the bullish divergence setup in action.
Bearish OBV Divergence:
Setup: Price makes higher highs, but OBV makes lower highs.
What it means: Price is hitting new highs, but volume is not following. OBV is falling or flat. This means fewer buyers are supporting the rally. Smart money is distributing shares to retail buyers chasing the high. The uptrend is running out of fuel. A downside reversal is coming.
Example: Infosys
Infosys rallies from ₹1,800 to ₹1,850 to ₹1,880. Price makes new highs. But OBV is not making new highs—it’s actually falling. Volume on up-close days is weak. Volume on down-close days is strong. This mismatch—price up, OBV down—is a bearish divergence.
Smart traders see this and start exiting positions or shorting. Within days or weeks, price reverses lower, and the rally that looked unstoppable fails.
How to Spot OBV Divergence:
- Look at the price swing high or low (a local peak or valley)
- Note the OBV value at that same point in time
- See if price makes a new high/low after that
- Check if OBV makes a new high/low at the same point
- If price makes a new extreme but OBV does not, you have divergence
- Price consolidates in a range (support at ₹2,800, resistance at ₹2,850)
- OBV trends upward during the consolidation (or stays flat, not falling)
- Price breaks above resistance (above ₹2,850)
- Volume spikes higher on the breakout day (reflected in OBV rising sharply)
- You buy on the breakout with confidence
- Price consolidates in a range (support at ₹2,800, resistance at ₹2,850)
- OBV is falling during the consolidation (volume is trending downward)
- Price breaks above resistance (above ₹2,850) on low volume
- OBV barely moves on the breakout (no volume confirmation)
- Within days, price closes back below resistance (false breakout)
- Open any stock chart on TradingView (Example: RELIANCE or NIFTY)
- Click the “Indicators” button (usually on the left toolbar or top right)
- Search for “OBV” in the indicator search box
- Click “On Balance Volume” (by TradingView)
- The OBV line appears below your price chart
- Customize the settings:
- Rising OBV = Accumulation
- Falling OBV = Distribution
- Flat OBV = Indecision
- OBV divergence with price = Reversal warning
- Open Zerodha Kite in your browser (kite.zerodha.com)
- Search for any Nifty 50 stock or Bank Nifty (Example: INFY or BANKNIFTY)
- Go to the chart view (click the chart icon if not already there)
- Click “Studies” (top toolbar, usually on the right)
- Search for “OBV” in the studies list
- Click “On Balance Volume” to add it
- The OBV indicator appears in a separate panel below price
- Customize:
- Comparing OBV levels across different stocks: OBV numbers are meaningless. Don’t say “Reliance has higher OBV than TCS, so Reliance is better.” Compare only the trends within the same stock.
- Waiting for OBV to hit a specific number: OBV doesn’t have targets or overbought/oversold levels. Ignore the number. Watch the trend.
- Using OBV on very small timeframes (1-min, 5-min): OBV works best on hourly, 4-hour, and daily charts. On 1-min charts, it’s too noisy and unreliable.
- Ignoring the overall price trend: Don’t buy just because OBV is rising in a downtrend. Always check the price context first.
- Trading OBV divergence without confirming with price action: If you see bearish OBV divergence, wait for price to actually show reversal signals (break below support, failed breakout attempt) before shorting.
Combining OBV with Other Indicators: Your Complete Volume Toolkit
OBV is powerful alone, but it’s even more powerful when combined with other indicators you’ve already learned about.
OBV + RSI: Confirming Momentum Reversals
RSI Basics measures momentum on a 0-100 scale. Combined with OBV, you get powerful reversal signals.
Setup: RSI is overbought (>70) while price is making new highs. But OBV is falling. This is a bearish divergence setup. Price is about to reverse down.
example: Infosys hits RSI of 78 (overbought). Price is at ₹1,900 (all-time high). But OBV is lower than it was at the previous all-time high (₹1,880). This divergence warned you 2 weeks before the stock corrected 8%.
OBV + MACD: Confirming Trend Changes
MACD (Moving Average Convergence Divergence) measures trend momentum. Combined with OBV, you identify when a trend is shifting.
Setup: MACD histogram is decreasing (trend weakening) while price is still making new highs. OBV confirms by falling. This is a triple warning: price divergence + MACD divergence + OBV divergence. Exit now.
example: Bank Nifty rallies to ₹50,200. MACD histogram shrinks. OBV falls. All three signals align: downtrend coming. You exit your long position at ₹50,150. The next week, Bank Nifty drops to ₹48,500. You saved 1,650 points.
OBV + Bollinger Bands: Identifying Breakout Opportunities
Bollinger Bands show when price is overbought or oversold based on volatility. Combined with OBV, you spot high-probability breakouts.
Setup: Price is consolidating between Bollinger Bands. OBV is rising. Price breaks above the upper Bollinger Band on high volume (OBV spikes). This is a confirmed breakout. Buy with confidence.
OBV + Support and Resistance: Testing the Strength of Levels
When price approaches support or resistance, OBV tells you if the level will hold or break.
Setup: Nifty 50 approaches strong support at ₹23,100. If OBV is rising as it approaches support, smart money is buying the dip. Support will hold. If OBV is falling as it approaches support, smart money is selling. Support will break.
OBV + ADX: Confirming Trend Strength
ADX measures trend strength on a 0-100 scale. Combined with OBV, you confirm whether a trend is strong or weak.
Setup: ADX is rising (strong trend) and OBV is rising (accumulation in uptrend). This is the strongest possible setup. The trend has legs. You can hold for weeks.
OBV + ATR: Volatility-Adjusted Breakout Trading
ATR (Average True Range) measures volatility. Combined with OBV, you size breakout trades based on volatility.
Setup: Stock breaks above resistance. OBV confirms with a volume spike. ATR is high (volatile). You reduce position size because volatility is elevated. ATR is low (stable). You increase position size because the move is stable.
5 Rules for Trading with OBV: Your Action Plan

Here are five non-negotiable rules for using OBV correctly in your trading:
Rule 1: OBV Trend > OBV Value
The direction of the OBV line is everything. The actual number (₹50 million, ₹100 million, ₹200 million) is irrelevant. You don’t care if OBV is at +500,000 or -500,000. You care only if OBV is rising, falling, or flat.
Action: Before every trade, ask: “Is OBV trending up, down, or sideways?” If you can’t clearly answer that, don’t trade yet. Wait for OBV to show a clear trend.
Rule 2: Accumulation Before Breakouts
Smart money accumulates before price moves. OBV rising before a breakout signals that professional traders are buying quietly. This is your green light to trade the breakout.
Action: When you see consolidation, check OBV. If OBV is rising during consolidation, the breakout will likely succeed. If OBV is falling, the breakout will likely fail. Trade accordingly.
Rule 3: OBV Divergence = Reversal Imminent
OBV divergence is one of the most reliable predictive signals. When price and OBV move opposite ways, a reversal is building.
Action: When you spot OBV divergence, reduce your position size immediately. Set a tighter stop. Prepare to exit. Don’t wait for price confirmation. OBV already gave you the warning.
Rule 4: Combine OBV with Price Action
OBV alone is not enough. Always confirm OBV signals with price action: support/resistance breaks, trendline breaks, candlestick patterns.
Action: Example: You see bullish OBV divergence. But price hasn’t broken any resistance yet. Wait. Once price breaks resistance, then buy. OBV told you the setup was coming. Price confirmed it’s ready.
Rule 5: Use OBV on Timeframes That Matter
OBV works best on hourly, 4-hour, and daily charts. On 1-min and 5-min charts, OBV is too noisy. On weekly charts, it’s slow. Find your sweet spot.
Action: If you’re a day trader, use hourly and 4-hour OBV. If you’re a swing trader, use 4-hour and daily. If you’re a position trader, use daily and weekly. Match OBV timeframe to your trading timeframe.
OBV Checklist: Before Every Trade
Before you enter any trade, run this checklist:
Pre-Trade OBV Checklist:
- [ ] Is OBV clearly trending? (Up, down, or flat?)
- [ ] If OBV is rising, are you buying or shorting? (Rising OBV supports longs, not shorts)
- [ ] If OBV is falling, are you shorting or buying? (Falling OBV supports shorts, not longs)
- [ ] Is OBV confirming price action? (Price and OBV moving the same direction?)
- [ ] Is there OBV divergence? (Price and OBV moving opposite ways = reversal warning?)
- [ ] Did OBV rise during consolidation before this breakout? (Strong breakout confirmation?)
- [ ] Are volume levels on this breakout higher than average? (Volume confirming?)
- [ ] Have I combined OBV with other indicators? (RSI, MACD, ADX, Bollinger Bands?)
- [ ] Is my stop loss placed below recent support? (In case OBV reverses?)
- [ ] Am I using the right timeframe? (Hourly+ for reliable OBV signals?)
If you answer “no” to any of these questions, reconsider the trade. OBV is telling you something. Listen.
Common OBV Mistakes: What NOT to Do
Mistake 1: Trading OBV as a Standalone Indicator
Many traders buy when OBV is rising and sell when OBV is falling, ignoring price action completely. This fails because OBV is a confirmation tool, not a directional tool.
The fix: Always check price action first. Is price in an uptrend? Is price breaking resistance? Is there a bullish candlestick pattern? Then use OBV to confirm.
Mistake 2: Comparing OBV Across Different Stocks
“Reliance OBV is at +800M, TCS OBV is at +300M, so Reliance is stronger.” Wrong. OBV numbers are meaningless across stocks. Each stock has its own volume levels and OBV baseline.
The fix: Only compare OBV within the same stock over time. Ignore the absolute value. Watch the trend.
Mistake 3: Trading OBV on Micro Timeframes (1-Min, 5-Min)
On 1-minute charts, OBV is extremely noisy. A single large trade can cause wild OBV swings that don’t mean anything. You’ll get whipsawed constantly.
The fix: Use OBV on hourly, 4-hour, and daily charts only. On intraday trading, use hourly minimum. The volume becomes more meaningful at these timeframes.
Mistake 4: Ignoring Divergence Until Price Confirms
Trader sees bearish OBV divergence but price is still making new highs. They ignore it because “price is still up.” Then, 3 days later, price crashes 10%. They say, “Why didn’t OBV warn me?”
It did warn you. You ignored it.
The fix: Act on OBV divergence immediately. Reduce position, set tighter stops, prepare to exit. Don’t wait for price confirmation. OBV is the early warning.
Mistake 5: Using OBV in the Wrong Market Condition
OBV works great in trending markets. It’s terrible in choppy, ranging markets with no clear direction. Traders force OBV signals in range-bound conditions and get hurt.
The fix: Only trade OBV signals when the overall market (Nifty 50, Bank Nifty) is in a clear trend. In choppy conditions, use support/resistance trading instead.
Comparison Table: OBV vs. Volume SMA vs. VWAP vs. Volume Profile
You might be wondering: “Aren’t there other volume indicators? How does OBV compare?”
| Feature | OBV | Volume SMA | VWAP | Volume Profile |
|---|---|---|---|---|
| What It Shows | Cumulative volume (accumulation/distribution) | Average volume over N periods | Price weighted by volume | Volume concentration at price levels |
| Best For | Identifying divergence & accumulation | Confirming breakout volume | Intraday reversal levels | Finding volume nodes & gaps |
| Timeframe | Daily, 4H, 1H (best) | Any | Intraday (1H, 5M) | Intraday, daily (depends on data) |
| Difficulty | Easy to read (trend = direction) | Very easy (simple line) | Moderate (needs context) | Hard to interpret (visual) |
| Reliability | High for trend confirmation | Moderate (lagging indicator) | High for intraday support | Very high (market structure) |
| Best Combined With | Price action, candlesticks, MACD | Bollinger Bands, RSI | Price action, moving averages | Support/resistance levels |
| Use on Indian Stocks | YES (Nifty, Bank Nifty, stocks) | YES | YES | YES (in Zerodha Kite) |
| Platform Support | TradingView, Kite, MotionTrading | All platforms | All platforms | TradingView, Kite (paid) |
Summary: OBV is best for divergence and trend confirmation. Volume SMA is best for confirming breakout volume. VWAP is best for intraday support/resistance. Volume Profile is best for identifying volume nodes.
For most traders, OBV is the go-to volume indicator because divergence signals are the most actionable.
What does the absolute OBV number mean?
Nothing. A stock with OBV at +500M versus another at +50M is meaningless — the scales depend on the stock’s float and history. Only the trend direction matters. Track whether OBV is rising (confirming uptrend) or falling (confirming downtrend) over time.
How do I set up OBV on Zerodha Kite?
Open your chart, click Studies, search for On Balance Volume, and add it. Default settings are fine. Compare the OBV trend with price action. Works best on hourly and above timeframes — intraday 5-min OBV gives too much noise.
Can I use OBV divergence to short stocks?
Yes. Bearish OBV divergence (price making new highs while OBV declines) is one of the strongest reversal signals. Reduce long positions immediately, tighten stops, and consider shorting after confirmation from a support break or bearish candle pattern.
What is the difference between OBV and VWAP?
VWAP is price-weighted and shows intraday support/resistance. OBV is cumulative volume-weighted accumulation/distribution. Use OBV for trend confirmation and divergence signals. Use VWAP for intraday bounce trades and breakout reversals. They complement, not replace, each other.
Why did OBV divergence fail on my Bank Nifty chart?
Divergence often fails in choppy, low-trend-strength markets. Check ADX (above 25 = strong trend). OBV divergence works best when a clear trend exists. False divergences also happen at resistance levels where volume consolidates before the final breakout push.
Your Next Step: Fibonacci Retracements
You’ve now mastered OBV, one of the most powerful volume indicators. You can spot accumulation and distribution. You can identify divergences before price reverses. You can confirm breakouts with volume.
Your next step is to learn Fibonacci Retracements—the next article in our Phase 2 series.
Fibonacci retracements will show you exactly how far a pullback should go before the trend resumes. Combined with OBV, you’ll identify the highest-probability entry points for swing trades and position trades. You’ll know precisely where smart money is likely to buy the dip.
Read the next article: Fibonacci Retracements and take your trading to the next level.
Self-Assessment Quiz
Test the understanding of cumulative volume, divergence, and timeframe selection for OBV.
Test Your Knowledge
Q1: On-Balance Volume (OBV) was created by:
Q2: The absolute OBV number tells you:
Q3: OBV works best on which timeframes?
Q4: The MOST powerful OBV signal is:
Q5: On an up day, OBV:
The Bottom Line on OBV
OBV is the institutional trader’s quiet weapon, exposing accumulation and distribution cycles before price confirms them. For Indian market traders, combining OBV divergence with support/resistance levels and trend confirmation (via ADX or RSI) creates a high-probability setup. Do not trade OBV in isolation — it is a confirmation tool, not a directional indicator. Master it, and you catch breakouts early and avoid the reversals that destroy unprepared traders.
OBV fails in choppy, range-bound markets where volume spikes randomly. Never trade OBV alone; always confirm with price action and another indicator (ADX or RSI). Avoid OBV signals on 1-5 minute intraday charts — too much noise. Use stop losses and proper position sizing on every trade, and never risk more than 1-2% of account on a single idea.
Related Articles
- Volume in Trading — Master the fundamentals of volume analysis
- RSI Basics: Understanding the Relative Strength Index — Combine RSI with OBV for powerful signals
- MACD Basics: Moving Average Convergence Divergence Explained — Use MACD + OBV divergence for reversals
- ADX: Measuring Trend Strength with the Average Directional Index — Confirm trends with ADX + OBV
- ATR: Average True Range — Use ATR for position sizing on OBV breakouts
- Support and Resistance: The Complete Guide — Combine OBV with support/resistance levels
- Bollinger Bands: The Complete Beginner’s Guide — OBV + Bollinger Bands for breakout trading
- Doji and Indecision Patterns — Use Doji patterns with OBV divergence
- Price Action Basics — Combine price action with OBV analysis
- How to Read Stock Charts — The foundation for volume analysis