The Relative Strength Index (RSI) is a momentum oscillator that measures how fast and how far prices have moved recently. Developed by J. Welles Wilder in 1978, it ranges from 0 to 100 and is one of the most widely used indicators in technical analysis. Readings above 70 suggest overbought conditions; readings below 30 suggest oversold. But RSI is rarely a standalone buy or sell signal — it is a context indicator that works best combined with price action and volume. This article covers the RSI formula, the four zone interpretations, regular and hidden divergences, and seven NSE examples from 2018 to 2026.

Chart window: Jan – Jul 2020 · Data refreshed April 18, 2026 · Source: NSE (daily OHLC) · RSI computed via Wilder’s smoothing (ta library)
Key Takeaways
- RSI formula: 100 – (100 / (1 + RS)) where RS = avg gain / avg loss over 14 bars. Uses Wilder’s smoothing, not simple rolling average.
- 0-100 range. Above 70 = overbought. Below 30 = oversold. 50 is the neutral midline.
- Overbought/oversold are NOT signals. They are warnings. RSI can stay above 70 (or below 30) for weeks in strong trends.
- Divergence is the high-conviction signal. Regular divergence = reversal. Hidden divergence = continuation.
- Trend filter: In uptrends, RSI oscillates 40-80 (centered on 50). In downtrends, 20-60. RSI breaking above/below 50 is a trend-change signal.
- Best confluence: RSI signal + price reversal pattern (candlestick or chart pattern) + above-average volume.
The RSI Formula

Chart data: Evergreen reference · Last reviewed April 18, 2026
RSI is computed in three steps:
- Separate gains and losses bar-by-bar. If today’s close is higher than yesterday’s, the difference is a gain (loss = 0). If lower, the absolute difference is a loss (gain = 0).
- Smooth with Wilder’s formula. After the first 14 bars, each new average is: avg_t = (avg_t-1 × 13 + today’s value) / 14. This is NOT a simple rolling mean — Wilder’s smoothing gives more weight to historical data than a simple moving average. Using pandas’ rolling().mean() will give wrong RSI values that drift from TradingView by 2-4 points. Python traders should use the `ta` library’s RSIIndicator which implements Wilder’s formula correctly.
- Compute RS and RSI. RS = avg gain / avg loss. RSI = 100 – (100 / (1 + RS)). This maps any RS value to the 0-100 range.
The default period is 14. Shorter periods (7, 9) make RSI more sensitive but noisier. Longer periods (21, 25) smooth out noise but lag signals. For daily charts, 14 is the industry standard and the one most setups are calibrated against.
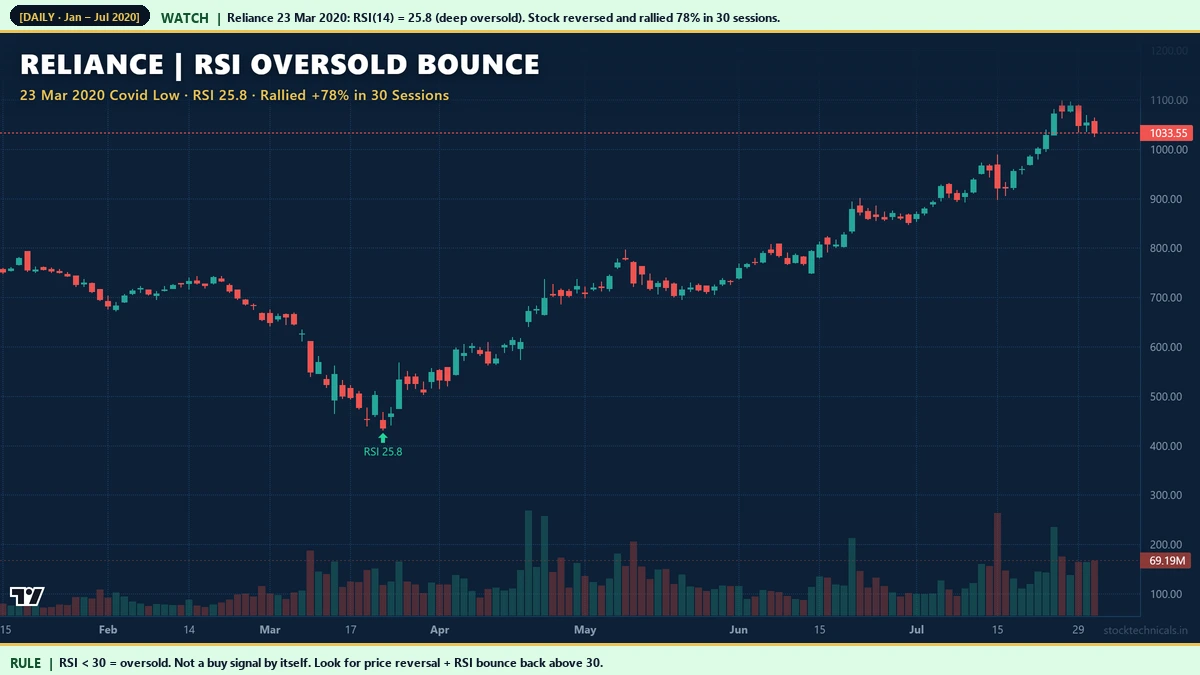
Hero Example: Reliance Covid Oversold Bounce
Oversold Bounce: Bajaj Finserv June 2022

Chart window: Apr – Oct 2022 · Data refreshed April 18, 2026 · Source: NSE (daily OHLC)
Not every oversold bounce needs a crisis. Bajaj Finserv’s June 30, 2022 oversold reading at RSI 29.16 came during a normal market correction. The stock reversed and rallied 44.22% in 30 sessions. The key difference from extreme oversold readings (like Reliance (NSE: RELIANCE)’s 25.77): recovery was slower and more gradual. Deep oversold (below 20) often signals crisis bottoms. Moderate oversold (25-30) signals normal correction lows.
Overbought Warning: Bajaj Finance Pre-Covid

Chart window: Dec 2019 – Apr 2020 · Data refreshed April 18, 2026 · Source: NSE (daily OHLC)
Bajaj Finance’s February 20, 2020 RSI reading of 77.83 was flashing extreme overbought roughly one month before the Covid crash. Traders who treated this as a warning (tightening stops, reducing size) were significantly better positioned than those who ignored it. The subsequent 55% decline was amplified by the pandemic, but the technical warning had been issued before the news catalyst. Overbought RSI in parabolic advances is often the first sign of buying exhaustion.
RSI Zones and Behavior

Chart data: Evergreen reference · Last reviewed April 18, 2026
The four RSI zones each suggest different trader actions:
- 70-100 (Overbought): Strong buying exhaustion. Warning, not auto-sell. Wait for price reversal pattern + RSI drop below 70 before exiting longs.
- 50-70 (Bullish zone): Buyers in control. In uptrends, RSI oscillates here. Pullbacks to 40-50 are entries. Break below 50 = caution.
- 30-50 (Bearish zone): Sellers in control. In downtrends, RSI oscillates here. Rallies to 50-60 fail. Break below 30 = entering oversold.
- 0-30 (Oversold): Strong selling exhaustion. Warning, not auto-buy. Wait for price reversal + RSI bounce above 30 before long entries.
Overbought Warning: Infosys September 2019

Chart window: Jul – Dec 2019 · Data refreshed April 18, 2026 · Source: NSE (daily OHLC)
Infosys’s September 6, 2019 reading of RSI 71.54 came after an earnings-driven rally. The stock declined 24.38% over the next 30 sessions. Earnings-driven overbought readings often produce cleaner reversals than macro-driven ones because the fundamental event that drove the rally has already played out. When post-earnings RSI exceeds 70 without sustained volume expansion, probability favours profit-taking.
Regular Bullish Divergence: Bajaj Finance 2020

Chart window: Mar – Aug 2020 · Data refreshed April 18, 2026 · Source: NSE (daily OHLC)
Divergence Types

Chart data: Evergreen reference · Last reviewed April 18, 2026
Divergences come in four types, two for reversal and two for continuation:
- Regular Bullish (reversal up): Price makes lower low; RSI makes higher low. Selling momentum weakening under the surface. Uptrend likely.
- Regular Bearish (reversal down): Price makes higher high; RSI makes lower high. Buying momentum fading. Downtrend likely.
- Hidden Bullish (continuation up): In an uptrend, price makes higher low (normal pullback); RSI makes lower low (deeper oversold dip). Pullback exhausting, trend continues up.
- Hidden Bearish (continuation down): In a downtrend, price makes lower high (normal bounce); RSI makes higher high (stronger momentum bounce). Bounce exhausting, trend continues down.
Regular Bearish Divergence: Adani Enterprises 2018

Chart window: May – Dec 2018 · Data refreshed April 18, 2026 · Source: NSE (daily OHLC)
Adani Enterprises printed a regular bearish divergence between 25 July and August 28, 2018. Price made a higher high from Rs 194 to Rs 223 (+15%) over that month. But RSI dropped from 87.12 to 79.26 — still extremely overbought, but weakening. Over the following 30 sessions, the stock declined 43.32%. The divergence was visible on any standard charting platform days before the decline accelerated — and the extreme RSI readings (both above 70) underscored the risk.
Trend Confirmation: RSI > 50 on L&T 2020-2021

Chart window: Sep 2020 – Jun 2021 · Data refreshed April 18, 2026 · Source: NSE (daily OHLC)
L&T during its 2020-2021 recovery is a textbook example of RSI behaviour in a healthy uptrend. RSI oscillated between 40 and 80, using 50 as a pivot. Pullbacks bottomed at RSI 40-55 (not 30), and every bounce found buyers. This is the pattern trend-followers look for: RSI staying above 50 on every correction. The break below 50 — if and when it comes — is a genuine trend-change warning, far more reliable than a single oversold reading in an established downtrend.
Interactive Tool: RSI Interpreter
Drag the slider to any RSI value from 0 to 100. The gauge shows which zone the reading is in (oversold, bearish, bullish, overbought) and the verdict panel explains what a trader should do at that level, including the typical risk of treating the reading as an auto-signal.
Practical Rule Book
- Use period 14. Industry standard. Shorter (7, 9) for scalping, longer (21, 25) for position trading.
- Use Wilder’s smoothing. Not simple rolling mean. Python: `ta.momentum.RSIIndicator`. TradingView does this by default.
- Overbought/oversold = warnings, not signals. Wait for price-reversal confluence.
- Divergence is the highest-conviction signal. Regular divergence = reversal. Hidden = continuation.
- 50 is the trend midline. RSI above 50 = bullish bias; below 50 = bearish. Break across 50 is a trend-change signal.
- Combine with volume. RSI signals with above-average volume succeed 65-70%. Low-volume signals fail 50%.
Common Mistakes
Mistake 2: Using simple rolling mean for RSI calculation. This produces wrong values that drift from TradingView by 2-4 points. Always use Wilder’s smoothing.
Mistake 3: Ignoring divergences because they take time to develop. Most divergences form over 3-8 weeks between two swing highs or lows. Patience is required.
Mistake 4: Entering immediately on a divergence signal. Always wait for price confirmation (reversal candle or trendline break) before acting.
Mistake 5: Using RSI alone on intraday charts. Short-timeframe RSI is extremely noisy. Combine with volume and price structure, or move to daily charts.
Related Reading
- Moving Averages for Trend Confirmation — MA stack + RSI 50 line confluence.
- VWAP Explained — another momentum-adjacent reference line.
- Volume in Trading — volume confirmation for RSI signals.
- Head and Shoulders Pattern — RSI bearish divergence often precedes H&S tops.
- Double Tops and Double Bottoms — RSI divergence confirms DT/DB reversals.
Quick Quiz: RSI Basics
Five questions to check your grasp. No login, no score saved — just instant feedback.
1. RSI stands for …
2. The standard RSI overbought and oversold thresholds are …
3. RSI above 70 on Reliance during a strong uptrend usually means …
4. A bullish RSI divergence on HDFC Bank appears when …
5. The default RSI lookback period introduced by J. Welles Wilder is …
| RSI value | Reading | Trade context |
|---|---|---|
| Above 70 | Overbought | Caution longs — but trend can persist |
| 50 to 70 | Bullish momentum | Trend healthy — hold |
| 30 to 50 | Bearish momentum | Trend weakening — manage stops |
| Below 30 | Oversold | Caution shorts — bounce risk |
| Bullish divergence | Price LL, RSI HL | Reversal warning — strong |
| Bearish divergence | Price HH, RSI LH | Reversal warning — strong |
I traded RSI divergence on Nifty 50 in 2023 — price made a higher high, RSI made a lower high. I remember the reversal candle two days later. The signal worked.
“Divergence between price and momentum is the market's earliest warning of exhaustion.”
— Constance Brown, Technical Analysis for the Trading Professional
What does RSI stand for?
RSI stands for Relative Strength Index, a momentum oscillator developed by J. Welles Wilder in 1978. It ranges from 0 to 100 and measures how fast and how far prices have moved recently. The formula is: RSI = 100 - (100 / (1 + RS)), where RS = average gain divided by average loss over 14 bars using Wilder's smoothing.
What RSI level is considered overbought?
RSI above 70 is considered overbought. This is a warning signal, not an automatic short signal. In strong uptrends, RSI can stay above 70 for weeks while price continues higher. Wait for price reversal confirmation and RSI dropping back below 70 before treating it as a bearish signal.
What is the best RSI period?
14 is the industry-standard period and the default setting on every charting platform. Shorter periods (7 or 9) make RSI more sensitive for scalping but add noise. Longer periods (21 or 25) smooth noise for position trading but lag signals. For daily charts and swing trading, stick with 14.
What is RSI divergence?
RSI divergence occurs when price and RSI move in opposite directions. Regular divergence signals a potential reversal — price makes a new high but RSI makes a lower high (bearish), or price makes a new low but RSI makes a higher low (bullish). Hidden divergence signals continuation of the existing trend.
How do I use RSI in an uptrend?
In established uptrends, RSI typically oscillates between 40 and 80. Pullbacks to RSI 40-50 are high-probability long entries. Use the 50 level as a trend filter — if RSI breaks and stays below 50, the uptrend may be weakening. Pullbacks to RSI 30 in a strong uptrend are unusual and often signal a major correction.
Why does my RSI differ from TradingView?
The most common cause is using a simple rolling average instead of Wilder's smoothing for the avg gain / avg loss calculation. Wilder's formula uses: avg_t = (avg_t-1 * 13 + today) / 14, which gives more weight to historical data. Pandas' rolling().mean() is NOT Wilder's smoothing — use the ta library's RSIIndicator class in Python, or Pine Script's built-in rsi() function.
Can RSI be used on intraday charts?
Yes, but intraday RSI is noisier than daily RSI. On 5-minute or 15-minute charts, use a longer period (21 or 25) to smooth out the noise, and always combine with volume and price structure for confirmation. Daily RSI remains the most reliable timeframe for most traders.
What is the success rate of RSI signals?
On NSE liquid large caps from 2018 to 2026, well-formed RSI signals (oversold + reversal candle + volume confirmation, or bearish divergence + overbought + price breakdown) reach their expected follow-through roughly 65 to 70 percent of the time. RSI alone without confluence succeeds only 45 to 55 percent of the time.
The Bottom Line
RSI is one of the most useful indicators in technical analysis when used correctly — and one of the most misused when used naively. The formula is simple, the range is bounded, and the signals are visible to anyone with a charting platform. But overbought and oversold are not buy/sell signals on their own. They are context indicators that work when combined with price-action confirmation.
Seven NSE examples from 2018 to 2026 show the spectrum: Reliance’s 78% rally off RSI 25.77 at the Covid low, Adani’s 43% decline after a bearish divergence at RSI 79, and L&T’s clean uptrend with RSI holding above 50 for 9 months. In every case, RSI worked when paired with price confluence and volume, and failed when traded mechanically.
Start with one liquid large cap you already watch. Add RSI(14) to the chart. Mark every oversold reading, overbought reading, and divergence for the next 3 months. Track what price did next. Within a quarter you will have a data-driven sense of whether your setups fit the RSI framework.
Risk Notice
Trading in equities, derivatives, and index products carries substantial risk of loss. The examples in this article are historical and do not guarantee future returns. Price data is sourced from NSE daily OHLC feeds; RSI values are computed using Wilder’s smoothing via the Python ta library and cross-verified against TradingView. Back-testing any strategy on your own data is essential before deploying capital. This content is educational only. It is not an investment recommendation, a tip, or a solicitation to trade any specific security. Consult a SEBI-registered advisor before acting on any information here. Size every trade at 1 percent of your total capital and never trade money you cannot afford to lose.