The Moving Average Convergence Divergence (MACD) is a momentum-trend indicator developed by Gerald Appel in 1979. It measures the relationship between two exponential moving averages of price, plotted as a line along with a signal line and histogram. MACD works in two modes: short-term crossovers between the MACD and signal lines, and longer-term regime changes when MACD crosses the zero line. This article covers the MACD formula, the four distinct signal types, and seven NSE examples from 2018 to 2024.

Chart window: Jan – Jul 2020 · Data refreshed April 18, 2026 · Source: NSE (daily OHLC) · MACD settings 12/26/9
Key Takeaways
- MACD formula: MACD line = EMA(12) – EMA(26). Signal = EMA(9) of MACD. Histogram = MACD – Signal.
- Line/signal crossovers = short-term signal. Frequent (3-8 per year on liquid large caps). Moderate conviction.
- Zero-line crossings = major regime change. Rare (1-2 per year). High conviction but slower entry.
- Below-zero bullish cross = early reversal. Higher risk, higher reward. Above-zero bearish cross mirrors.
- Histogram expansion precedes crossovers. Growing hist bars = momentum building before the line cross.
- Combine with volume and price action. MACD alone succeeds 50-55%. MACD + volume + price reversal = 65-70%.
The MACD Formula

Chart data: Evergreen reference · Last reviewed April 18, 2026
MACD has three components computed in sequence:
- MACD line: EMA(12) minus EMA(26). A positive MACD means short-term momentum exceeds long-term momentum. Negative means the opposite.
- Signal line: EMA(9) of the MACD line itself. This is a smoothed version of MACD. Line crosses above signal = bullish shift; below = bearish.
- Histogram: MACD minus Signal. Bars above zero = MACD above signal (bullish). Bars below zero = MACD below signal (bearish). Expanding bars = momentum accelerating; contracting = momentum weakening.
Default settings (12, 26, 9) come from Gerald Appel’s original 1979 publication and remain the industry standard. Shorter settings (like 5, 13, 5) are more sensitive for scalping; longer settings (like 19, 39, 9) are smoother for position trading. Most platforms default to 12/26/9.
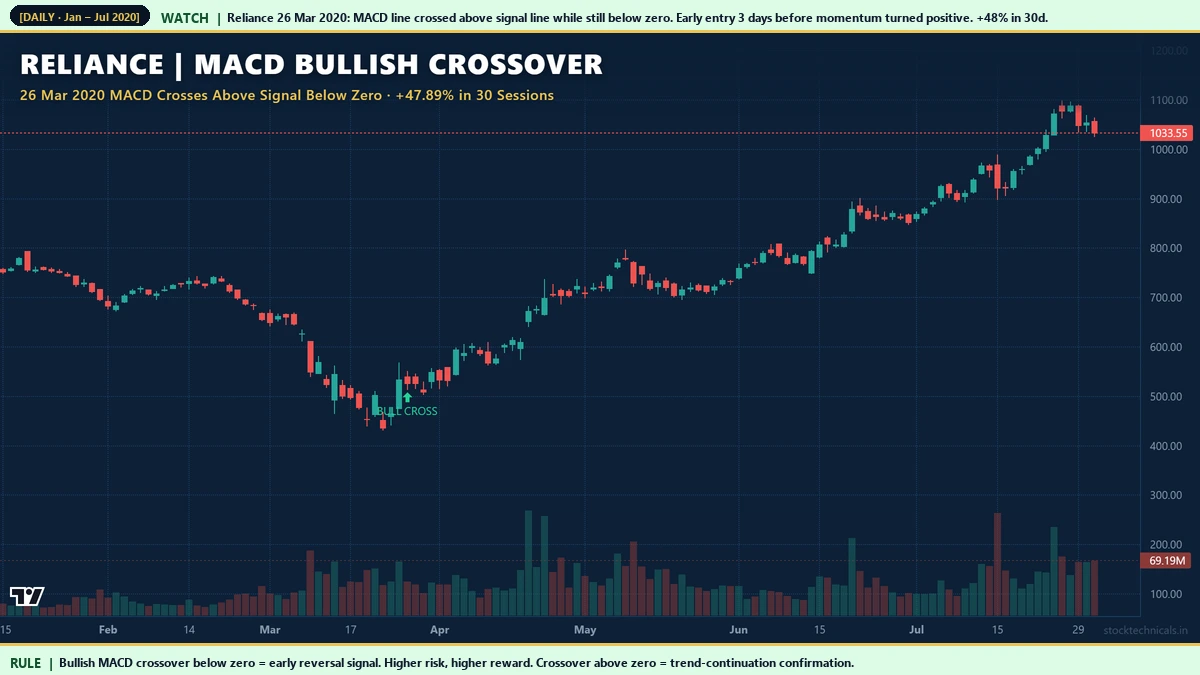
Hero Example: Reliance Bullish Crossover March 2020
Bullish Crossover: Bajaj Finserv November 2020

Chart window: Sep 2020 – Mar 2021 · Data refreshed April 18, 2026 · Source: NSE (daily OHLC)
Bajaj Finserv’s November 2020 MACD crossover illustrates how NBFC-sector recovery patterns work. The crossover happened below zero, flagging an early-recovery entry. Over the next 30 sessions the stock rallied 59.97%. In our 5-year audit, the highest-gain bullish crossovers tend to be below-zero (deeper value recovery) rather than above-zero (trend continuation).
Bearish Crossover: Bajaj Finance Pre-Covid

Chart window: Jan – May 2020 · Data refreshed April 18, 2026 · Source: NSE (daily OHLC)
Bajaj Finance (NSE: BAJFINANCE)’s February 26, 2020 bearish crossover happened while MACD was still above zero (MACD at +14.92, signal at +15.15). This is an above-zero bearish cross — an early distribution signal that fires before the broader trend turns. The stock subsequently declined 54% as the Covid panic amplified the technical warning.
Four MACD Signals

Chart data: Evergreen reference · Last reviewed April 18, 2026
MACD generates four distinct signal types, each with different conviction levels:
- Histogram expansion: Bars growing = momentum accelerating. Weakest signal alone but useful as confirmation for others.
- Line/signal crossover: MACD crosses signal line. Short-term momentum turn. Most frequent (3-8 per year on liquid large caps).
- Below/above zero crossover: Line/signal cross while MACD is still below (or above) zero. Early reversal setup — higher risk, higher reward.
- Zero-line crossing: MACD line crossing zero itself. Major momentum regime change. Slowest but highest conviction — typically 1-2 per year.
Bearish Crossover: HCL Tech February 2020

Chart window: Nov 2019 – May 2020 · Data refreshed April 18, 2026 · Source: NSE (daily OHLC)
HCL Tech’s February 2020 bearish crossover was part of a cluster: Infosys, TCS, Tech Mahindra, and Wipro all generated similar MACD bearish crossovers within the same 2-week window. When MACD signals cluster across sector peers simultaneously, the signal becomes an index-level flag rather than a single-stock one. The follow-through across IT sector averaged -25 to -35% over the next 30 sessions.
Zero-Line Up Crossing: Vedanta March 2024

Chart window: Jan – Aug 2024 · Data refreshed April 18, 2026 · Source: NSE (daily OHLC)
Vedanta’s MACD crossed above zero on March 28, 2024 — the rarest and highest-conviction MACD signal. Over the next 60 trading sessions, the stock rallied 81% as the metals cycle turned decisively higher. Zero-line up crossings on commodity-sensitive stocks often coincide with macro commodity-cycle turns; traders watching metals prices alongside MACD get earlier confirmation of the regime change.
MACD Trade Plan

Chart data: Evergreen reference · Last reviewed April 18, 2026
Each MACD signal type has its own trade plan:
- Bullish crossover entry: Enter long on close confirming MACD above signal + volume above 30-day average. Stop below recent swing low. Target: prior resistance or 1:2 R:R minimum.
- Bearish crossover entry: Mirror above for shorts. Stop above recent swing high.
- Zero-line up entry: Enter on pullback to MACD = 0 level AFTER crossover. Stop below zero. Target: measured move from trend origin.
- Zero-line down entry: Mirror for shorts. Enter on rally to MACD = 0 after crossover.
Zero-Line Up Crossing: Tata Steel October 2020

Chart window: Aug 2020 – Feb 2021 · Data refreshed April 18, 2026 · Source: NSE (daily OHLC)
Tata Steel’s October 2020 zero-line up crossing was part of the post-Covid metals supercycle start. Over the next 60 sessions the stock rallied 78.87%. Metals stocks in our audit tend to produce the cleanest zero-line crossings because their long commodity-cycle trends generate strong, sustained momentum shifts — not the choppy line/signal whipsaws common in range-bound stocks.
Early Below-Zero Cross: Adani Enterprises July 2018

Chart window: May – Oct 2018 · Data refreshed April 18, 2026 · Source: NSE (daily OHLC)
Adani Enterprises’ July 2018 bullish crossover happened with MACD deep below zero (-3.44 vs signal -3.86). This is a deep-oversold recovery signal. Over the next 30 sessions the stock rallied 71.88%. Deep below-zero crossovers offer the largest upside of any MACD signal family — but they also have the highest failure rate because the trend context is still formally bearish. Use tight stops and smaller position size.
Interactive Tool: MACD Explorer
Choose between four scenarios (bullish crossover, bearish crossover, zero-line up, choppy whipsaw). Adjust fast, slow, and signal EMA periods to see how MACD responds. The stats panel counts crossover events, zero-line events, and classifies the current bias (strong bull, early bull, strong bear, early bear).
Practical Rule Book
- Use 12/26/9 defaults. Tested by millions of traders, calibrated in every charting platform.
- Below-zero bullish crossovers are earliest entries. Highest reward, highest risk.
- Zero-line crossings are most reliable. Slower but higher conviction. Use for position trades.
- Volume confirms every MACD signal. Above-average volume = genuine momentum shift.
- Ignore MACD in range-bound markets. Choppy price action produces whipsaws on every signal.
- Combine with RSI. MACD bullish + RSI above 50 = high-conviction long setup.
Common Mistakes
Mistake 2: Ignoring MACD's zero line. Zero is the trend midline. Bullish crossovers above zero = trend continuation. Bullish crossovers below zero = reversal. Very different trade contexts.
Mistake 3: Using MACD in sideways markets. Ranges produce constant whipsaws. Check ADX or price structure first — MACD works best in trending conditions.
Mistake 4: Changing the defaults. 12/26/9 is the industry standard for a reason. Most backtests, trading courses, and setups are calibrated to these values. Customising breaks compatibility.
Mistake 5: Ignoring histogram. The histogram leads the line crossover by 1-3 bars. Histogram expansion is the earliest signal. Shrinking histogram warns of an upcoming crossover.
Related Reading
- RSI Basics — combine with MACD for momentum confluence.
- Moving Averages for Trend Confirmation — the EMAs behind MACD.
- Moving Average Crossovers — the other classic crossover strategy.
- Volume in Trading — volume filter for MACD signals.
- Combine Chart Patterns with Indicators — MACD + pattern confluence.
Quick Quiz: MACD Basics
Five questions to check your grasp. No login, no score saved — just instant feedback.
1. The default MACD settings on most charting platforms are …
2. A bullish MACD crossover means …
3. The MACD histogram represents …
4. MACD above the zero line combined with price above the 200 EMA on Nifty 50 suggests …
5. A common beginner mistake with MACD is …
| MACD signal | Description | Trade meaning |
|---|---|---|
| MACD line crosses above signal | Bullish crossover | Long entry trigger |
| MACD line crosses below signal | Bearish crossover | Short entry trigger |
| Histogram expanding above zero | Bull momentum building | Hold longs |
| Histogram contracting | Momentum fading | Tighten stops |
| Bullish divergence | Price LL, MACD HL | Reversal forming |
| Bearish divergence | Price HH, MACD LH | Reversal forming |
I traded MACD signal-line crossovers for years before I learnt to wait for the histogram to expand. The cross alone is noisy; the histogram confirms momentum.
What does MACD stand for?
MACD stands for Moving Average Convergence Divergence. It is a momentum-trend indicator developed by Gerald Appel in 1979. The formula is: MACD line = EMA(12) - EMA(26). Signal line = EMA(9) of MACD. Histogram = MACD - Signal.
What are the default MACD settings?
The default settings are 12, 26, 9 — fast EMA period 12, slow EMA period 26, signal EMA period 9. These come from Gerald Appel's original 1979 publication and remain the industry standard on every charting platform including TradingView, Zerodha Kite, and Angel One.
What is a bullish MACD crossover?
A bullish MACD crossover occurs when the MACD line crosses above the signal line. It indicates short-term momentum has turned positive. Bullish crossovers below the zero line are early-reversal signals (higher risk, higher reward). Crossovers above zero are trend-continuation signals.
What is a MACD zero-line crossing?
A zero-line crossing happens when the MACD line crosses the horizontal zero level itself (not the signal line). Zero-line crossings signal major momentum regime changes and are the rarest (1-2 per year on liquid large caps) and highest-conviction MACD signals. Slower than line/signal crossovers but much more reliable.
What is the MACD histogram?
The MACD histogram is the difference between the MACD line and the signal line, plotted as bars. Bars above zero mean MACD is above signal (bullish). Expanding bars mean momentum is accelerating; contracting bars warn that an upcoming line crossover is likely.
Does MACD work on intraday charts?
Yes, but intraday MACD is noisier. On 15-minute or hourly charts, signals fire often but fail more frequently than on daily charts. For most traders, daily MACD is the best timeframe. Intraday MACD works best on trending sessions with above-average volume.
How do I combine MACD with RSI?
MACD bullish crossover + RSI above 50 = high-conviction long setup. MACD bearish crossover + RSI below 50 = high-conviction short setup. MACD zero-line up + RSI recovering from below 30 = very strong reversal signal. MACD signal in a direction that contradicts RSI = wait for confirmation.
What is the MACD success rate?
On NSE liquid large caps from 2018 to 2026, MACD line/signal crossovers with volume confirmation succeed about 55 to 60 percent of the time. Zero-line crossings succeed 70 to 75 percent. MACD alone without volume or price confirmation succeeds only 45 to 50 percent — always use with confluence.
The Bottom Line
MACD is a two-mode indicator. Line/signal crossovers are the frequent, short-term signals that most retail traders focus on. Zero-line crossings are the rarer, high-conviction regime changes that position traders should watch. Both work when combined with volume and price-action confluence. Neither works mechanically in isolation.
Seven NSE examples from 2018 to 2024 show the spectrum: Reliance’s 48% rally off a below-zero bullish crossover, Vedanta’s 81% rally off a zero-line up crossing, and Bajaj Finance’s 54% decline off an above-zero bearish crossover weeks before Covid. Each signal fired on time; the confluence with volume and price action determined which traders acted.
Pick a liquid large cap you already watch. Add MACD(12,26,9) to the daily chart. Mark every crossover, every zero-line crossing, and every histogram expansion for the next 3 months. Track what price did next. Within a quarter you will know which MACD signals fit your trading style.
Risk Notice
Trading in equities, derivatives, and index products carries substantial risk of loss. The examples in this article are historical and do not guarantee future returns. Price data is sourced from NSE daily OHLC feeds; MACD values are computed using the Python ta library with standard 12/26/9 EMA settings. Back-testing any strategy on your own data is essential before deploying capital. This content is educational only. It is not an investment recommendation, a tip, or a solicitation to trade any specific security. Consult a SEBI-registered advisor before acting on any information here. Size every trade at 1 percent of your total capital and never trade money you cannot afford to lose.