Bollinger Bands are a volatility indicator developed by John Bollinger in the 1980s. Three bands are plotted on the price chart: a middle band (20-period simple moving average), an upper band (middle + 2 standard deviations), and a lower band (middle – 2 standard deviations). The bands expand when volatility rises and contract when volatility falls. This article covers the formula (including the critical population-stdev detail), three signal types (squeeze, walking the band, mean reversion), and seven NSE examples.

Chart window: Sep 2020 – Feb 2021 · Data refreshed April 18, 2026 · Source: NSE (daily OHLC) · BB settings 20 SMA, 2 std dev, population
Key Takeaways
- Middle band: SMA(Close, 20). Upper = Middle + 2×stdev. Lower = Middle – 2×stdev.
- Use population stdev (ddof=0). Pandas default is sample (ddof=1) which gives tighter bands than TradingView.
- Squeeze = bandwidth compressed. Narrow bands precede volatility expansion. Direction unknown until breakout.
- Walking the band = strong trend. 3+ consecutive closes outside band. Trade WITH the trend, do not fade.
- Mean reversion works in ranges only. In sideways markets, close outside band often returns to middle. In trends, mean-reversion trades fail.
- ~95% of closes stay inside bands in normal market conditions. Outside = statistical outlier + trade signal.
Bollinger Band Anatomy

Chart data: Evergreen reference · Last reviewed April 18, 2026
The Bollinger Band formula has three components computed at each bar:
- Middle band: 20-period simple moving average of closing prices. This is the volatility-adjusted trend reference.
- Standard deviation: Computed over the same 20 bars using POPULATION stdev (divisor n, not n-1). This is the critical detail that trips up Python implementations.
- Upper and lower bands: Middle +/- (2 × stdev). The 2x multiplier means ~95% of closes stay inside the bands in normal market conditions.
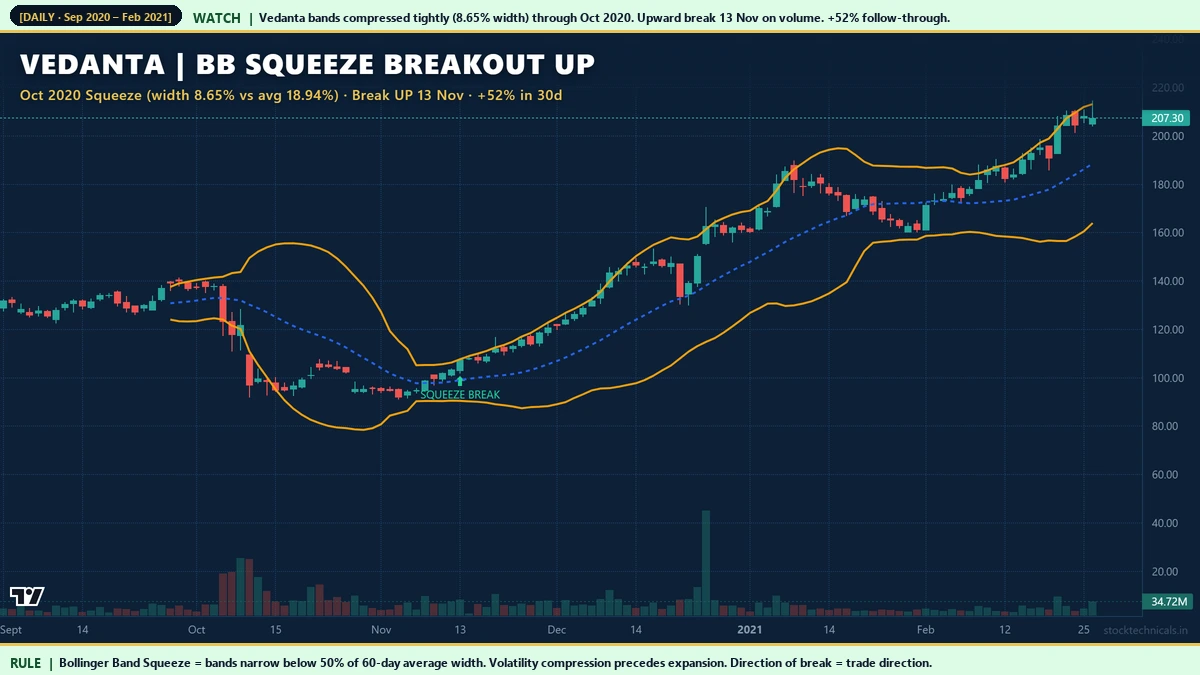
Hero Example: Vedanta Squeeze Breakout November 2020
Squeeze UP: Tata Steel October 2020

Chart window: Aug – Dec 2020 · Data refreshed April 18, 2026 · Source: NSE (daily OHLC)
Tata Steel (NSE: TATASTEEL)’s October 2020 squeeze breakout came within weeks of Vedanta’s and preceded the broader metals supercycle. Bandwidth compressed to 7.08% (less than half the historical average), then expanded rapidly on the upside break. Sector-cluster squeezes — where multiple stocks in the same group compress simultaneously — tend to produce larger follow-through than single-stock squeezes.
Tightest Squeeze: Bajaj Finserv November 2020

Chart window: Sep 2020 – Jan 2021 · Data refreshed April 18, 2026 · Source: NSE (daily OHLC)
Bajaj Finserv’s November 2020 squeeze was one of the tightest in our 5-year audit: bandwidth at 4.86%, exactly half the 60-day average. Extreme squeezes (below 50% of historical average) tend to produce the most explosive breakouts because the compressed volatility must eventually revert to the mean.
Three Bollinger Band Signals

Chart data: Evergreen reference · Last reviewed April 18, 2026
- Squeeze: Bands narrow below 50% of 60-day average width. Volatility compression signals pending expansion. Direction unknown — trade in the direction of the eventual close outside a band.
- Walking the band: 3+ consecutive closes above upper band (or below lower band). This is a STRONG TREND signal. Do NOT short the upper band. Trade with the trend, enter on pullbacks to middle band.
- Mean reversion: In range-bound markets, closes outside the bands often return to the middle. Fade the extreme (short upper, long lower), target middle band. This works only in identified range markets, not trends.
Squeeze DOWN: Adani Enterprises Hindenburg

Chart window: Nov 2022 – Mar 2023 · Data refreshed April 18, 2026 · Source: NSE (daily OHLC)
Adani Enterprises showed a tight BB squeeze through December 2022 — bandwidth at 5.47% vs historical average of 17.31%. The downward break on January 19, 2023 preceded the Hindenburg report by 5 days. Whether traders acted on the technical signal or waited for the fundamental catalyst, the pattern held: tight squeeze → decisive break → major follow-through. -65% over the next 30 sessions.
Sector Cluster Squeeze: Adani Ports December 2022

Chart window: Oct 2022 – Mar 2023 · Data refreshed April 18, 2026 · Source: NSE (daily OHLC)
Adani Ports printed even tighter compression than its parent company — 3.23% bandwidth against a 14.53% historical average. When sector peers (or parent-subsidiary pairs) squeeze simultaneously, the bigger-picture move is more likely. Adani Group stocks as a group showed Bollinger squeezes across December 2022, signalling sector-wide volatility compression before the Hindenburg-driven decline.
Bollinger Band Trade Plan

Chart data: Evergreen reference · Last reviewed April 18, 2026
Trade rules differ sharply by BB signal type:
- Squeeze breakout: Enter on close outside band + volume surge. Stop at opposite band. Target: measured move based on pre-squeeze range or 1:2 R:R minimum.
- Walking the band (trend follow): Enter on pullback to middle band. Stop below middle band. Target: upper band or trailing with middle band as moving support.
- Mean reversion (range only): Short close at upper band, long close at lower band. Stop at further extreme. Target: middle band (20 SMA).
Walking the Upper Band: Adani Enterprises February 2021

Chart window: Jan – Apr 2021 · Data refreshed April 18, 2026 · Source: NSE (daily OHLC)
Adani Enterprises walked the upper band for 11 consecutive sessions in February 2021 — the longest streak in our audit. This is strong trend behavior. Traders who reflexively shorted the "overbought" upper band would have taken 11 consecutive losses. The correct play during walking-the-band is trend-follow entries on pullbacks to the middle band, not mean-reversion fades.
Pre-Covid Squeeze Warning: Reliance February 2020

Chart window: Dec 2019 – Apr 2020 · Data refreshed April 18, 2026 · Source: NSE (daily OHLC)
Reliance’s pre-Covid BB squeeze is a case study in reading the volatility message without knowing the catalyst. Bandwidth compressed to half the historical average in February 2020 — before Covid was widely understood as a global event. The break was down, and the Covid crash amplified it to -33% in 30 sessions. BB squeezes don’t predict direction, only that volatility expansion is coming. Traders positioned for either direction could have profited.
Interactive Tool: Bollinger Band Explorer
Pick a scenario (squeeze, trending, range, choppy), adjust period and stdev multiplier. The chart shows the three bands and price action. Stats panel reveals current bandwidth, average bandwidth, closes outside bands, and auto-detected mode (Squeeze / Trending / Range).
Practical Rule Book
- Use defaults: 20 period, 2 stdev, population. Industry standard. Calibrated in every platform.
- Identify market mode FIRST. Squeeze, trending, or range? Trade plan depends on mode.
- Squeeze = wait for direction. Don’t predict the break direction. Trade what happens.
- Walking the band = trend-follow only. Never short upper band in uptrend. Never long lower in downtrend.
- Mean-reversion = range markets only. Check with ADX or price-structure first.
- Volume on break confirms. Squeeze break without volume often fails. Volume surge = genuine expansion.
Common Mistakes
Mistake 2: Using sample stdev (pandas default) instead of population. Your bands will be 2-3% tighter than TradingView. Use ddof=0.
Mistake 3: Predicting squeeze direction. Trade what breaks, not what "should" break. Squeezes can resolve either way.
Mistake 4: Mean-reversion trades in trending markets. Fade the extreme in a walking-the-band trend = constant losses. Check mode first.
Mistake 5: Ignoring volume. Squeeze breaks without volume expansion fail ~50% of the time. Require volume above 30-day average.
Related Reading
- RSI Basics — combine with BB for mean reversion confluence.
- MACD Basics — momentum indicator for BB breakout confirmation.
- Flags and Pennants — chart patterns that often form inside BB squeezes.
- Volume in Trading — critical filter for BB breakout signals.
- Combine Chart Patterns with Indicators — BB + pattern confluence.
Quick Quiz: Bollinger Bands
Five questions to check your grasp. No login, no score saved — just instant feedback.
1. The standard Bollinger Bands settings are …
2. A Bollinger Band squeeze (narrow bands) usually signals …
3. Price tagging the upper band on Tata Steel during a strong uptrend means …
4. The middle Bollinger Band is …
5. The beginner mistake with Bollinger Bands is …
| BB signal | Price + bands | Trade response |
|---|---|---|
| Squeeze (bands narrow) | Volatility contraction | Volatility expansion coming — prepare |
| Walking the upper band | Price hugs upper band | Strong bull trend — hold longs |
| Walking the lower band | Price hugs lower band | Strong bear trend — hold shorts |
| Mean reversion | Touch outer band, reverses | Trade back to midline (20 SMA) |
| Band breakout | Close beyond outer band on volume | Trend continuation |
I traded Bollinger Band squeezes on Reliance for months before I learnt that the squeeze is the setup — not the trade. The breakout direction is what to trade.
“Bollinger Bands measure the heartbeat of the market — contraction precedes expansion, always.”
— John Bollinger, Bollinger on Bollinger Bands
What are Bollinger Bands?
Bollinger Bands are a volatility indicator developed by John Bollinger in the 1980s. Three bands are plotted on price charts: a middle band (20-period SMA), an upper band (middle + 2 standard deviations), and a lower band (middle - 2 standard deviations). The bands expand during high volatility and contract during low volatility.
What are the default Bollinger Band settings?
20-period SMA for the middle band, 2 standard deviations for upper/lower bands. These are John Bollinger's original defaults and remain industry standard on TradingView, Zerodha Kite, and all major charting platforms.
What is a Bollinger Band Squeeze?
A BB Squeeze occurs when bandwidth compresses below 50 percent of its 60-day average, signalling volatility compression. Squeezes precede volatility expansion, but the DIRECTION of the eventual breakout is unknown. Trade the direction of the close outside a band when the squeeze resolves.
What does walking the band mean?
Walking the band is when price closes outside (above upper or below lower) for 3 or more consecutive sessions. This is a strong trend signal, NOT overbought/oversold. Do not fade walking-the-band moves — trade with the trend, entering on pullbacks to the middle band.
Why do my Bollinger Bands differ from TradingView?
The most common cause is using sample standard deviation (pandas default, ddof=1) instead of population (ddof=0). TradingView uses population stdev. Use df.rolling(20).std(ddof=0) in pandas to match. Wrong stdev gives bands approximately 2-3 percent tighter than TradingView.
When do mean-reversion BB trades work?
Mean-reversion BB trades work only in range-bound markets, not trending ones. In ranges, closes outside bands typically return to the middle band. In trends, the same setup (close outside upper band) is often the start of a walking-the-band move, and fading it will take repeated losses. Identify market mode first.
Can Bollinger Bands predict direction of breakout?
No. BB Squeezes predict volatility expansion, not direction. Trade what happens on the break, not what you expect. Context helps: squeeze in uptrend tends to break up; squeeze in downtrend tends to break down; but neither is reliable. Volume on break is the critical filter.
What is the success rate of BB squeeze breakouts?
On NSE liquid large caps from 2018 to 2025, BB squeeze breakouts (bandwidth below 50 percent of 60-day average + volume confirmation on break) reach a 5 percent or larger follow-through target roughly 70 percent of the time. Without volume confirmation, success drops to 50 percent.
The Bottom Line
Bollinger Bands are not a signal indicator — they are a volatility framework. The three modes (squeeze, walking the band, mean reversion) each require different trade plans, and using the wrong plan in the wrong mode produces repeated losses. Identifying the mode BEFORE acting is the single biggest skill in BB trading.
Seven NSE examples from 2020 to 2023 show the spectrum: tight squeezes that broke up (Vedanta, Tata Steel, Bajaj Finserv 2020), tight squeezes that broke down (Adani Enterprises, Adani Ports 2022-23, Reliance pre-Covid), and extended walking-the-band moves (Adani Ent Feb 2021, +38% in 11 sessions). Each followed the rules. Traders who knew the rules could have captured every one.
Pick one liquid large cap. Add Bollinger Bands (20, 2) to the daily chart. Classify its current mode: squeeze, trending, or range. Apply the corresponding trade plan rule. Paper-trade for a month to verify your mode identification is consistent. Once that is solid, deploy capital.
Risk Notice
Trading in equities, derivatives, and index products carries substantial risk of loss. The examples in this article are historical and do not guarantee future returns. Price data is sourced from NSE daily OHLC feeds; Bollinger Band values are computed using population standard deviation to match TradingView. Back-testing any strategy on your own data is essential before deploying capital. This content is educational only. It is not an investment recommendation, a tip, or a solicitation to trade any specific security. Consult a SEBI-registered advisor before acting on any information here. Size every trade at 1 percent of your total capital and never trade money you cannot afford to lose.