Supertrend is a trend-following indicator that combines Average True Range (ATR) with a dynamic trailing line. It plots as a single line on the chart: green below price in uptrends, red above price in downtrends. When price closes through the line, the trend flips and the line switches colour and position. Supertrend doubles as an automated trailing stop-loss, which is why many swing traders rely on it for position management. This article covers the formula (including the critical band-reset logic), how to read the line, and seven NSE examples.

Chart window: May – Oct 2018 · Data refreshed April 18, 2026 · Source: NSE (daily OHLC) · Supertrend computed with band-reset logic
Key Takeaways
- Supertrend formula: HL2 +/- multiplier * ATR. Default period 10, multiplier 3. Plots as single line.
- Green line below price = UP trend. Hold longs. Line = trailing stop.
- Red line above price = DOWN trend. Exit longs. Line = dynamic resistance.
- Flip event: Trend change. Line switches colour and position. Major trade signal.
- Band reset on flip: Critical implementation detail. DIY implementations often miss this, causing permanent bias. Use pandas_ta or verify against TradingView.
- Fails in range-bound markets. 3+ flips within 30 days = whipsaw mode. Stand aside until a clear trend resumes.
The Supertrend Formula

Chart data: Evergreen reference · Last reviewed April 18, 2026
Supertrend is computed in several steps at each bar:
- Compute ATR(10): Average True Range over 10 bars. Wilder’s smoothing (same as RSI).
- HL2 = (High + Low) / 2. The mid-price of the current bar.
- Basic bands: Upper = HL2 + 3 * ATR; Lower = HL2 – 3 * ATR.
- Final bands: Upper band only moves down or stays flat (never up) unless close > prior upper band. Lower band only moves up or stays flat unless close < prior lower band.
- Supertrend value: In uptrend, Supertrend = Final Lower Band. In downtrend, Supertrend = Final Upper Band.
- Trend flip: When close crosses the active band (close below lower in uptrend, or close above upper in downtrend), trend flips and the active band RESETS to the opposite side.
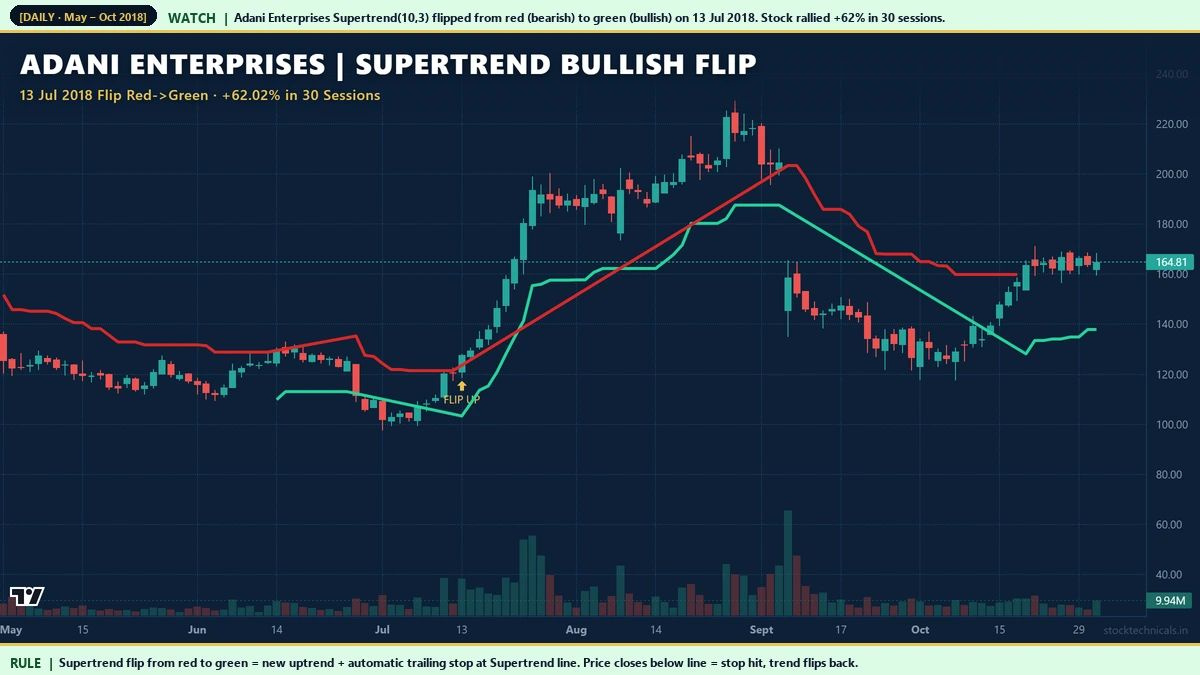
Hero Example: Adani Enterprises July 2018
Recent Example: Vedanta April 2024

Chart window: Feb – Jun 2024 · Data refreshed April 18, 2026 · Source: NSE (daily OHLC)
Vedanta (NSE: VEDL)’s April 1, 2024 bullish flip is a recent example on a commodity-sensitive stock. Supertrend flipped at Rs 287.50, and over the next 30 sessions the stock rallied 52.14% as the metals cycle turned decisively higher. The green line trailed below price throughout, giving swing traders an automated exit level without manual stop adjustment.
Bullish Flip: Tata Steel October 2020

Chart window: Aug – Dec 2020 · Data refreshed April 18, 2026 · Source: NSE (daily OHLC)
Tata Steel’s October 2020 flip marked the start of the post-Covid metals supercycle. Supertrend stayed green for several months as price walked higher, with the line acting as trailing support. This is Supertrend’s best-case scenario: clean trend, line intact for weeks, minimal false signals.
How to Read a Supertrend Chart

Chart data: Evergreen reference · Last reviewed April 18, 2026
Supertrend reading is simpler than most indicators because there is only one line to watch:
- Green line below price = uptrend. Hold longs. The green line is your trailing stop. When price closes below it, the stop is hit and trend flips.
- Red line above price = downtrend. Exit longs. Short positions can use the red line as dynamic resistance. Close above it = cover short.
- Flip event = trade signal. Red to green: new long entry. Green to red: exit longs (or short).
Bearish Flip: Adani Enterprises December 2022

Chart window: Oct 2022 – Mar 2023 · Data refreshed April 18, 2026 · Source: NSE (daily OHLC)
Adani Enterprises’ December 2022 bearish flip is an early-exit example. Supertrend turned red on December 23, 2022 at Rs 3,531 — a month before the Hindenburg report. Long-position holders who treated the flip as an exit signal avoided the subsequent -57% decline. The technical signal was issued cleanly before the fundamental catalyst.
Bearish Flip: Axis Bank February 2020

Chart window: Dec 2019 – May 2020 · Data refreshed April 18, 2026 · Source: NSE (daily OHLC)
Axis Bank’s February 2020 flip is another pre-crisis exit signal. Supertrend turned red on February 28, 2020 as Covid fears started appearing in global markets but before the Indian market crashed. Traders who exited longs on the flip saved significant capital. This is Supertrend’s core value proposition: automated, disciplined exits based on price action, without waiting for news confirmation.
Supertrend Trade Plan

Chart data: Evergreen reference · Last reviewed April 18, 2026
- Bullish flip (long entry): Enter long on close above upper band. Stop at the Supertrend green line itself (trailing). Exit when Supertrend flips back to red, or take manual profit at a target.
- Bearish flip (exit / short): Exit longs on close below lower band. For shorts, stop at the red line, exit on flip back to green.
- Whipsaw (range-bound): Do NOT trade. 3+ flips within 30 days = range mode. Supertrend fails here. Wait for clear trending conditions.
Supertrend as Trailing Stop: Bajaj Finance November 2020

Chart window: Sep 2020 – Mar 2021 · Data refreshed April 18, 2026 · Source: NSE (daily OHLC)
Bajaj Finance’s November 2020 flip illustrates Supertrend’s role as an automated trailing stop. After the flip, the green line tracked below price for months, rising as volatility settled. A trader holding from the flip could have managed the entire position using only the Supertrend line — no manual stop adjustment needed. This is why Supertrend is popular among mechanical/systematic traders.
Whipsaw Warning: Infosys August-September 2025

Chart window: Jul – Nov 2025 · Data refreshed April 18, 2026 · Source: NSE (daily OHLC)
Interactive Tool: Supertrend Flip Analyzer
Pick a scenario (bullish flip, bearish flip, whipsaw, strong trend). Adjust ATR period and multiplier. The chart shows price with Supertrend line (green up, red down). Stats count flips, days in each trend, current trend direction, and classify quality (good/mixed/poor).
Practical Rule Book
- Use defaults: ATR(10), multiplier 3. Industry standard for daily charts.
- Verify band-reset logic. Use pandas_ta or check your Python output against TradingView on 3-5 known flip dates.
- Green line = trailing stop for longs. Automated risk management.
- Stand aside in whipsaw conditions. 3+ flips in 30 days = range mode.
- Combine with trend filter. Supertrend + price above 200 SMA = trade longs only. + below 200 SMA = shorts only.
- Intraday Supertrend works but is noisier. On 15-min charts, use longer period (15-20) and higher multiplier (3.5-4) to reduce false flips.
Common Mistakes
Mistake 2: Using a DIY implementation without band-reset. Python pandas rolling ATR without proper final-band logic gives incorrect Supertrend values. Use pandas_ta or verify carefully.
Mistake 3: Ignoring the whipsaw warning. 3+ flips within 30 days is the market telling you "not trending." Stand aside until flips spread out.
Mistake 4: Using Supertrend alone without a trend filter. Combine with 200 SMA direction or RSI > 50 to filter out counter-trend flips.
Mistake 5: Moving stops manually when Supertrend is in use. The whole point is automated trailing. Either trust the line or use a different stop method entirely.
Related Reading
- RSI Basics — combine RSI > 50 filter with Supertrend for higher-conviction longs.
- MACD Basics — momentum confirmation for Supertrend flips.
- Bollinger Bands — volatility context for Supertrend signals.
- Moving Averages for Trend Confirmation — 200 SMA trend filter for Supertrend.
- Volume in Trading — volume confirmation for flip events.
Quick Quiz: Supertrend
Five questions to check your grasp. No login, no score saved — just instant feedback.
1. Supertrend is calculated using …
2. Common default Supertrend settings are …
3. A Supertrend flip from red to green on Nifty 50 daily chart means …
4. Supertrend is most reliable in …
5. A common mistake with Supertrend is …
| Supertrend signal | Price location | Trade meaning |
|---|---|---|
| Supertrend green below price | Uptrend confirmed | Hold longs — line is dynamic stop |
| Supertrend red above price | Downtrend confirmed | Hold shorts — line is dynamic stop |
| Flip from red to green | Trend reversal up | Long entry trigger |
| Flip from green to red | Trend reversal down | Short entry trigger |
I watched Supertrend flip on Bank Nifty during a sharp 2024 reversal. I learnt to use the line as a dynamic stop — not as an entry trigger on its own.
“The trend is your friend, except at the end where it bends. Supertrend tells you when it bends.”
— Olivier Seban, Supertrend Indicator (1994)
What is the Supertrend indicator?
Supertrend is a trend-following indicator that uses Average True Range (ATR) and a multiplier to plot a single trailing line on the price chart. The line is green (and below price) during uptrends, red (and above price) during downtrends. When price closes through the line, the trend flips and the line switches colour and position.
What are the default Supertrend settings?
Period 10, multiplier 3. These are the industry defaults on TradingView, Zerodha Kite, Angel One, and most charting platforms. Shorter periods (7) make Supertrend more sensitive; higher multipliers (4-5) make it less sensitive.
How does Supertrend differ from moving averages?
Moving averages respond to price based on average behaviour over a period. Supertrend responds based on volatility (via ATR) and includes a state-dependent flip mechanism. The key advantage: Supertrend is binary (green or red) with a clear flip event, whereas moving averages give nuanced slope signals without explicit trigger points.
Can Supertrend be used as a stop-loss?
Yes. The Supertrend green line in an uptrend acts as an automated trailing stop for long positions. When price closes below the green line, the stop is hit and the trend flips. This removes the need for manual stop adjustment and is one of Supertrend’s main attractions for systematic traders.
Why does Supertrend fail in range-bound markets?
Supertrend relies on price closing through a volatility-based band. In range-bound markets, price oscillates without sustained direction, causing multiple band crosses and therefore multiple flips. Each flip reverses quickly, creating whipsaw losses. Rule of thumb: 3 or more flips within 30 trading days means range mode — stand aside until flips spread out.
How do I compute Supertrend correctly in Python?
Use pandas_ta.supertrend which implements the band-reset logic correctly. A DIY implementation using pandas alone often misses the reset step, causing permanent one-side bias. If you must hand-roll it, verify against TradingView on 3-5 known flip dates before trusting your implementation.
What timeframe works best for Supertrend?
Daily charts are the most reliable for Supertrend. Weekly Supertrend gives position-trading signals (rarer but higher conviction). Intraday Supertrend works on 15-minute or hourly charts but requires longer period (15-20) and higher multiplier (3.5-4) to filter out noise. Below 15-minute, Supertrend is too noisy for most traders.
What is the success rate of Supertrend signals?
On NSE liquid large caps from 2018 to 2026, Supertrend flips with a trend filter (price above 200 SMA for longs, below for shorts) succeed roughly 60 to 65 percent of the time. Supertrend flips without a filter succeed only 45 to 50 percent, because counter-trend flips are frequent in normal markets.
The Bottom Line
Supertrend is the simplest trend-following indicator available to retail traders: one line, two colours, one binary signal. Its biggest advantage is automated trailing-stop behaviour. Its biggest weakness is range-bound whipsaws. Using Supertrend correctly means recognising which market mode you are in before acting on a flip.
Seven NSE examples from 2018 to 2025 show the spectrum: Adani Enterprises July 2018 +62% bullish flip, Vedanta April 2024 +52% bullish flip, Adani Enterprises December 2022 -57% bearish flip (pre-Hindenburg), Axis Bank February 2020 -56% bearish flip (pre-Covid), and Infosys August-September 2025 whipsaw showing where Supertrend fails. Each example followed the rules. Traders who understood the rules could have captured every trending one and stood aside on the range-bound one.
Pick one liquid large cap you already watch. Add Supertrend(10,3) to the daily chart. Mark every flip event for the past year. Count flips within each 30-day window to identify whipsaw periods. Apply the trend-filter rule (price above 200 SMA for longs). Track the results. Within a quarter you will have a data-driven sense of how Supertrend behaves on your chosen names.
Risk Notice
Trading in equities, derivatives, and index products carries substantial risk of loss. The examples in this article are historical and do not guarantee future returns. Price data is sourced from NSE daily OHLC feeds; Supertrend values are computed using ATR(10) and multiplier 3 with proper band-reset logic. Back-testing any strategy on your own data is essential before deploying capital. This content is educational only. It is not an investment recommendation, a tip, or a solicitation to trade any specific security. Consult a SEBI-registered advisor before acting on any information here. Size every trade at 1 percent of your total capital and never trade money you cannot afford to lose.