Quick Answer: The Stochastic Oscillator measures where a stock’s closing price sits within its 14-day high-low range (0-100 scale). It generates %K and %D lines that spot momentum shifts — especially powerful for timing entries in ranging markets. Above 80 = overbought · below 20 = oversold.
Published February 25, 2026 · Last refreshed April 27, 2026. Prices and data are compiled with reasonable care but — always confirm against your broker before trading.
Key Takeaways
- Stochastic compares closing price to its recent high-low range — exceptionally good at spotting turning points.
- %K (fast line) reacts to every price change; %D (signal line) is a 3-period SMA of %K that acts as the trigger.
- Use Slow Stochastic (14,3,3) by default — double-smoothing removes noise while still catching momentum shifts.
- %K/%D crossovers in extreme zones (below 20 or above 80) are the reliable signals. Middle-zone crossovers are whipsaw noise.
- In strong trends, overbought can stay overbought for weeks. Always confirm with ADX, moving averages, or support/resistance before trading.

You’ve been building a solid toolkit of momentum indicators. You understand how RSI measures whether a stock is overbought or oversold, you’ve learned how MACD tracks momentum shifts through moving average convergence, and you’ve seen how ADX tells you whether a trend is strong or weak.
But here’s something experienced traders know: no single indicator is perfect, and the best traders use multiple tools that measure momentum differently.
That’s where the Stochastic Oscillator comes in. While RSI compares the magnitude of gains to losses, the Stochastic Oscillator does something fundamentally different — it compares a stock’s closing price to its price range over a specific period. The logic is beautifully simple: in an uptrend, prices tend to close near the high of the range, and in a downtrend, prices tend to close near the low.
This makes the Stochastic Oscillator exceptionally good at spotting turning points — the exact moments when momentum shifts from bullish to bearish or vice versa. It’s one of the most popular indicators on platforms like Zerodha Kite and TradingView, and once you understand how it works, you’ll see trading setups you never noticed before.
In this article, you’ll learn what the Stochastic Oscillator is, how the %K and %D lines work, how to read the 0-100 scale, the difference between Fast, Slow, and Full Stochastic, how to trade overbought/oversold signals, how to spot powerful divergences, and how to combine the Stochastic with RSI, Bollinger Bands, and support and resistance for high-probability setups.
Who is this article for? Traders who understand RSI basics and want to add a second momentum indicator that approaches overbought/oversold analysis from a completely different angle.
What is the Stochastic Oscillator?

The Stochastic Oscillator is a momentum indicator created by George Lane in the late 1950s. It measures where a stock’s closing price falls relative to its high-low range over a specific number of periods (usually 14).
The core principle is this: in an uptrend, closing prices tend to cluster near the top of the recent range. In a downtrend, closing prices tend to cluster near the bottom.
Think of it this way. Imagine Reliance Industries (NSE: RELIANCE) has traded between ₹2,400 and ₹2,500 over the last 14 days. If today’s close is ₹2,490, the stock is closing very near the top of its range — that’s bullish momentum. The Stochastic reading would be around 90. If today’s close is ₹2,410, it’s closing near the bottom — bearish momentum. The Stochastic reading would be around 10.
The Stochastic Oscillator gives you two lines:
%K Line (the fast line): This is the main line. It shows where the current close sits relative to the 14-period high-low range. It moves quickly and reacts to every price change.
%D Line (the signal line): This is a 3-period simple moving average (SMA) of %K. It smooths out the %K line and acts as a trigger for buy/sell signals — similar to how the signal line works in MACD.
Both lines oscillate between 0 and 100:
- Above 80 = Overbought zone (price is closing near the top of its range)
- Below 20 = Oversold zone (price is closing near the bottom of its range)
Important: Just like RSI, overbought doesn’t automatically mean “sell” and oversold doesn’t automatically mean “buy.” A stock can stay overbought for weeks in a strong uptrend. The Stochastic becomes most powerful when you combine it with other signals.
How the Stochastic Oscillator is Calculated
The formula is straightforward once you understand what it measures:
%K = ((Current Close – Lowest Low) / (Highest High – Lowest Low)) × 100
Where:
- Current Close = today’s closing price
- Lowest Low = the lowest price in the last 14 periods
- Highest High = the highest price in the last 14 periods
%D = 3-period SMA of %K
Let’s walk through an example with Nifty 50:
Suppose over the last 14 trading sessions:
- Highest High = 22,800
- Lowest Low = 22,200
- Today’s Close = 22,650
%K = ((22,650 – 22,200) / (22,800 – 22,200)) × 100
%K = (450 / 600) × 100 = 75
This means Nifty 50 is closing at the 75th percentile of its 14-day range — relatively close to the top, suggesting bullish momentum but not yet in overbought territory.
If the next three %K values are 75, 78, and 82:
%D = (75 + 78 + 82) / 3 = 78.33
The %D line trails the %K line, creating crossover signals that traders use for entries and exits.
Why 14 periods? George Lane originally designed the indicator with a 14-period lookback. This remains the most commonly used setting because it balances sensitivity with reliability. Shorter periods (like 5 or 9) make the indicator more reactive but produce more false signals. Longer periods (like 21) are smoother but slower to react.
Fast Stochastic vs Slow Stochastic vs Full Stochastic
This is where many beginners get confused, so let’s clarify the three versions:
Fast Stochastic (Raw)
The Fast Stochastic uses the raw %K formula (14-period) and a 3-period SMA as %D. It’s extremely sensitive and produces a choppy, noisy signal. Most traders find the Fast Stochastic too volatile for practical use because it generates too many false crossover signals.
Slow Stochastic (Most Popular)
The Slow Stochastic smooths things out by:
- Taking the Fast %D (3-period SMA of Fast %K) and calling it the new Slow %K
- Applying another 3-period SMA to get the new Slow %D
This double-smoothing removes a lot of noise while still capturing genuine momentum shifts. The Slow Stochastic (14,3,3) is what most platforms like Zerodha Kite and TradingView show by default when you add the “Stochastic” indicator.
Full Stochastic (Customizable)
The Full Stochastic lets you customize all three parameters:
- %K Period (default: 14) — the lookback period
- %K Smoothing (default: 3) — smoothing applied to the raw %K
- %D Period (default: 3) — the SMA period for the signal line
This gives maximum flexibility. Common settings include (14,3,3) for default, (5,3,3) for scalping, and (21,5,5) for swing trading.
Which should you use? For most traders, the Slow Stochastic (14,3,3) is the best starting point. It’s smooth enough to avoid false signals but responsive enough to catch real momentum shifts. Only switch to the Fast or Full versions after you have months of experience with the Slow version.
Reading the Stochastic Scale: Overbought and Oversold
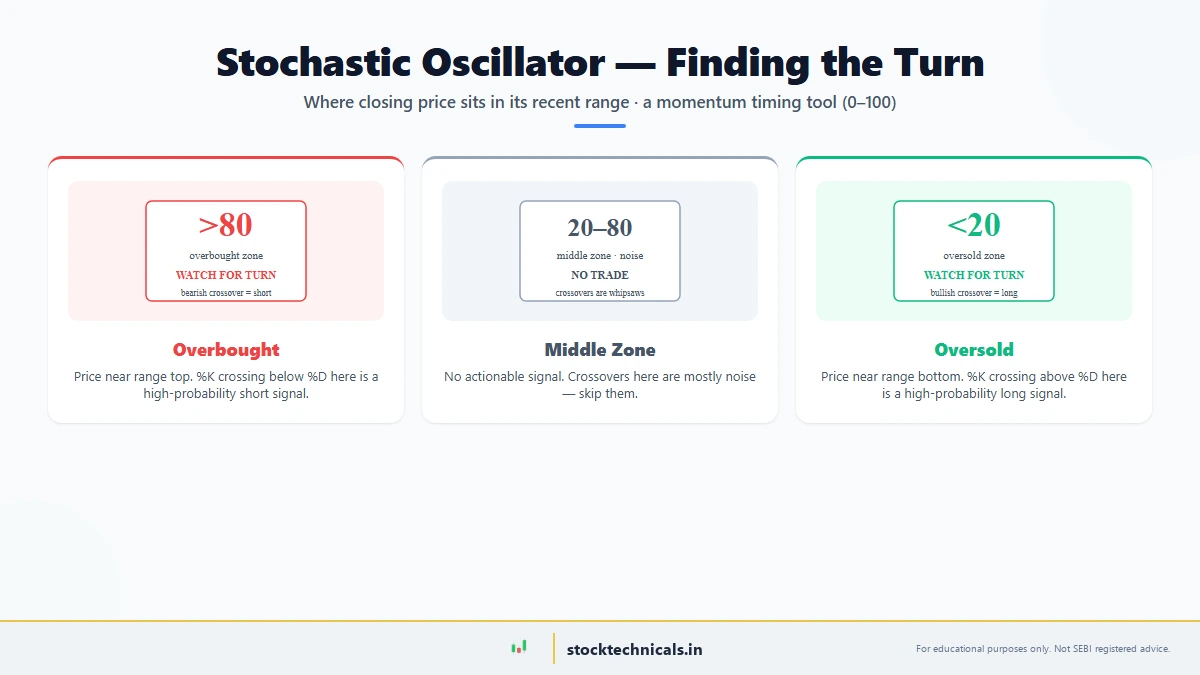
The Stochastic Oscillator moves between 0 and 100, with two critical threshold levels:
The 80 Level (Overbought Zone)
When both %K and %D are above 80, the stock is in the overbought zone. This means the closing price is consistently near the top of its recent range.
What it means in practice:
- In a ranging market: The stock may be due for a pullback. Look for %K crossing below %D as a sell signal.
- In a strong uptrend: The stock can stay overbought for weeks. Selling every time the Stochastic hits 80 in an uptrend will get you stopped out repeatedly. Instead, use overbought readings as a warning to tighten your stop loss, not as an automatic sell signal.
The 20 Level (Oversold Zone)
When both %K and %D are below 20, the stock is in the oversold zone. The closing price is consistently near the bottom of its recent range.
What it means in practice:
- In a ranging market: The stock may be due for a bounce. Look for %K crossing above %D as a buy signal.
- In a strong downtrend: The stock can stay oversold for weeks. Buying every time the Stochastic hits 20 in a downtrend is a recipe for catching falling knives.
The 50 Level (Midpoint)
The 50 level acts as a momentum divider:
- Stochastic consistently above 50 = Bullish momentum (price closing in the upper half of its range)
- Stochastic consistently below 50 = Bearish momentum (price closing in the lower half of its range)
- Crossing from below 50 to above 50 = Potential bullish shift
- Crossing from above 50 to below 50 = Potential bearish shift
The golden rule: Overbought and oversold readings are most reliable in ranging or sideways markets. In strong trends, use the Stochastic to time entries with the trend rather than trying to pick reversals.
Stochastic Crossover Signals: The %K/%D Cross
The crossover between %K and %D is the most basic and widely used Stochastic signal. It works similarly to the MACD signal line crossover but operates within the 0-100 bounded range.
Bullish Crossover (Buy Signal)
A bullish signal occurs when:
- Both %K and %D are below 20 (oversold zone)
- %K crosses above %D from below
- Both lines then exit the oversold zone (cross above 20)
This three-part confirmation is important. A crossover that happens in the middle of the range (around 50) is weaker than one that happens in extreme oversold territory.
Example with TCS: TCS drops from ₹3,800 to ₹3,550 over two weeks. The Stochastic falls to 12. Then %K crosses above %D at the 15 level. Over the next three days, both lines climb above 20. This is a classic bullish crossover from oversold territory — often a strong buy signal.
Bearish Crossover (Sell Signal)
A bearish signal occurs when:
- Both %K and %D are above 80 (overbought zone)
- %K crosses below %D from above
- Both lines then exit the overbought zone (cross below 80)
Example with Infosys: Infosys rallies from ₹1,400 to ₹1,520, pushing the Stochastic to 88. Then %K crosses below %D at the 85 level. Both lines begin falling toward 80. This is a classic bearish crossover from overbought territory.
Filtering False Crossovers
Not every crossover is tradeable. Here’s how to filter:
Strong crossovers (trade these):
- Happen in extreme zones (below 20 or above 80)
- The %K and %D lines spread apart after crossing (momentum is accelerating)
- Confirmed by price action — a bullish engulfing candle, a breakout from support, etc.
Weak crossovers (skip these):
- Happen in the middle zone (30-70)
- The lines barely separate after crossing
- No confirmation from price action or volume
Stochastic Divergence: The Most Powerful Signal
Just like RSI divergence, Stochastic divergence occurs when price and the indicator move in opposite directions. Divergences are among the most reliable reversal signals in technical analysis.
Bullish Divergence
What it looks like:
- Price makes a lower low (new support level)
- Stochastic makes a higher low (building momentum)
What it means: Even though price is falling to new lows, the Stochastic is showing that selling pressure is weakening. Each sell-off is less intense than the last. This often precedes a reversal upward.
Example with Tata Motors: Tata Motors drops from ₹700 to ₹650, and the Stochastic hits 15. Price bounces, then drops again to ₹640 (lower low). But this time, the Stochastic only drops to 22 (higher low). Bullish divergence. Tata Motors then reverses and rallies to ₹720 over the next two weeks.
Bearish Divergence
What it looks like:
- Price makes a higher high (new resistance level)
- Stochastic makes a lower high (weakening momentum)
What it means: Even though price is reaching new highs, the buying pressure behind each rally is getting weaker. This often precedes a reversal downward.
Example with HDFC Bank: HDFC Bank rallies from ₹1,600 to ₹1,680, and the Stochastic hits 90. Price pulls back, then rallies again to ₹1,700 (higher high). But the Stochastic only reaches 82 (lower high). Bearish divergence. HDFC Bank then drops to ₹1,620 over the following week.
Hidden Divergence (Trend Continuation)
There’s also a less-known but valuable pattern called hidden divergence, which signals trend continuation rather than reversal:
Hidden Bullish Divergence: Price makes a higher low, but Stochastic makes a lower low. This suggests the uptrend is still intact and the pullback is a buying opportunity.
Hidden Bearish Divergence: Price makes a lower high, but Stochastic makes a higher high. This suggests the downtrend is still intact and the rally is a selling opportunity.
Pro tip: Regular divergence signals reversals. Hidden divergence signals continuation. Both are powerful, but hidden divergence is often overlooked by beginners.
How to Set Up the Stochastic Oscillator
On TradingView
- Open any chart (e.g., Nifty 50, Reliance, Bank Nifty)
- Click the “Indicators” button (fx icon) at the top
- Search for “Stochastic” — select “Stochastic” (not “Stochastic RSI” — that’s a different indicator)
- The default settings are (14, 1, 3) for the Full Stochastic
- Recommended change: Set the %K Smoothing to 3 for the Slow Stochastic → (14, 3, 3)
- The indicator appears in a separate panel below your price chart
- You’ll see the %K line (default blue) and %D line (default orange), with horizontal lines at 80 and 20
On Zerodha Kite
- Open any chart from your watchlist
- Click the “Studies” button at the top of the chart
- Search for “Stochastic” and select it
- Default settings: Period = 14, %K = 3, %D = 3 (Slow Stochastic)
- The %K and %D lines appear below your price chart with 80/20 reference lines
Recommended Settings by Trading Style
| Trading Style | %K Period | %K Smoothing | %D Period | Timeframe |
|---|---|---|---|---|
| Scalping | 5 | 3 | 3 | 1-min, 5-min |
| Intraday | 9 | 3 | 3 | 15-min |
| Swing | 14 | 3 | 3 | Daily |
| Positional | 21 | 5 | 5 | Weekly |
Important note on the 9:15 AM opening: The first 15 minutes of the NSE session (9:15-9:30 AM) often produce wild Stochastic readings because the high-low range is still forming. Wait until at least 9:45 AM for intraday Stochastic signals to become meaningful.
Combining the Stochastic with Other Indicators
The Stochastic Oscillator works best when confirmed by at least one other tool. Here are the four most powerful combinations:
Stochastic + RSI (Double Momentum Confirmation)
Both are momentum oscillators, but they measure different things:
- RSI compares average gains to average losses (magnitude of moves)
- Stochastic compares the close to the high-low range (position within range)
When both show oversold simultaneously (RSI below 30 AND Stochastic below 20), the buy signal is much stronger than either alone. Similarly, when both show overbought (RSI above 70 AND Stochastic above 80), the sell signal carries more weight.
Best for: Confirming extreme overbought/oversold conditions in ranging markets.
Stochastic + Bollinger Bands
Bollinger Bands show whether price is at the extremes of its volatility range. When price touches the lower Bollinger Band AND the Stochastic is below 20, that’s a powerful oversold confluence. When price touches the upper Band AND the Stochastic is above 80, that’s strong overbought confirmation.
Best for: Mean-reversion trades in ranging markets.
Stochastic + Support and Resistance
Plot your key support and resistance levels. When price reaches a support level AND the Stochastic shows a bullish crossover from oversold territory, you have two independent reasons to buy. When price reaches resistance AND the Stochastic shows a bearish crossover from overbought, two reasons to sell.
Best for: Timing entries at major price levels.
Stochastic + Moving Averages
Use the 50-day EMA to determine the trend direction. Only take bullish Stochastic crossovers when price is above the 50 EMA (buying in an uptrend). Only take bearish Stochastic crossovers when price is below the 50 EMA (selling in a downtrend).
Best for: Trend-following with momentum timing.
5 Rules for Trading with the Stochastic Oscillator

Rule 1: Trade the Slow Stochastic, not the Fast. The Slow Stochastic (14,3,3) is the standard for a reason — it filters out noise while keeping you responsive to real momentum shifts. Only use the Fast version after months of experience.
Rule 2: Overbought ≠ Sell, Oversold ≠ Buy. In strong trends, the Stochastic can stay overbought or oversold for weeks. Use overbought/oversold readings as context, not as standalone signals. Always check the trend first with ADX or moving averages.
Rule 3: The best crossovers happen in extreme zones. A %K/%D crossover below 20 or above 80 is far more significant than one happening around 50. Don’t chase crossovers in the middle zone — they have a much lower success rate.
Rule 4: Divergence is more reliable than crossovers. When you spot Stochastic divergence (especially combined with RSI divergence), it’s one of the most reliable reversal signals. Divergences take longer to develop but have a much higher win rate.
Rule 5: Always use at least one confirmation tool. Never trade on a Stochastic signal alone. Combine it with price action, support/resistance, volume, or another indicator. The Stochastic is most powerful as a timing tool — it tells you when to enter, while trend tools tell you which direction to trade.
Stochastic Oscillator Checklist: Before Every Trade
Before you take a trade based on the Stochastic, run through this checklist:
Step 1: Identify the trend. Is the market trending (use ADX > 25) or ranging (ADX < 20)? This determines how you use the Stochastic.
Step 2: Check the zone. Is the Stochastic in an extreme zone (below 20 or above 80)? Signals from extreme zones are far more reliable.
Step 3: Wait for the crossover. Don’t jump in just because the Stochastic is oversold. Wait for %K to cross %D in your trade direction. Patience pays.
Step 4: Look for divergence. Is there a divergence between price and the Stochastic? If yes, this adds significant conviction to the trade.
Step 5: Confirm with another tool. Check at least one additional indicator or price action signal. RSI, support/resistance, volume, or candlestick pattern — any one of these adds confirmation.
Step 6: Define your stop loss. For bullish trades from oversold, place your stop below the recent swing low. For bearish trades from overbought, place your stop above the recent swing high.
Step 7: Plan your target. Use the next resistance level (for longs) or support level (for shorts) as your initial target. Aim for at least a 1:2 risk-to-reward ratio.
Common Stochastic Mistakes (and How to Avoid Them)
Treating Overbought as an Automatic Sell
The problem: A beginner sees Stochastic at 85 and immediately sells Reliance. But Reliance is in a strong uptrend — the Stochastic stays above 80 for three more weeks while the stock gains another 8%.
The fix: Check the trend direction first. In a strong uptrend, overbought readings often just mean “strong momentum,” not “time to sell.”
Using the Fast Stochastic
The problem: The Fast Stochastic generates so many crossovers that you’re constantly entering and exiting trades. Your brokerage costs eat into your profits, and you get whipsawed repeatedly.
The fix: Always use the Slow Stochastic (14,3,3). It gives fewer but much more reliable signals.
Ignoring Divergence
The problem: You only look for crossovers and miss the divergence signals. Divergences are rarer but far more powerful — ignoring them means you miss the best setups.
The fix: Every time the Stochastic is in an extreme zone, ask yourself: “Is there a divergence forming?” Train your eye to spot price making new highs/lows while the Stochastic doesn’t.
Trading Crossovers in the Middle Zone
The problem: You take every single %K/%D crossover, including the ones that happen around 40-60. These middle-zone crossovers have a very low success rate and generate losses.
The fix: Strictly trade crossovers only when they happen below 20 or above 80. Middle-zone crossovers are noise, not signals.
Not Adjusting Settings for Timeframe
The problem: You use the default (14,3,3) settings on a 1-minute chart for scalping. The signals lag too much for such a fast timeframe, and you enter trades too late.
The fix: Match your Stochastic settings to your timeframe. Use (5,3,3) for scalping, (9,3,3) for intraday, (14,3,3) for swing, and (21,5,5) for positional trades.
Stochastic Oscillator vs Other Momentum Indicators
| Feature | Stochastic (14,3,3) | RSI (14) | MACD (12,26,9) |
|---|---|---|---|
| What It Measures | Close position within high-low range | Average gain vs average loss | Moving average convergence/divergence |
| Range | 0-100 | 0-100 | Unbounded |
| Overbought Level | >80 | >70 | No fixed level |
| Oversold Level | <20 | <30 | No fixed level |
| Speed | Fast (most reactive) | Medium | Slow (most lagging) |
| Best For | Timing entries/exits in ranges | Trend strength + reversals | Trend following + momentum |
| Lines | %K + %D | Single RSI line | MACD + Signal + Histogram |
| False Signals | More (especially in trends) | Moderate | Fewer (but slower) |
| Best Market | Ranging/sideways | Both trending and ranging | Trending |
| Common Pair | Stochastic + RSI | RSI + MACD | MACD + EMA |
Key insight: The Stochastic is the fastest of the three and generates the earliest signals. RSI is the most balanced. MACD is the slowest but most reliable. Many professional traders use Stochastic for entry timing and MACD for trend confirmation.
What is the best Stochastic setting for intraday trading?
Use (9,3,3) on 15-minute charts for normal intraday, or (5,3,3) on 5-minute charts for scalping. The default (14,3,3) is ideal for swing trading on daily charts. Match your settings to your timeframe — shorter periods for faster markets, longer periods for slower ones.
Why does Stochastic stay overbought for so long in some stocks?
In a strong uptrend, the closing price consistently stays near the top of the range — which is exactly what overbought means. This is not a flaw; it correctly reflects strong momentum. Use ADX (>25 = trending) to distinguish healthy overbought conditions from genuine reversal signals.
How do I tell the difference between a strong crossover and a weak one?
Strong crossovers happen in extreme zones (below 20 or above 80), the lines spread apart after crossing, and price action confirms with engulfing candles or breakouts. Weak crossovers happen mid-range, lines barely separate, and lack confirmation — skip these entirely.
What is the most powerful Stochastic signal?
Divergence is more reliable than crossovers. Bullish divergence (price lower lows, Stochastic higher lows) and bearish divergence (price higher highs, Stochastic lower highs) signal reversals with higher win rates. Hidden divergence signals trend continuation and is equally valuable.
Should I use Stochastic or RSI?
Use both together for maximum confirmation. RSI measures gain vs loss magnitude; Stochastic measures price position within its range. When both flash overbought or oversold simultaneously, the signal is much stronger. Think of RSI as your momentum gauge and Stochastic as your entry-timing tool.
Your Next Step
You now have a solid understanding of the Stochastic Oscillator — how it measures momentum through the closing price’s position within its range, how to read the %K and %D crossovers, and how to combine it with other indicators for high-probability setups.
In the next article, ATR: Average True Range — Measuring Volatility Like a Pro, you’ll learn about the indicator that measures how much a stock typically moves. ATR doesn’t tell you direction — it tells you volatility, which is essential for setting proper stop losses and position sizes. Combined with your momentum tools (RSI, MACD, ADX, and now Stochastic), ATR will help you manage risk like a professional.
Disclaimer
The information provided on StockTechnicals.in is for educational purposes only and should not be considered as financial or investment advice. Trading in stocks and derivatives involves risk. The indicators and strategies discussed are tools for analysis and are not guaranteed to produce profits. Always conduct your own research and consider consulting a SEBI-registered financial advisor before making any investment decisions. Past performance is not indicative of future results. As per SEBI studies, approximately 9 out of 10 individual traders in the equity Futures and Options segment incur losses.
Related Articles
- RSI Basics: Understanding the Relative Strength Index
- MACD Basics: Moving Average Convergence Divergence Explained
- Bollinger Bands: The Complete Beginner’s Guide
- ADX: Measuring Trend Strength
- Supertrend Indicator: How It Works
- Support and Resistance: The Complete Guide
- EMA Basics: What Every Trader Must Know
Self-Assessment Quiz
Test the understanding of %K, %D, crossovers, and divergence covered in this article.
Test Your Knowledge
Q1: What does the Stochastic Oscillator measure?
Q2: A Stochastic reading above 80 signals:
Q3: Which crossovers are the most reliable signals?
Q4: The MOST powerful Stochastic signal is:
Q5: In a strong uptrend, what does overbought typically mean?
The Bottom Line on the Stochastic Oscillator
The Stochastic Oscillator excels at timing entries in ranging or sideways markets and spotting momentum reversals through divergence. But it generates false signals in strong trends and must never be used alone — always confirm with ADX, RSI, or price-structure tools. The one thing to remember: Stochastic is a timing tool, not a direction tool. It tells you when to enter, but you need other indicators to tell you which way to trade.
Overbought and oversold zones are most dangerous when misused in trending markets — a stock can stay overbought for weeks during strong rallies, and selling every time Stochastic hits 80 gets you stopped out repeatedly. Never assume overbought equals sell or oversold equals buy without confirming the market trend. Crossovers in the middle zone (30-70) are noise masquerading as signals; trade only extreme-zone crossovers.