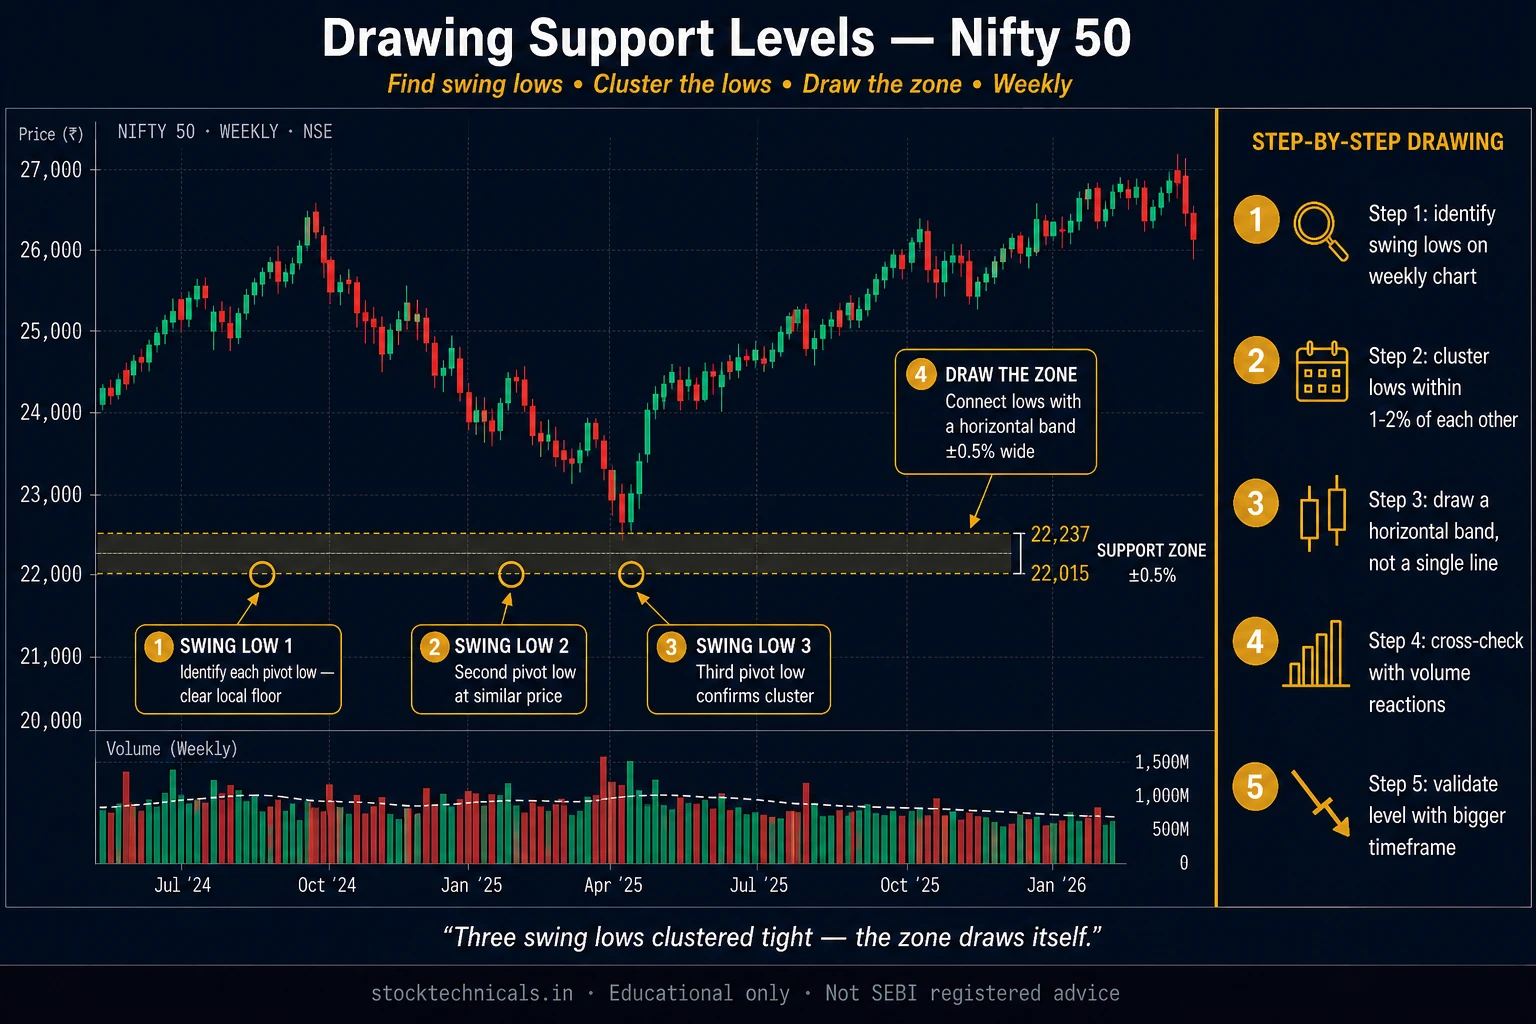
Dynamic vs Static Support and Resistance
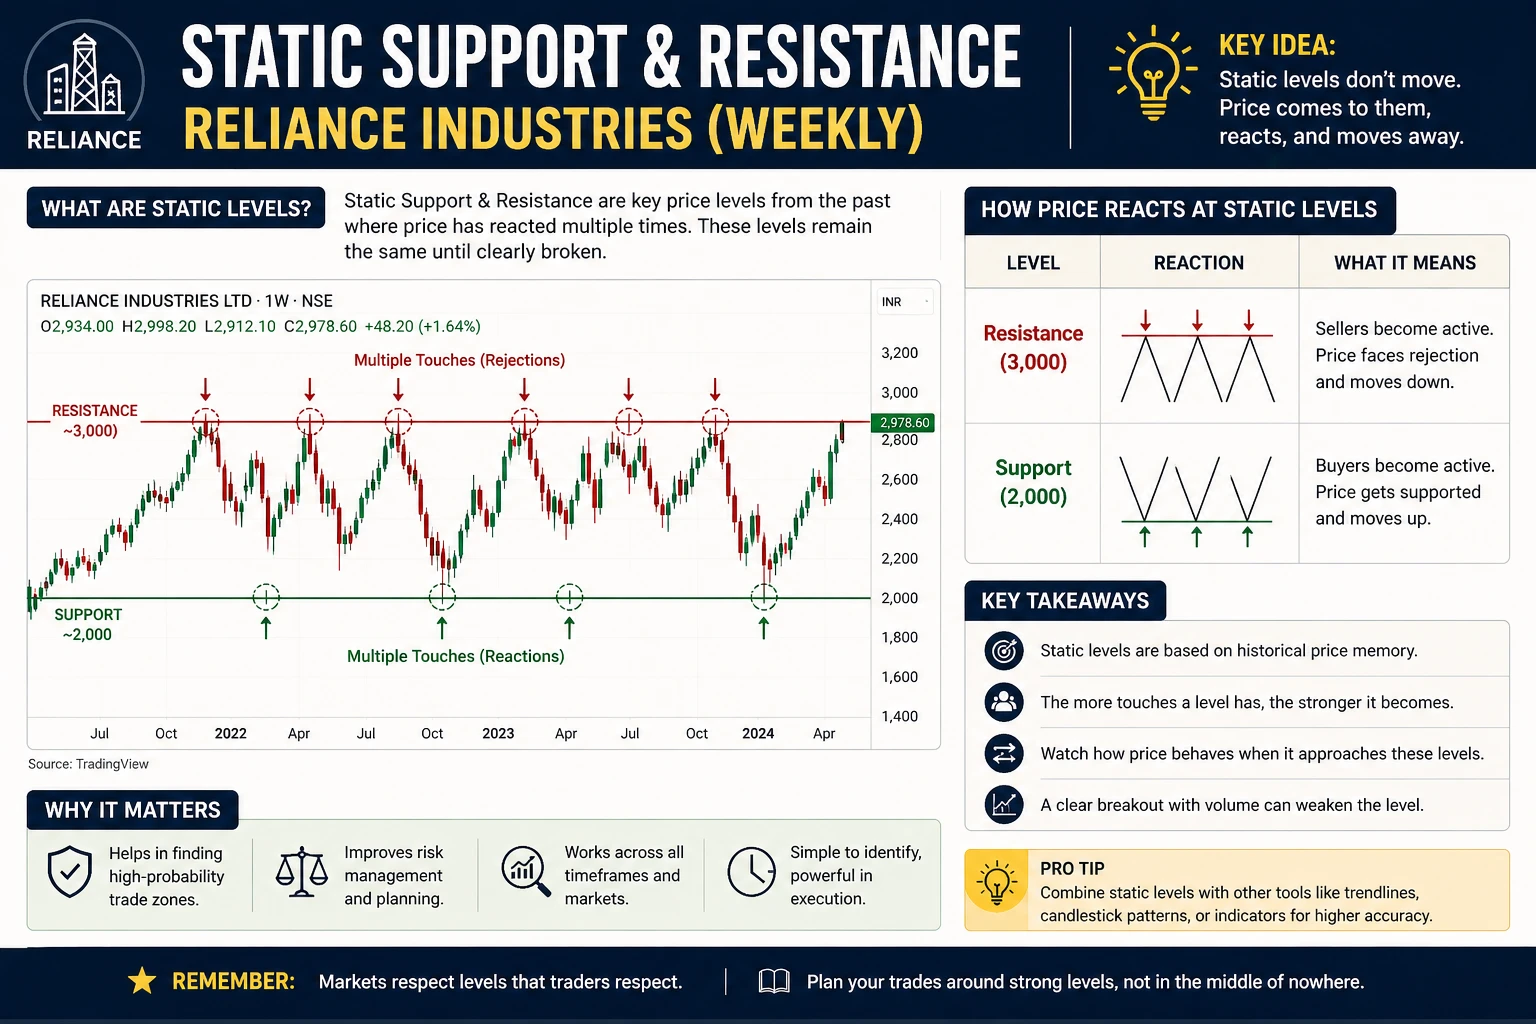
Most traders learn about SUPPORT AND RESISTANCE as horizontal lines on a chart. Those horizontal levels — drawn from previous swing highs and swing lows — are what professional traders call STATIC SUPPORT AND RESISTANCE. They stay fixed at one price, regardless of what happens next. Key Takeaways Static levels are horizontal; dynamic levels move … Read more