Trendlines: How to Draw and Trade Them
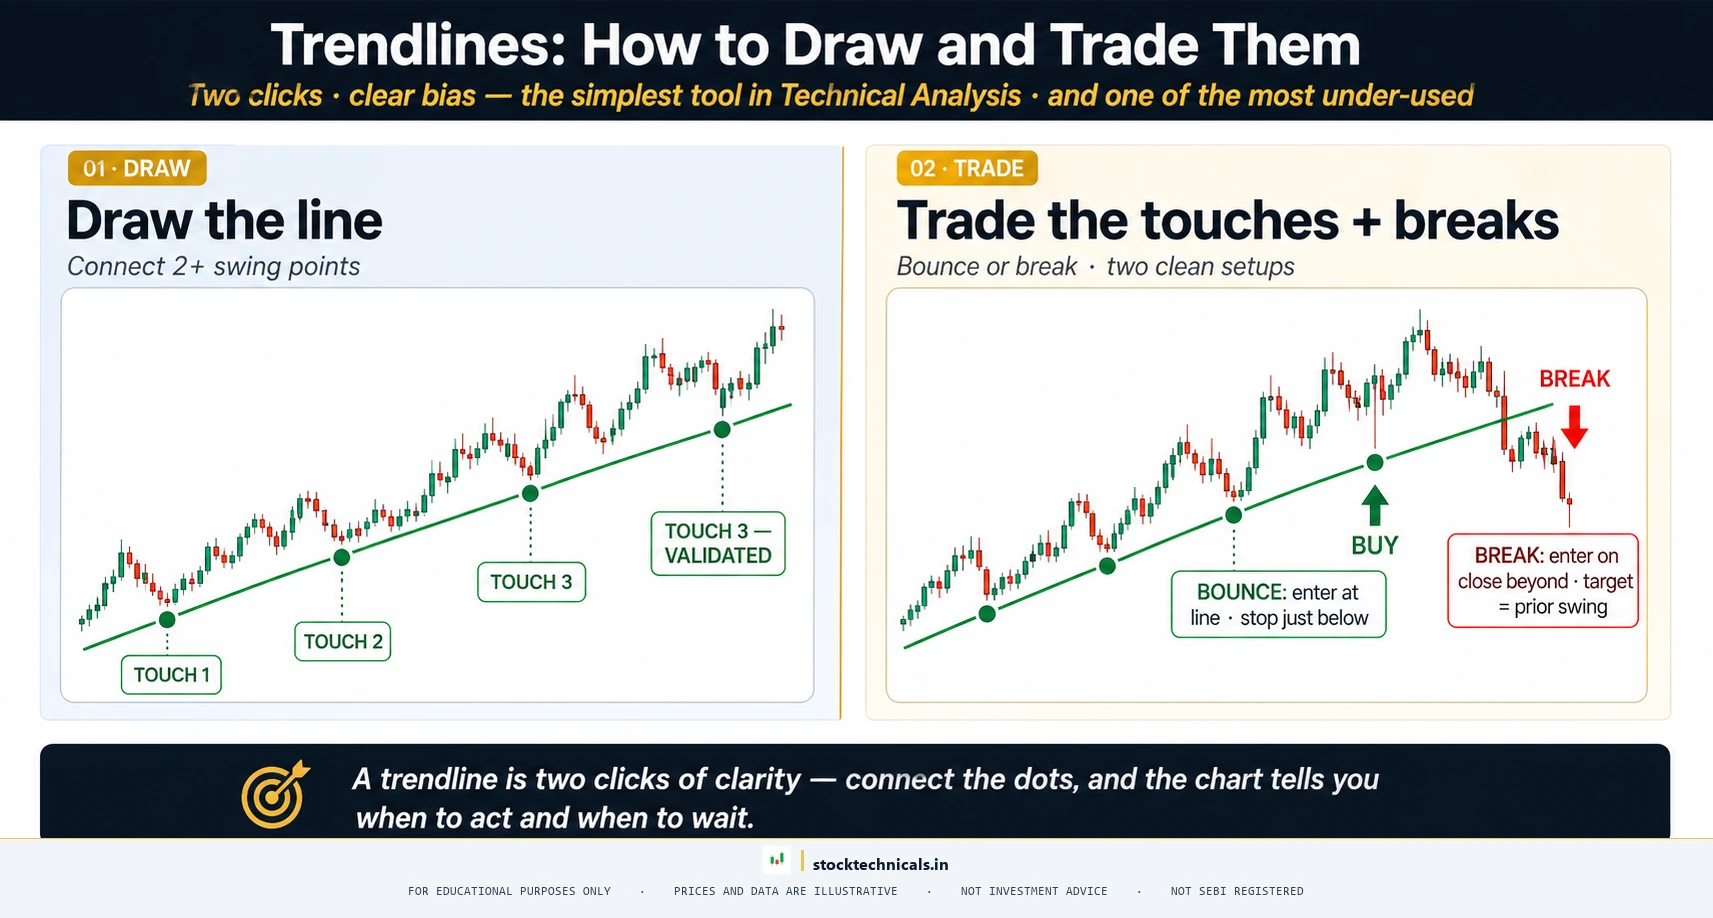
Trendlines are the most fundamental tool in technical analysis. Learn how to draw, validate, and trade trendlines using real NSE stock data and Variant D annotated charts.
Master technical analysis for stock trading. This comprehensive series covers chart reading, trend identification, support and resistance, candlestick patterns, indicators, and core concepts every trader needs — with real NSE and BSE examples.
Trendlines are the most fundamental tool in technical analysis. Learn how to draw, validate, and trade trendlines using real NSE stock data and Variant D annotated charts.
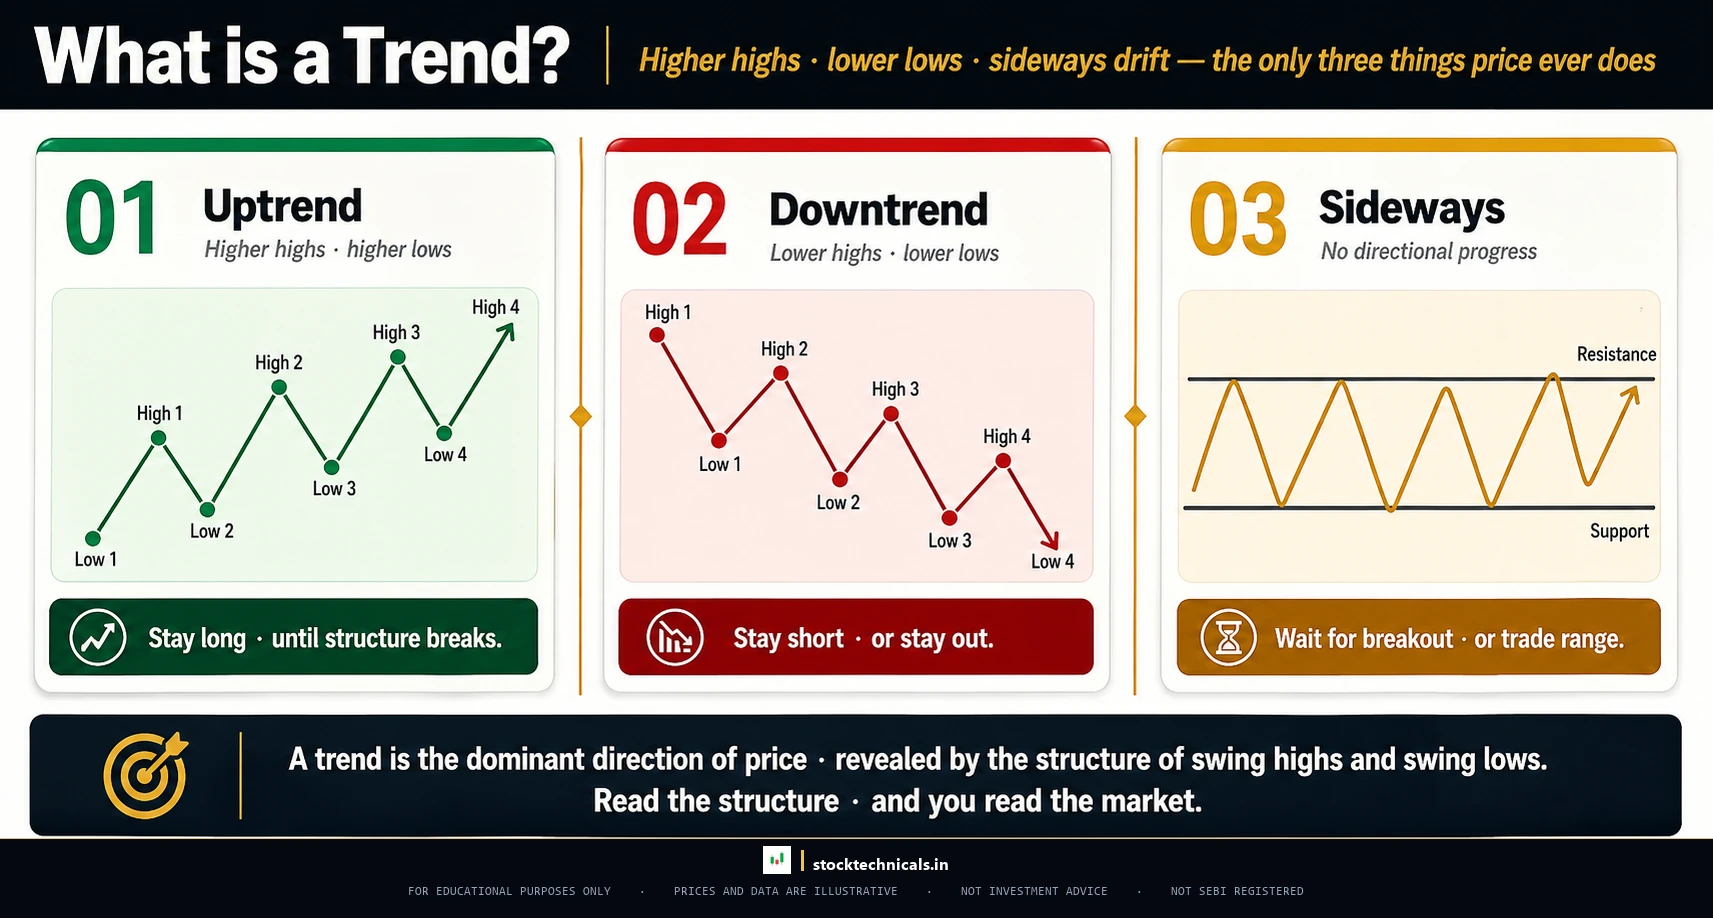
Every profitable trader follows one principle before anything else: identify the trend and trade with it. Learn how to identify uptrends, downtrends, and sideways markets using real NSE price data.
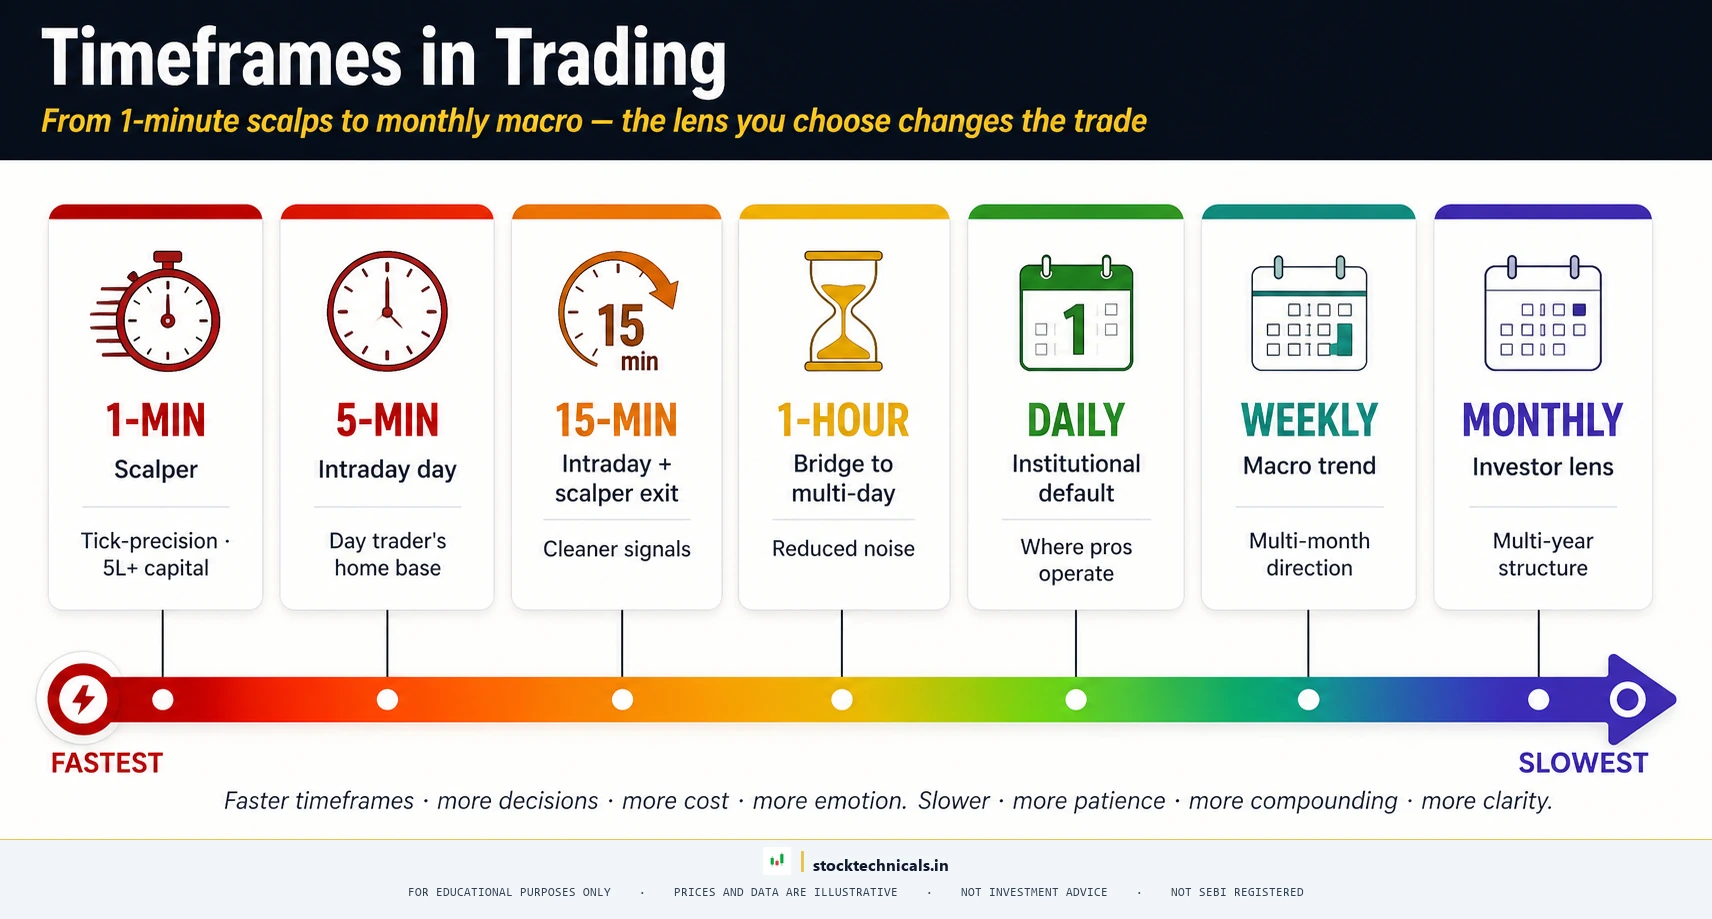
Choosing the right timeframe is one of the most important decisions a trader makes. Learn how daily, weekly, hourly, and 15-minute charts serve different trading styles and strategies.
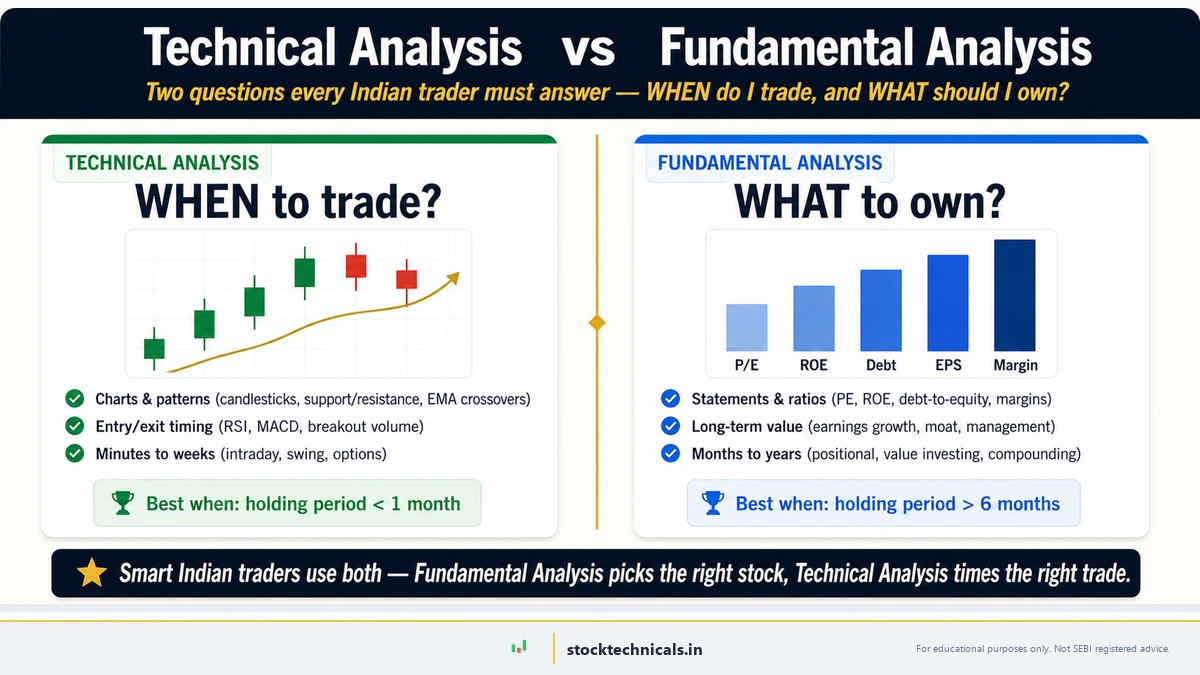
Compare technical and fundamental analysis with a real Reliance Industries case study anchored to 9 April 2026 data, plus a 4-week plan to learn both approaches.
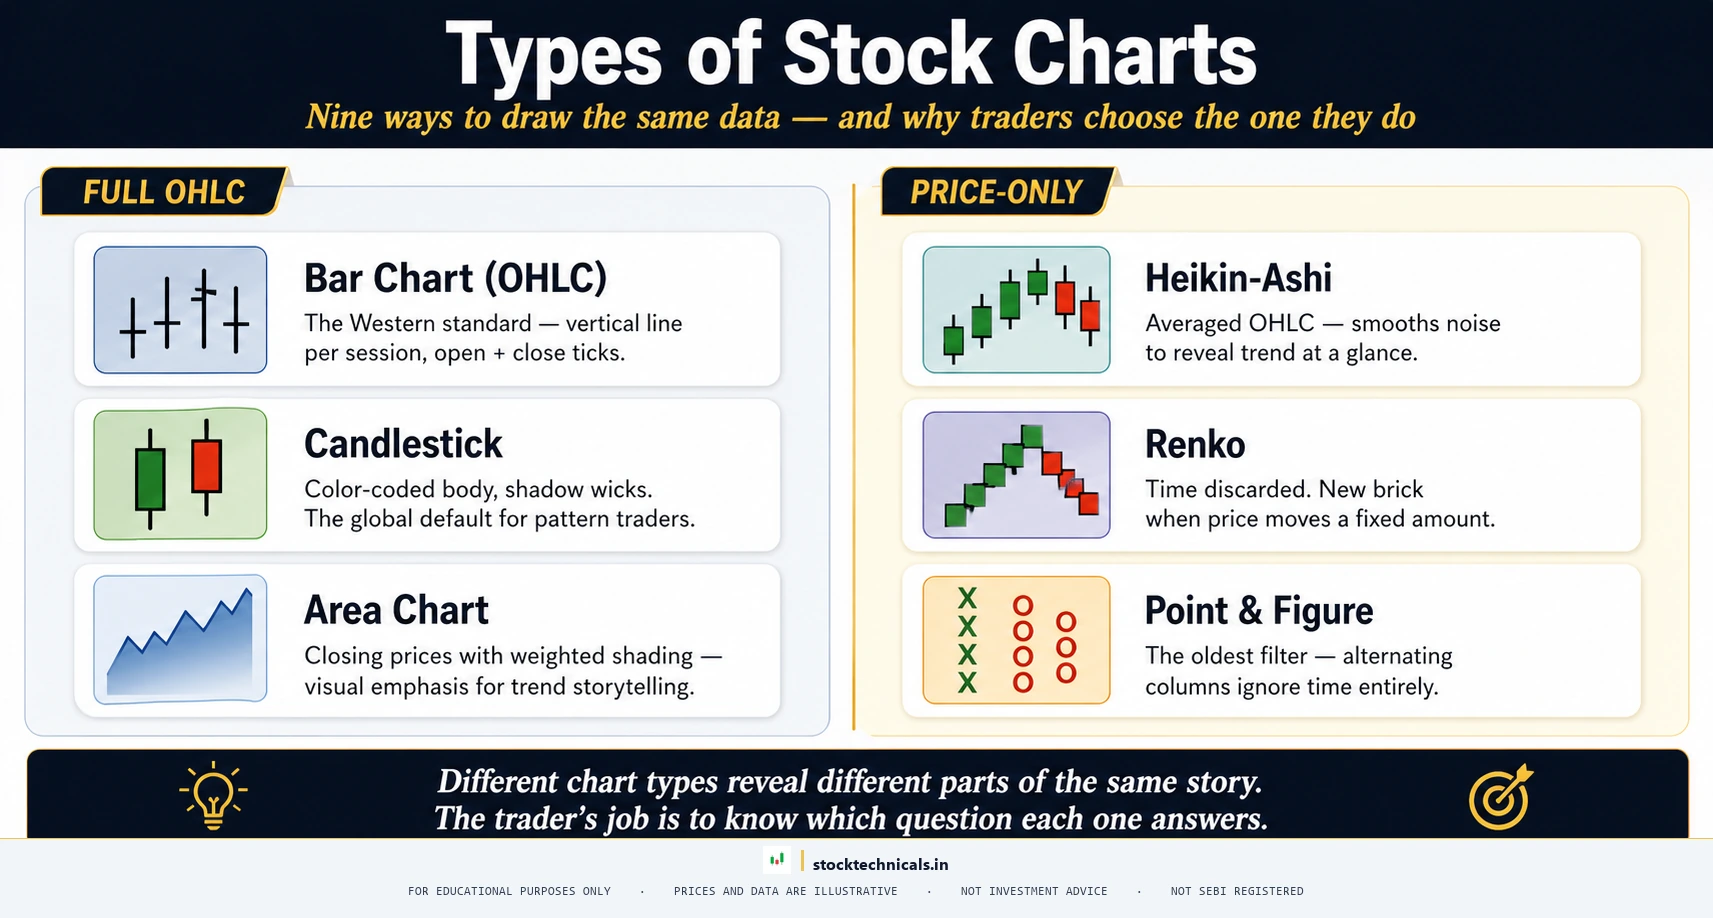
Learn the 3 main types of stock charts — Line, Bar, and Candlestick. Understand which chart type is best for your trading style with real NSE examples and comparisons.
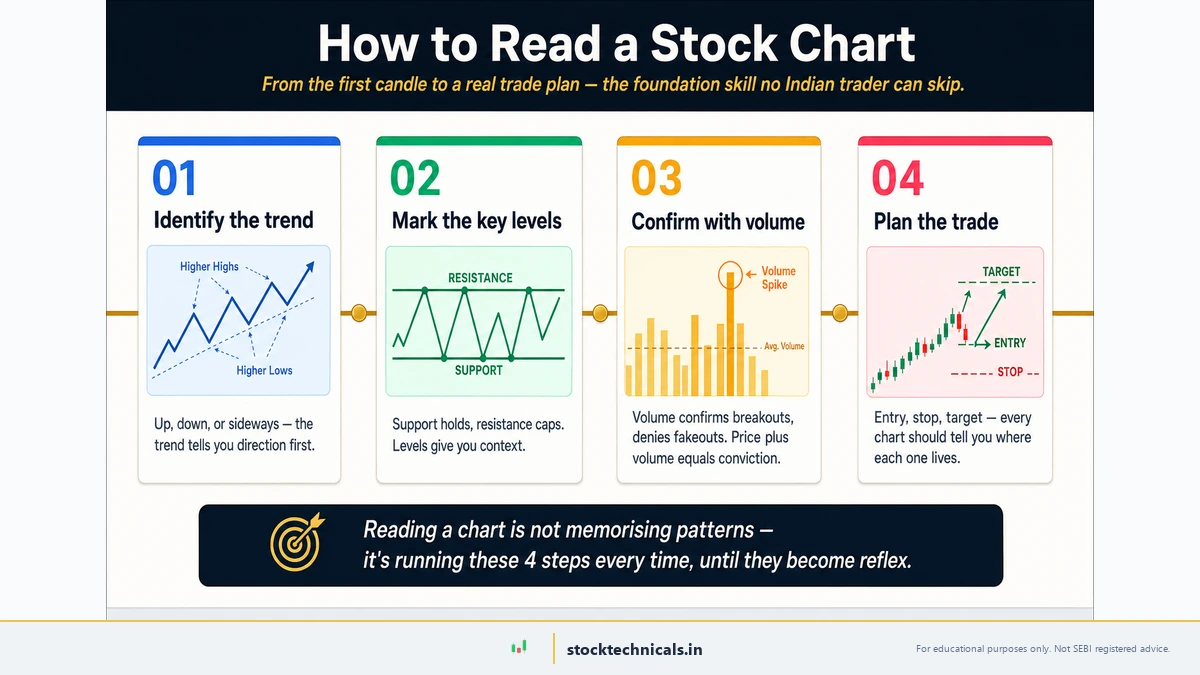
Learn how to read stock charts step by step for Indian stock market trading. Understand price bars, volume, timeframes & chart tools with real NSE/BSE examples.
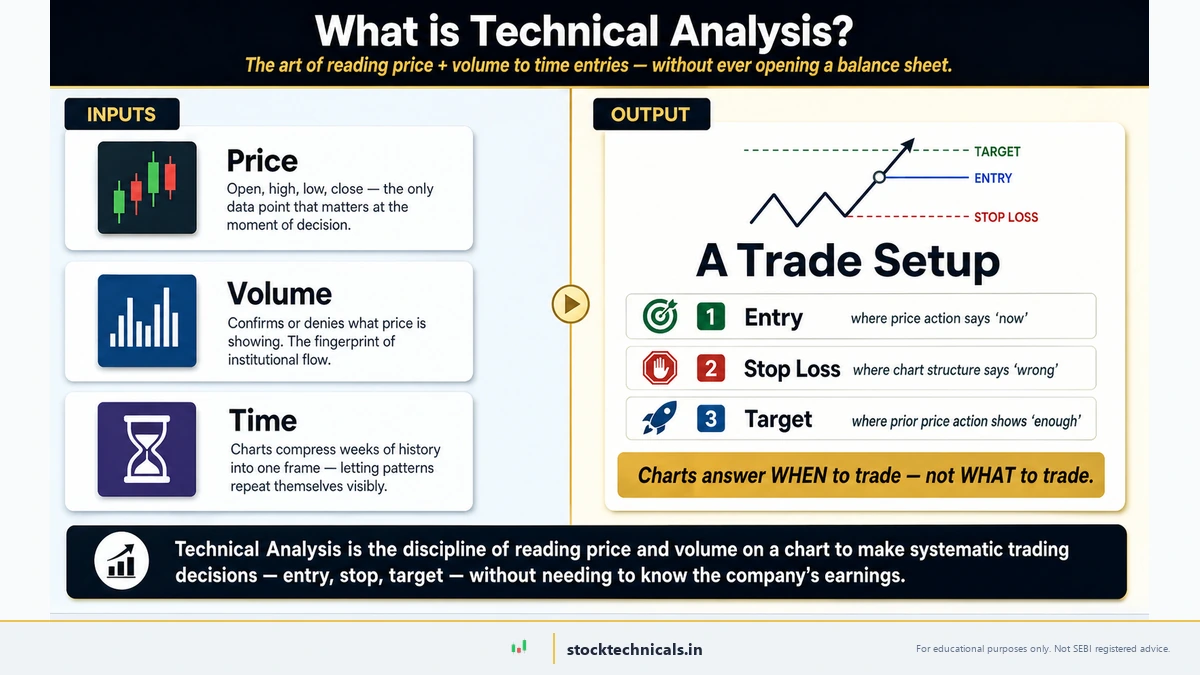
Learn what is technical analysis in the Indian stock market. Understand charts, patterns, indicators & how to use TA for trading Nifty, Bank Nifty & stocks on NSE and BSE.