
When a stock rallies for weeks and then suddenly dips 5 to 10 percent before continuing higher, that is a pullback: a temporary price retracement within an ongoing trend that often provides the best risk-to-reward entry available in trend trading.
Quick Answer: A pullback is a temporary price retracement within an existing trend — typically 3 to 10 percent from a recent swing high — that offers a higher-probability continuation entry than chasing the breakout. Trend intact, volume fading on the pullback, price holding above a key moving average or Fibonacci level — these are the signs. On NSE swing setups in Reliance, HDFC Bank, or L&T, pullbacks give traders a cleaner stop-loss and a better risk-reward ratio than any initial breakout.
Pullbacks are among the highest-probability setups in technical analysis because they let traders buy strength at a discount rather than chasing breakouts at the top. A confirmed uptrend has already done the hard work of proving buyer conviction. A pullback hands that same trend back at a cheaper price, with a tighter stop-loss and a cleaner risk-reward ratio than any initial breakout entry.
Here is the hard truth: not every dip is a pullback. Per the latest SEBI study covering FY24-25, 91 percent of individual equity F&O traders lost money, with aggregate net losses of ₹1.06 lakh crore — and confusing a reversal for a pullback is one of the quickest ways to join that statistic. This article breaks down exactly how to tell the difference, using daily data from NSE stocks like Reliance Industries, HDFC Bank, Larsen & Toubro, Nifty 50 (NSE: NIFTY 50), Adani Enterprises, and Tata Steel.

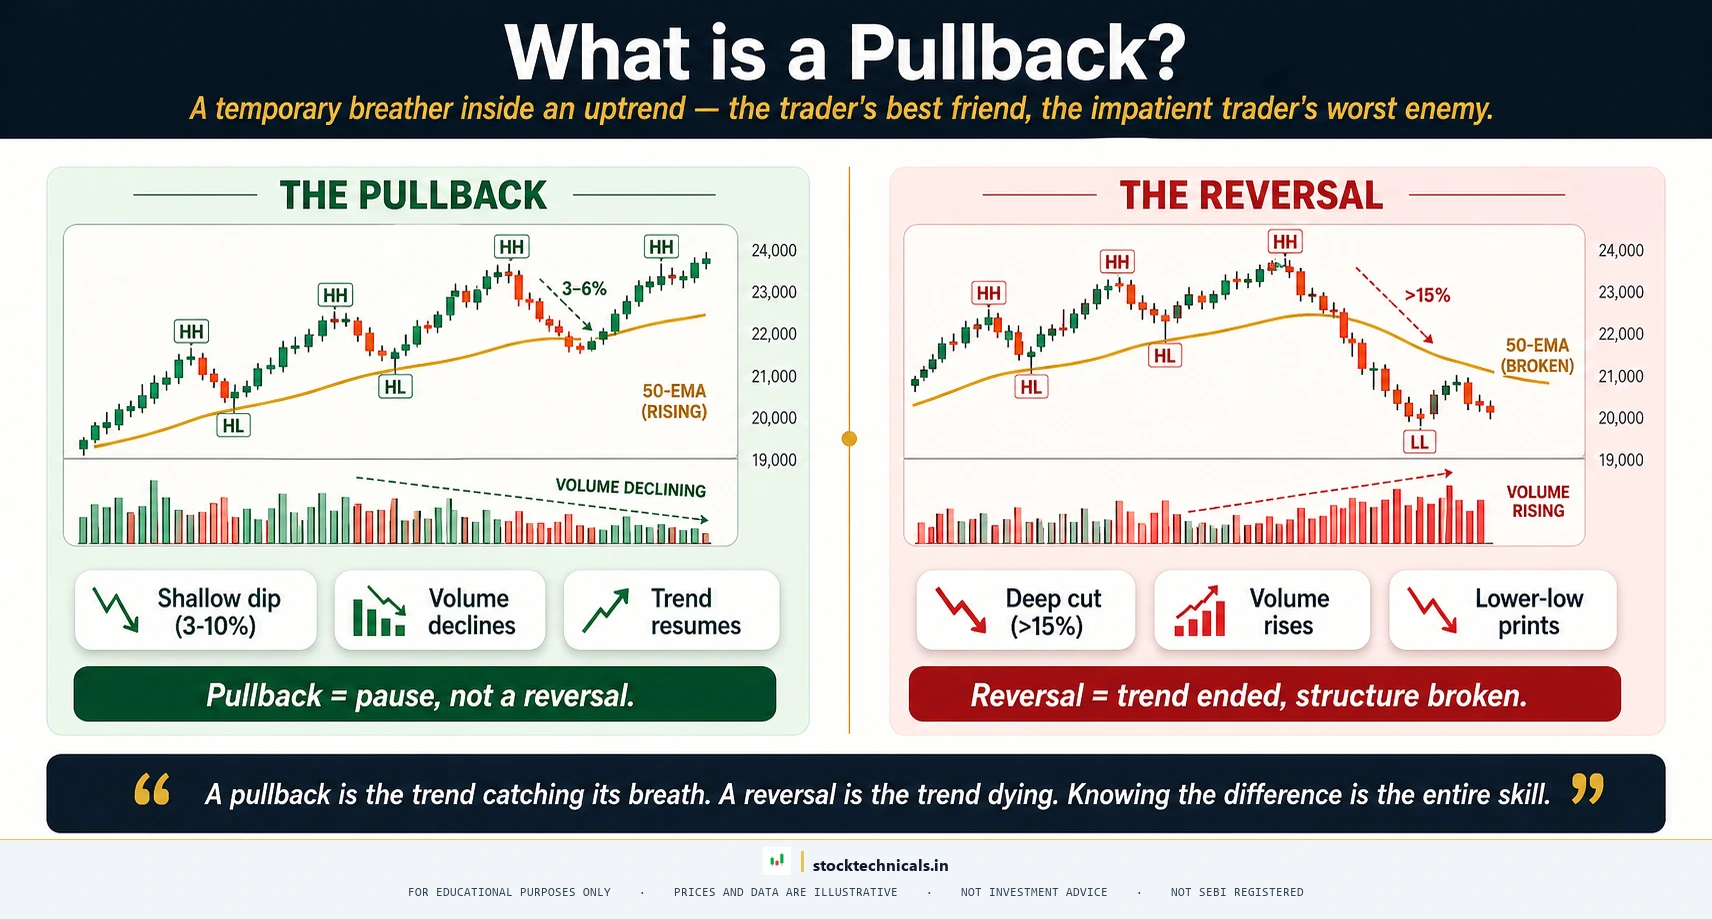
Quick Answer: A PULLBACK is a temporary price retracement within an existing trend, typically between 3 and 10 percent from a recent swing high, that offers a high-probability continuation entry before the trend resumes. A REVERSAL, by contrast, breaks the trend structure — price closes below a key moving average, volume rises on the decline, and lower-lows begin printing on the chart.
Key Takeaways
- A pullback is a temporary dip within an existing uptrend, not a trend change: Healthy pullbacks retrace 3 to 10 percent from the swing high, preserve the higher-high / higher-low structure, and resolve on declining volume.
- Dynamic support matters more than exact price levels: The 20 EMA, 50 EMA, and rising trendlines act as moving floors. When HDFC Bank bounced on October 7, 2019, the closing low of ₹593.45 was within 0.11 percent of the 20 EMA.
- Fibonacci 38.2 to 50 percent retracement is the trend-preserving zone: Pullbacks that hold above the Fib 50 percent line almost always resolve with the trend. L&T stopped Rs 0.87 from its Fib 38.2 level on September 29, 2022 before resuming higher.
- Volume declining on the dip is the single clearest pullback signature: Healthy pullbacks see fading participation. Rising volume on a dip is distribution, not consolidation.
- Failed pullbacks become reversals when the 50 EMA breaks on rising volume: Adani Enterprises looked like a pullback in late December 2022. By February 27, 2023 it had collapsed from ₹4,038.20 to ₹1,157.08, a 71 percent reversal that broke every key level.
What is a Pullback?
A pullback is a short-term price decline within an ongoing uptrend — or a short-term price rise within an ongoing downtrend. The defining characteristic is that the broader trend remains intact. Price moves against the prevailing direction for a few days or weeks, then resumes in the original direction.
Think of a staircase going up. An uptrend is not a straight line; it is a sequence of rallies punctuated by rest steps. Each rest step is a pullback. The stock pushes higher, takes profit, consolidates for a few sessions, and then pushes higher again. That rhythmic behavior is what creates the classic "higher-high, higher-low" structure visible on every healthy trending chart.
Canonical definition: The term is used almost interchangeably with "retracement" and "correction" in mainstream TA literature. John Murphy, in Technical Analysis of the Financial Markets, cites the 33 to 38 percent retracement area as the first buy zone in an uptrend. Dow Theory teaches that secondary reactions retrace 33 to 66 percent of the primary move, most commonly about 50 percent. The pullback is the tradeable expression of these secondary reactions on a shorter timeframe.
For Indian traders watching TradingView, Zerodha Kite, or Dhan, the practical question is never "is this a pullback or not" in the abstract — it is "does this dip preserve the trend structure enough to justify an entry." The rest of this article answers that question.
Why Pullbacks Happen
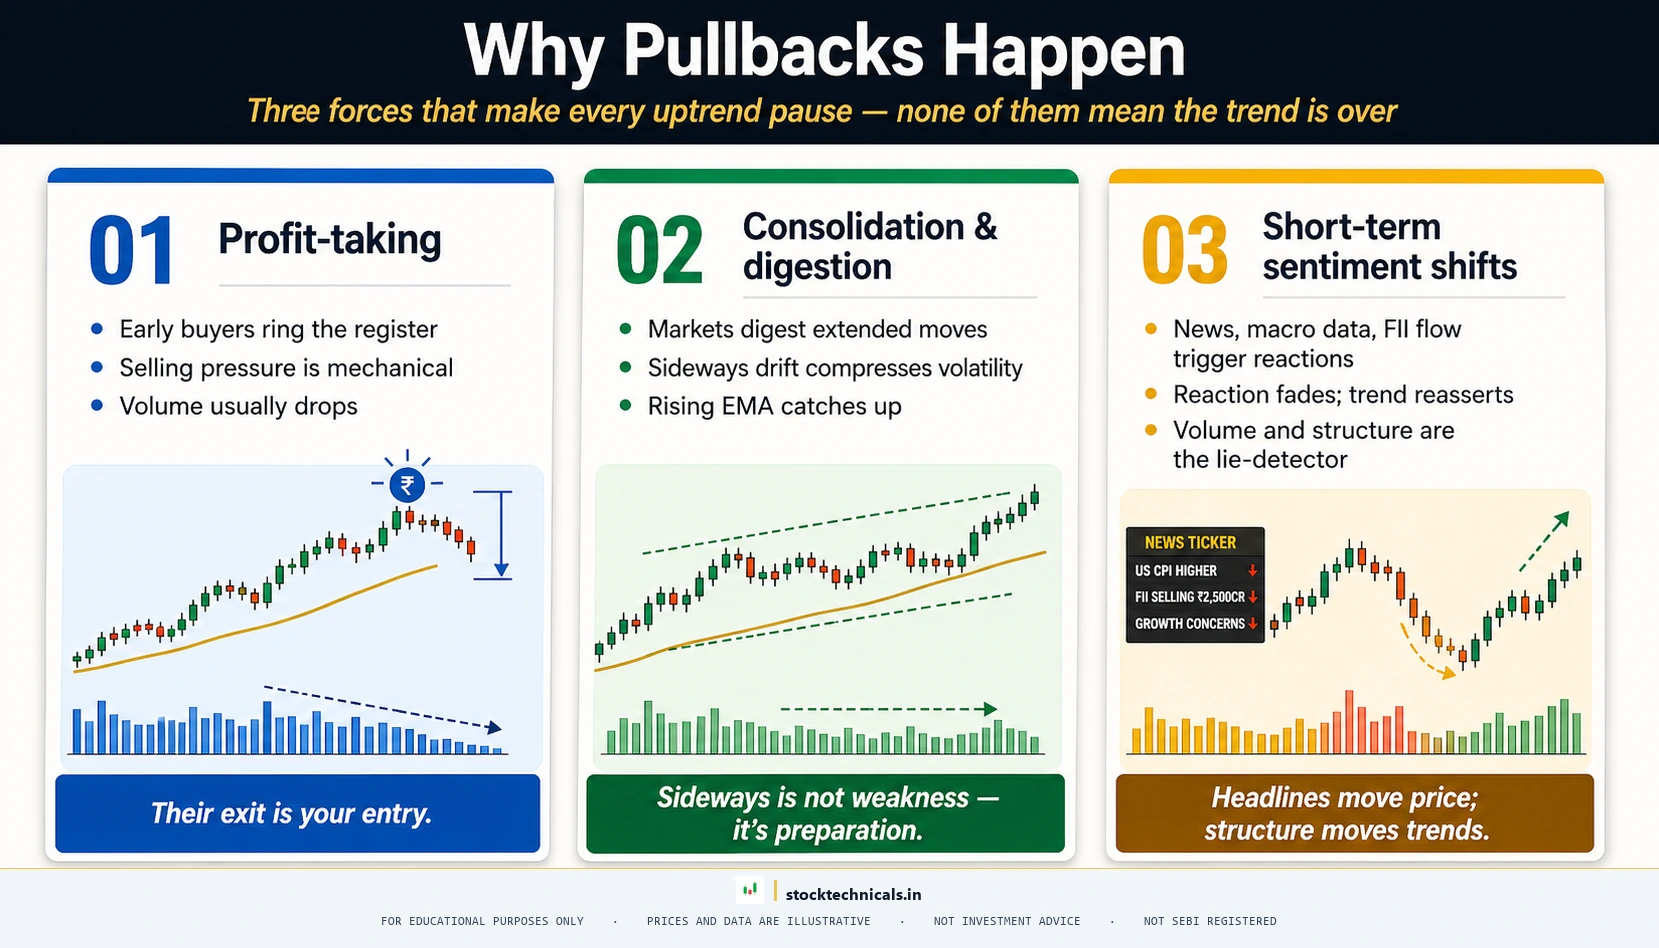
Pullbacks are not random. They happen because three forces overlap at predictable points in a trend: profit-taking, short-term consolidation, and temporary sentiment shifts. Understanding the mechanics helps distinguish a healthy digestion from the start of a reversal.
Profit-Taking
The most common driver. After a sharp 15 to 20 percent rally, early buyers start booking profits on some of their positions. This selling creates the first pullback wave. New buyers who missed the initial move see the dip as an opportunity and step in, absorbing the supply. When the profit-taking exhausts and the fresh demand takes over, the trend resumes. The Reliance pullback in March 2024 is a textbook example — after a 15.43 percent rally from ₹1,305.85 to ₹1,507.40, the stock dipped 5.92 percent over eight trading days as early buyers locked in gains, before finding support at the 50 EMA and climbing back to close at ₹1,485.85 on 28 March after eight trading sessions.
Consolidation and Digestion
Strong rallies stretch price away from moving averages. The 20 EMA rises more slowly than price, so after a vertical move, the gap between price and the EMA widens — the chart starts looking "extended." Pullbacks are how that gap closes. The stock either stalls sideways while the EMA catches up, or dips to touch the EMA directly. Both resolutions reset the setup for another leg higher. Traders call this "mean reversion to the trend."
Short-Term Sentiment Shifts
News, earnings, macro data, and global market moves create short-lived sentiment reversals. A negative RBI policy surprise, a weak US payroll number, or a spike in India VIX can all produce 3 to 7 percent dips in trending stocks, even when the fundamental uptrend story is unchanged. These sentiment-driven pullbacks usually resolve within days once the headline fades and the original drivers reassert themselves. The key tell: sentiment pullbacks are shallow and short, while structural reversals are deep and grinding.
How to Identify a Healthy Pullback

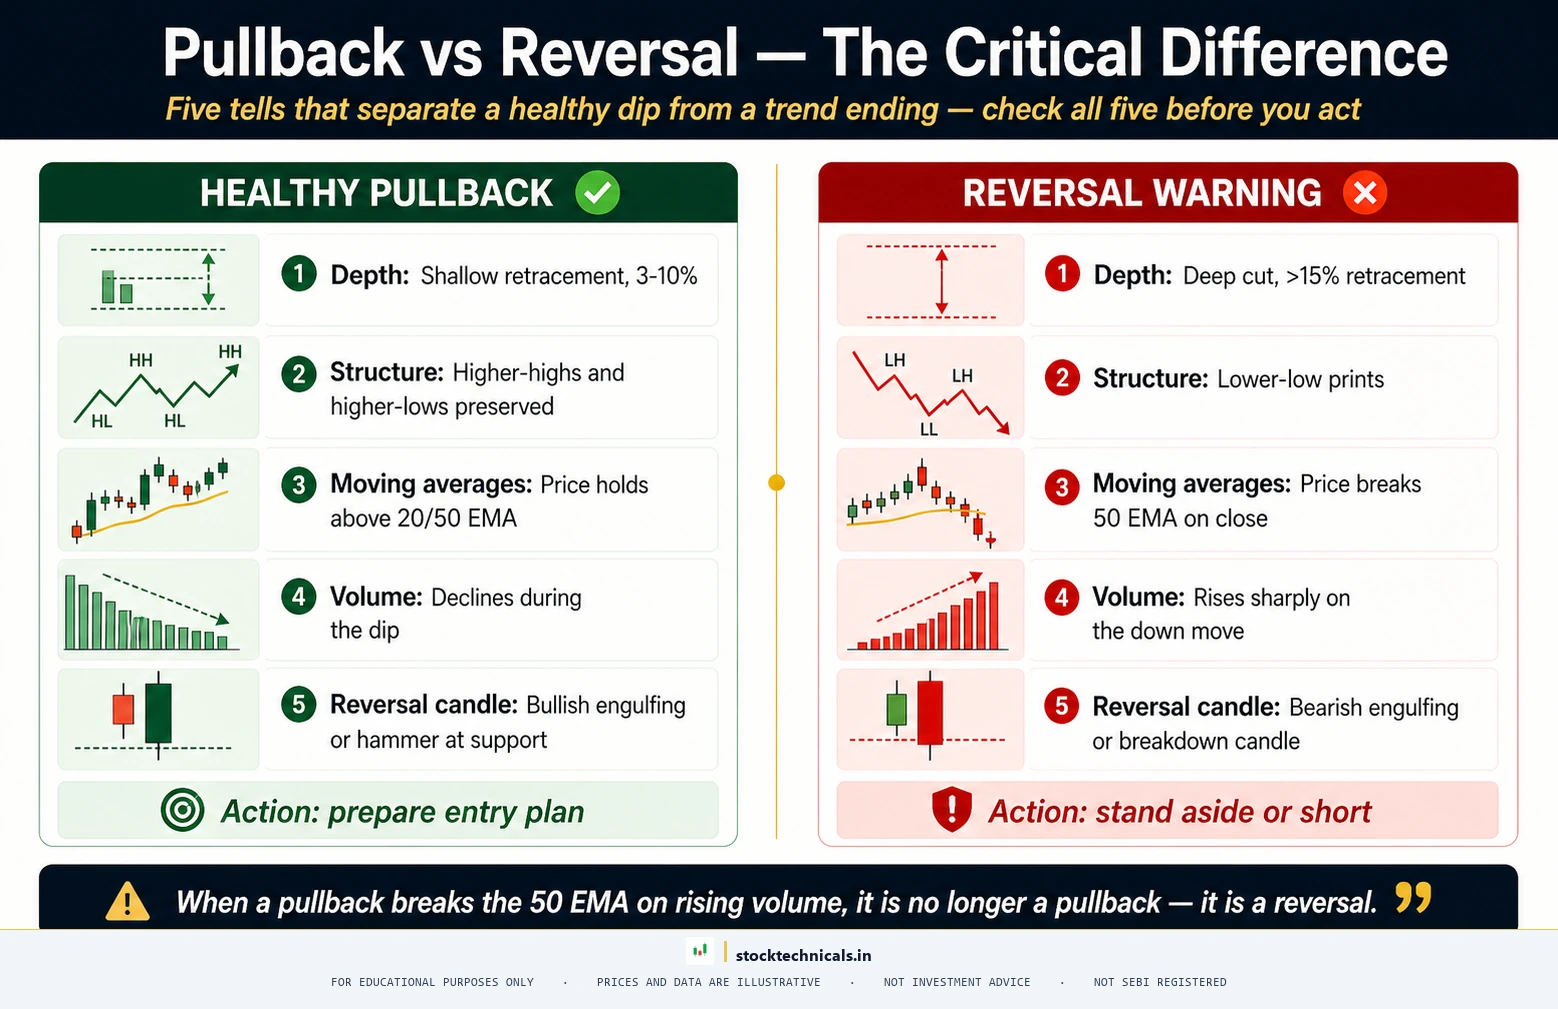
A healthy pullback leaves a clear fingerprint on the chart. Five signals together tell traders whether a dip is worth buying or worth avoiding. Any one or two on their own can be misleading. The weight of evidence matters.
The retracement depth is shallow. Healthy pullbacks in strong trends retrace 3 to 10 percent from the recent swing high. The HDFC Bank Sep-Oct 2019 example above retraced 5.60 percent. The Reliance March 2024 hero retraced 5.92 percent. Both are squarely in the shallow zone. If a pullback exceeds 15 to 20 percent without any bounce attempt, it is no longer behaving like a pullback — treat it as a potential reversal.
Price holds above a key moving average. The 20 EMA is the most common dynamic support in strong momentum trends. The 50 EMA works for medium-term swing setups. The 200 EMA is the long-term regime filter. A pullback that bounces off the 20 or 50 EMA preserves the trend. A pullback that closes below the 50 EMA puts the trend in doubt. For an introduction to exponential moving averages, see the EMA basics guide.
Volume declines on the dip. This is the single clearest signature of a healthy pullback. Rallies happen on rising volume as new buyers step in. Healthy pullbacks happen on fading volume because the selling is profit-taking, not panic. When price dips on below-average volume, it tells traders that sellers are not forcefully distributing — they are simply taking profits. When price dips on rising volume, the opposite is true: institutions are unloading, and the pullback is probably a reversal in disguise. For deeper treatment, see the volume in trading guide.
Structure is preserved. On a trending chart, the uptrend is defined by a sequence of higher highs and higher lows. A pullback is healthy as long as the next swing low sits above the previous swing low. The moment price prints a lower-low below the prior swing, the uptrend structure is broken. That does not always mean a reversal is certain — but it does mean the probability of further downside has risen materially.
A bullish reversal candle appears at the support level. The best entries come when a hammer, pin-bar, or bullish engulfing candle prints at the 20 EMA, 50 EMA, Fibonacci level, or prior breakout zone. This candlestick signal confirms that buyers are stepping in at the support and is the trigger most professional traders wait for before committing capital.
Pullback vs Reversal: The Critical Difference
This is the most important distinction in pullback trading. A pullback is a pause in an uptrend. A reversal is the start of a new downtrend. Confusing the two is how traders blow up accounts.

Here is what a genuine reversal looks like in real time. On December 20, 2022, Adani Enterprises closed at ₹4,038.20 — the highest close of its 2022 rally. The next day the stock closed at ₹3,782.88, down 6.32 percent in a single session. Traders who anchored to the pullback narrative saw a 6 percent dip to the 20 EMA and called it a buying opportunity. It was not. Over the next eight weeks, Adani Enterprises sliced through the 20 EMA, then the 50 EMA, then the 200 EMA. On January 24, 2023, Hindenburg Research published its short-seller report. On 25 January the stock closed at ₹3,285.54. By February 27, 2023, it closed at an absolute low of ₹1,157.08 — a 71.35 percent collapse from the 20 December peak.

Every warning sign of a reversal was on the Adani chart by mid-January 2023, before the Hindenburg report. Volume was rising on the decline, not falling. The stock had already closed below its 20 EMA for multiple sessions. The 50 EMA was broken shortly after. Lower-lows were printing on the daily chart. The only signal missing was the catalyst — which arrived on 24 January and merely accelerated what the chart had already been telegraphing.
The rule: When a pullback breaks the 50 EMA on rising volume, it is no longer a pullback — it is a reversal. Stop looking for an entry, check if you are already long, and exit the position. The pullback thesis is invalidated.
For more on how markets trap traders with false signals, see the guide to false breakouts, bull traps, and bear traps. The mechanics overlap: a failed pullback and a failed breakout are both traps where the initial signal looks bullish but fails to follow through.
Shallow vs Deep Pullbacks
Not every pullback is shallow. Some trending stocks experience deeper dips that still resolve with the trend intact, especially when the rally preceding the pullback was particularly strong. The HDFC Bank chart below shows a 9.47 percent retracement that held because the stock was in a confirmed 23 percent rally and the 50 EMA was directly below the closing low.

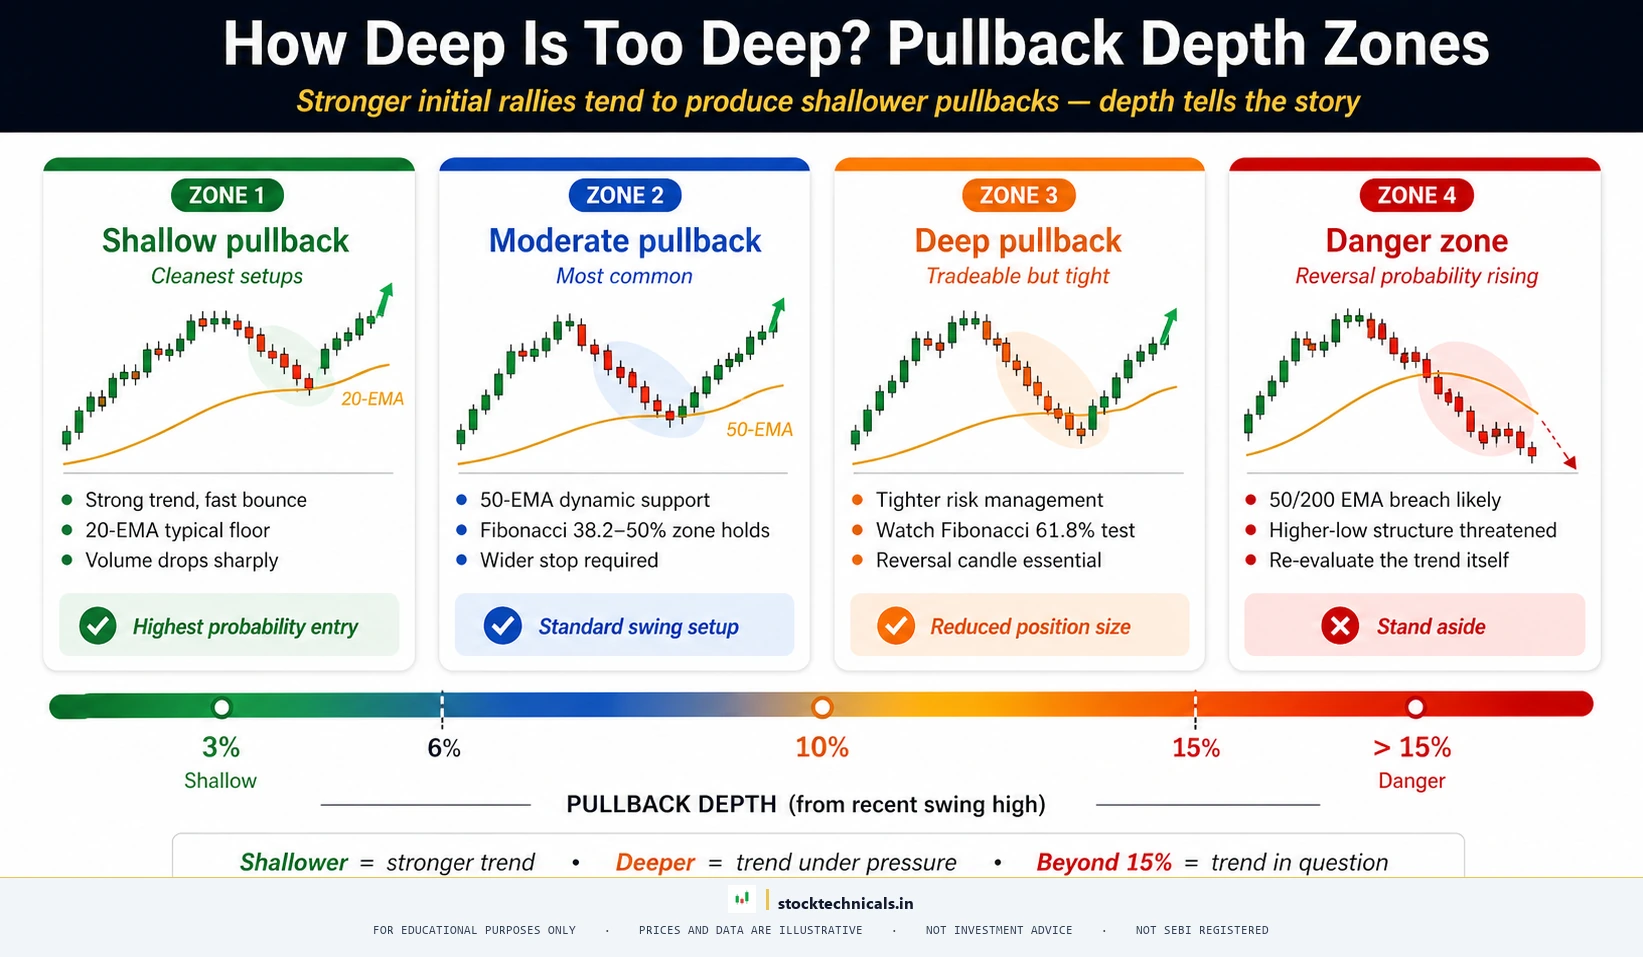
Shallow pullbacks (3 to 6 percent): These are the cleanest setups. They typically retrace to the 20 EMA or the Fibonacci 38.2 percent level, take 5 to 10 trading days, and bounce quickly on a single candle. They are rare but reliable. The HDFC Bank Oct 2019 example (-5.60 percent) and the Reliance Mar 2024 hero (-5.92 percent) are both in this bucket.
Moderate pullbacks (6 to 10 percent): The most common healthy variety. They often test the 20 and sometimes the 50 EMA, retrace to the Fibonacci 38.2 to 50 percent zone, and take 2 to 4 weeks to resolve. The L&T September 2022 example (-8.05 percent) is textbook. These pullbacks give traders more time to prepare an entry.
Deep pullbacks (10 to 15 percent): Still tradeable in strong trends but require tighter risk management. They typically retrace to the 50 EMA or the Fibonacci 50 percent line, take 4 to 8 weeks to complete, and may involve a false bounce in the middle before the final low prints. The HDFC Bank Aug 2024 example (-9.47 percent) sits at the shallow end of this range. Size positions smaller and use a wider stop.
Beyond 15 percent: At this depth the "pullback" label becomes dangerous. A 20 percent retracement is formally a correction. Beyond 25 to 30 percent, the statistical probability of the original trend resuming drops sharply. Do not force the pullback thesis on a chart that has already suffered structural damage.
Pullback Entry Strategies
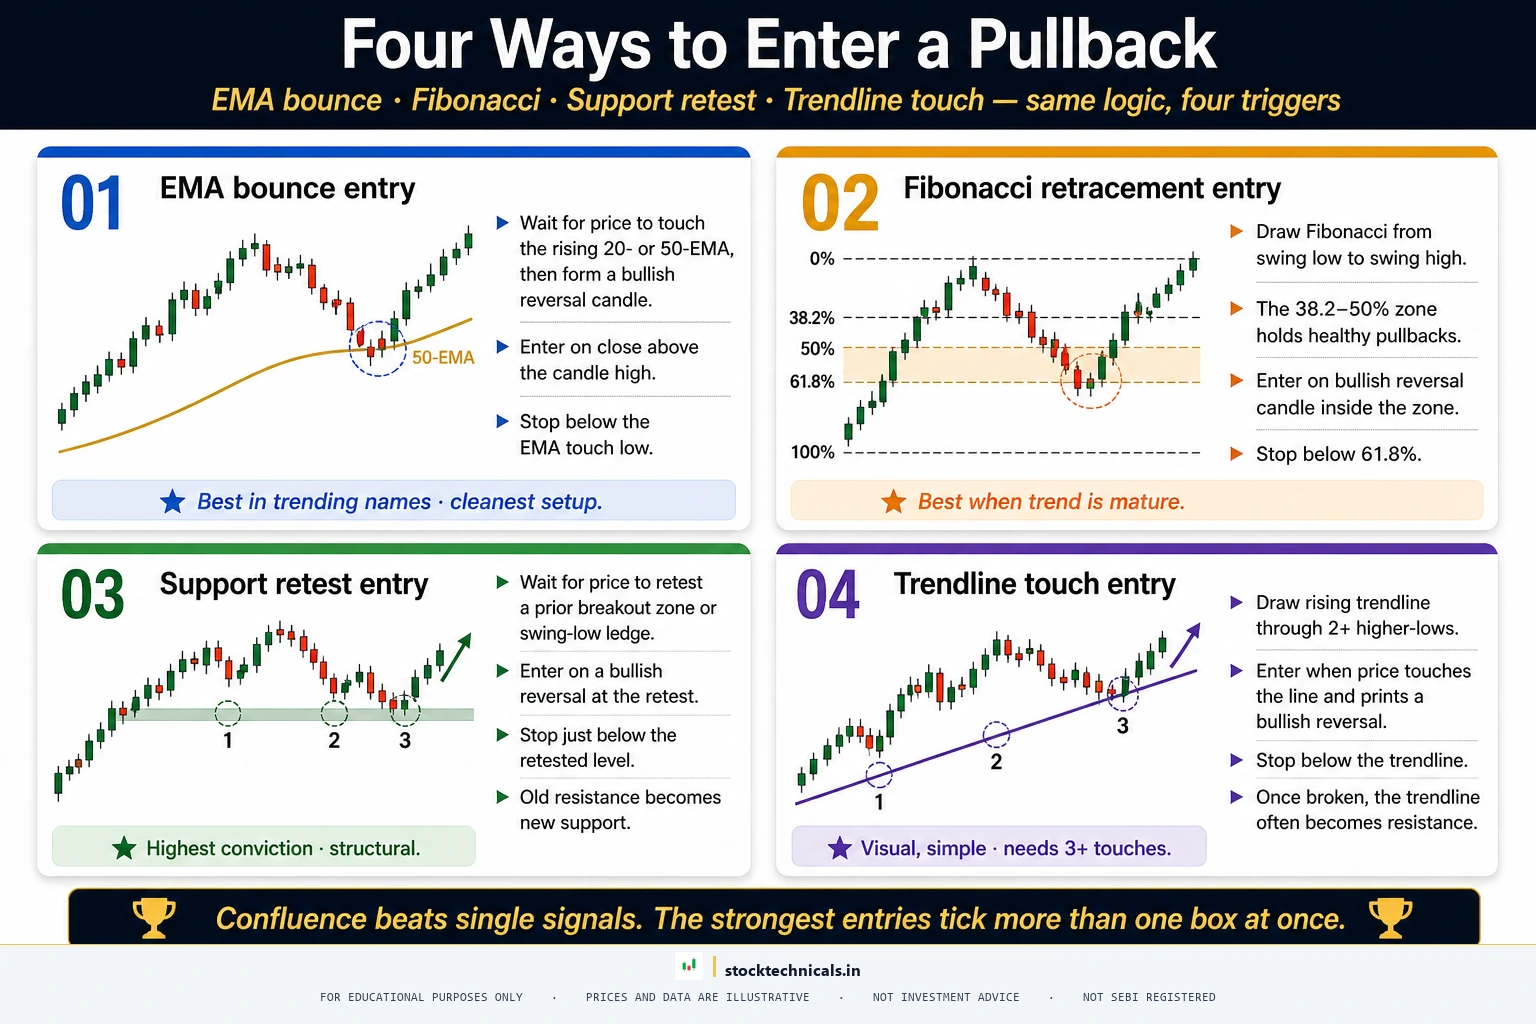
Identifying a pullback is step one. Entering profitably is step two. Four canonical strategies cover the vast majority of real-world pullback setups, each with different strengths and risk profiles.
EMA Bounce Entry
The simplest and most popular approach. Wait for price to touch the 20 EMA (or 50 EMA for slower setups) and then close back above it with a bullish candle. The 20 EMA is the go-to for fast-moving momentum stocks; the 50 EMA suits medium-term swing trades on large-cap names.
When to use: In a confirmed uptrend where price has been consistently respecting the 20 or 50 EMA for at least 4 to 6 weeks. First touches are highest probability because weak hands have not yet been shaken out.
Entry trigger: The first candle that touches the EMA and closes back above it is called the "signal candle." Enter long on the close of the signal candle or on the next-day open.
Stop-loss: Just below the signal candle low or the prior swing low, whichever is closer. The HDFC Bank October 2019 pullback is the textbook example — the closing low of ₹593.45 sat within 0.11 percent of the 20 EMA at ₹594.12, and the stock rallied back to a new closing high of ₹631.85 exactly 31 days later.
Fibonacci Retracement Entry

Fibonacci retracements work because a large number of institutional traders watch the 38.2, 50, and 61.8 percent levels. When enough participants act on the same line, it becomes self-fulfilling support.
To draw a Fibonacci retracement, pick the most recent swing low and the most recent swing high of the current trend. The retracement lines appear at 23.6, 38.2, 50, 61.8, and 78.6 percent. The zone between 38.2 and 50 percent is the "trend-preserving buy zone" for strong uptrends. The 50 to 61.8 percent zone is the "golden zone" for medium-strength trends. Anything below 61.8 percent should be treated as a potential reversal warning.
The L&T September 2022 chart above is one of the cleanest Fibonacci 38.2 percent bounces visible in Indian large-cap data. Rallied 26.88 percent over 46 trading days from ₹1,556.15 on 6 July to ₹1,974.40 on 8 September. Pulled back 8.05 percent over 15 trading days to close at ₹1,815.50 on 29 September — stopping precisely ₹0.87 above the Fibonacci 38.2 percent level at ₹1,814.63. The stock then rallied to a fresh closing high of ₹1,975.05 by 28 October, a 21-trading-day round trip back to the prior peak.
Zerodha Varsity’s official teaching (Karthik Rangappa, Technical Analysis module): "Look for a retracement and buy, which is probably the best way to ride the trend." The methodology emphasises drawing Fib levels from swing-low to swing-high in a confirmed uptrend, waiting for price to land in the 38.2 to 50 percent zone, and entering on the first bullish reversal candle at the level.
Support Retest Entry
When a stock breaks out above a prior resistance level, that level often flips to support on the next pullback. This is the same "polarity flip" concept covered in the guide to support and resistance. The key is that the prior resistance must have been tested at least twice before the breakout to count as valid structural level.
Entry trigger: Price pulls back to the prior breakout level and holds, producing a bullish reversal candle. Enter on the close of the reversal candle.
Stop-loss: Just below the flipped level. If the level fails, the breakout thesis is invalidated and the trade should exit immediately.
Trendline Touch Entry
In trending markets, a trendline drawn beneath the recent swing lows acts as dynamic diagonal support. Pullbacks to the trendline in a confirmed uptrend often produce clean bounces. The trendline must connect at least three prior swing lows to be valid.
Entry trigger: Price touches the trendline and reverses with a bullish candle. The bounce should happen on the first touch; deep breaches of the trendline invalidate the setup.
Stop-loss: Just below the trendline with an ATR-based buffer (typically 1 to 1.5 times the average true range) to avoid getting stopped on normal intraday noise.
Stop-Loss Placement on Pullback Trades
A pullback trade without a stop-loss is a reversal trade that has not realised it yet. The stop-loss is the objective mechanism that forces the trader to exit if the pullback fails to resolve as expected. Three standard placements work across strategies.
Below the reversal candle low. The tightest and most common stop. If the entry is on the close of a bullish reversal candle at the 20 EMA, the stop goes 1 to 3 rupees below the low of that candle, depending on the stock’s normal volatility. Advantages: very clear invalidation level, small loss if wrong. Disadvantage: higher chance of getting stopped on random noise.
Below the prior swing low. A wider stop that accommodates more intraday noise. The prior swing low is the last pivot point in the uptrend before the pullback began. Placing the stop below this level protects the trade until the higher-high / higher-low structure is definitively broken. Advantages: survives most normal pullbacks. Disadvantage: larger loss if the trade fails.
ATR-based stop. More sophisticated traders use the Average True Range (ATR) to calibrate the stop width. A 1.5x ATR or 2x ATR stop below the entry adjusts automatically to the stock’s normal volatility. Quiet, low-volatility stocks get tighter stops; high-volatility momentum names get wider ones. Advantages: adapts to each stock’s personality. Disadvantage: requires the ATR indicator and a rule for the multiplier.
The golden rule: Never widen the stop after entry. Moving a stop closer to lock in profits (a trailing stop) is fine. Moving a stop further away to avoid being stopped is exactly how traders turn small losses into account-ending losses. If the original stop was the correct invalidation level, honour it.
Pullback Trading on Different Timeframes

A pullback on the 5-minute chart is not the same setup as a pullback on the weekly chart. The mechanics are similar, but the scale, duration, and risk parameters are very different.
Intraday (5-minute, 15-minute): Pullbacks last minutes to a few hours. Depth is typically 0.3 to 1 percent. Volume analysis is critical because intraday noise is high. Best suited for experienced day traders using Zerodha Kite with Level 2 data. Retail beginners should avoid this timeframe until they have 6 to 12 months of chart-reading practice.
Daily: The sweet spot for most swing traders. Pullbacks last 5 to 20 trading days, depth 3 to 10 percent, with plenty of time to plan an entry. All four examples in this article (Reliance, HDFC Bank x2, L&T) are daily-timeframe setups. For help picking the right chart window for your style, see timeframes in trading.
Weekly: For position traders holding setups over months. Weekly pullbacks are rare but powerful. Depth scales with the trend strength — a 15 percent weekly dip inside a 95 percent rally is still classified as "shallow." The Tata Steel chart above shows exactly this dynamic. On the weekly timeframe, Tata Steel rallied from ₹36.49 (week ending October 2, 2020) to ₹71.32 (week ending January 8, 2021), a 95.46 percent gain. It then pulled back 15.73 percent over 3 weeks to ₹60.10 on January 29, 2021, before resuming the rally all the way to ₹118.24 by May 7, 2021.
Multi-timeframe alignment: The strongest pullback setups happen when the weekly chart is trending up, the daily chart is in a fresh pullback, and the hourly chart is printing a reversal candle. This is called top-down analysis. The weekly sets the direction. The daily identifies the setup. The hourly times the entry.
Nifty 50 Pullback: Triple Confluence Example
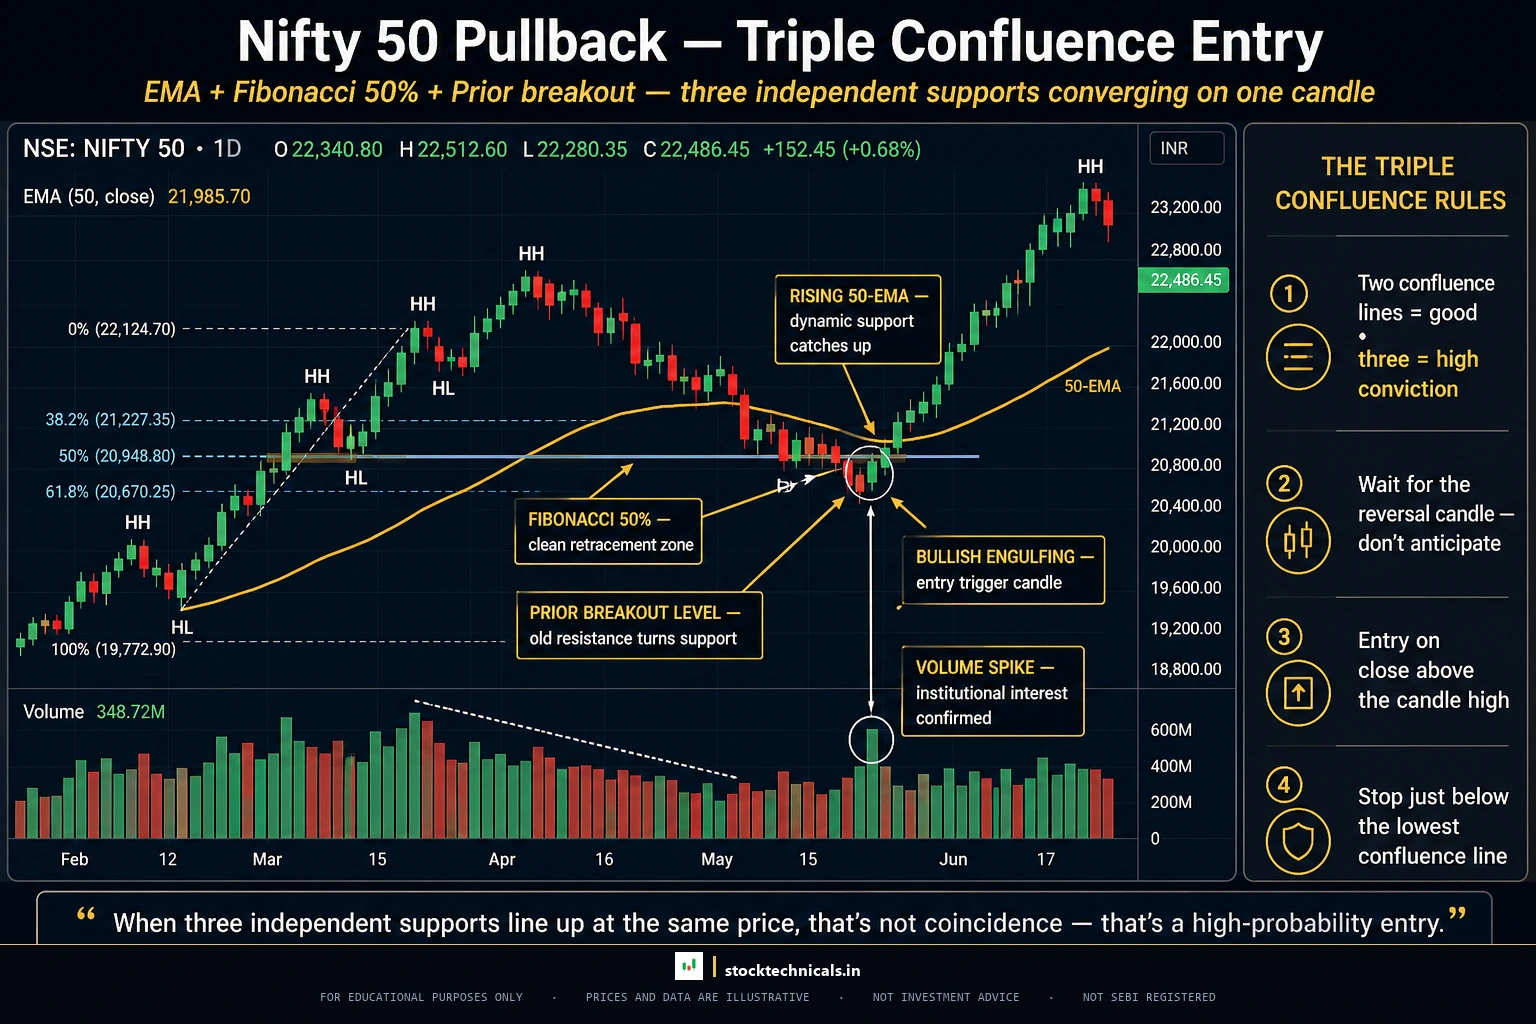
Index pullbacks are easier for beginners to study because they remove single-stock risk. When the Nifty 50 pulls back, the move reflects broad market behaviour rather than company-specific news. The September 2020 Nifty pullback is one of the cleanest structural bounces in recent memory.

On September 24, 2020, the Nifty 50 closed at 10,805.50, exactly where three independent structural levels converged: the Fibonacci 50 percent retracement of the June-September rally (10,847.50), the 200 EMA (10,838.26), and the prior breakout zone from mid-August. The closing low sat within 0.39 percent of the Fib 50 line and 0.30 percent of the 200 EMA. Within seven trading days, the index rallied back to 11,662.40 on October 6, 2020 — a 7.93 percent bounce that invalidated any reversal fears and set the stage for the Diwali breakout to new highs.
The triple confluence lesson: When multiple unrelated levels align on a single candle, the probability of a bounce is much higher than any single level alone. Most of the best pullback entries on Nifty 50 and Bank Nifty happen at confluence points — not at isolated levels. If you can find three of the following on the same candle, the setup is institutional-grade: a moving average (20, 50, 100, or 200 EMA), a Fibonacci retracement (38.2, 50, or 61.8), a prior breakout level, a rising trendline, and a round-number psychological level.
Pullback Patterns: Flags, Pennants, and Wedges
Pullbacks sometimes form specific chart patterns that make the entry and target projection easier. The three most common continuation patterns — flags, pennants, and wedges — are all formalised pullback structures.
Bull flags: After a sharp rally (the "flagpole"), price consolidates in a narrow parallel channel that drifts slightly lower. The flag itself represents a 3 to 7 percent pullback on fading volume. Entry is on the break above the upper flag boundary. Target is the flagpole height projected above the breakout. Classic continuation signal in momentum trends.
Pennants: Similar to flags but the consolidation forms a small symmetrical triangle rather than a parallel channel. Pennants resolve in the original trend direction 70 to 75 percent of the time per historical backtests. The tighter the pennant coils, the more explosive the breakout tends to be.
Falling wedges in uptrends: A mildly bearish-looking pattern where both swing highs and swing lows drift lower within a narrowing range. In the context of a larger uptrend, a falling wedge is a bullish continuation pattern — it represents a multi-week pullback that compresses volatility before the trend resumes. Breakouts above the upper wedge boundary are high-probability pullback entries.
For detailed coverage of each pattern, see the flags and pennants guide and the broader chart patterns hub.
Common Pullback Trading Mistakes
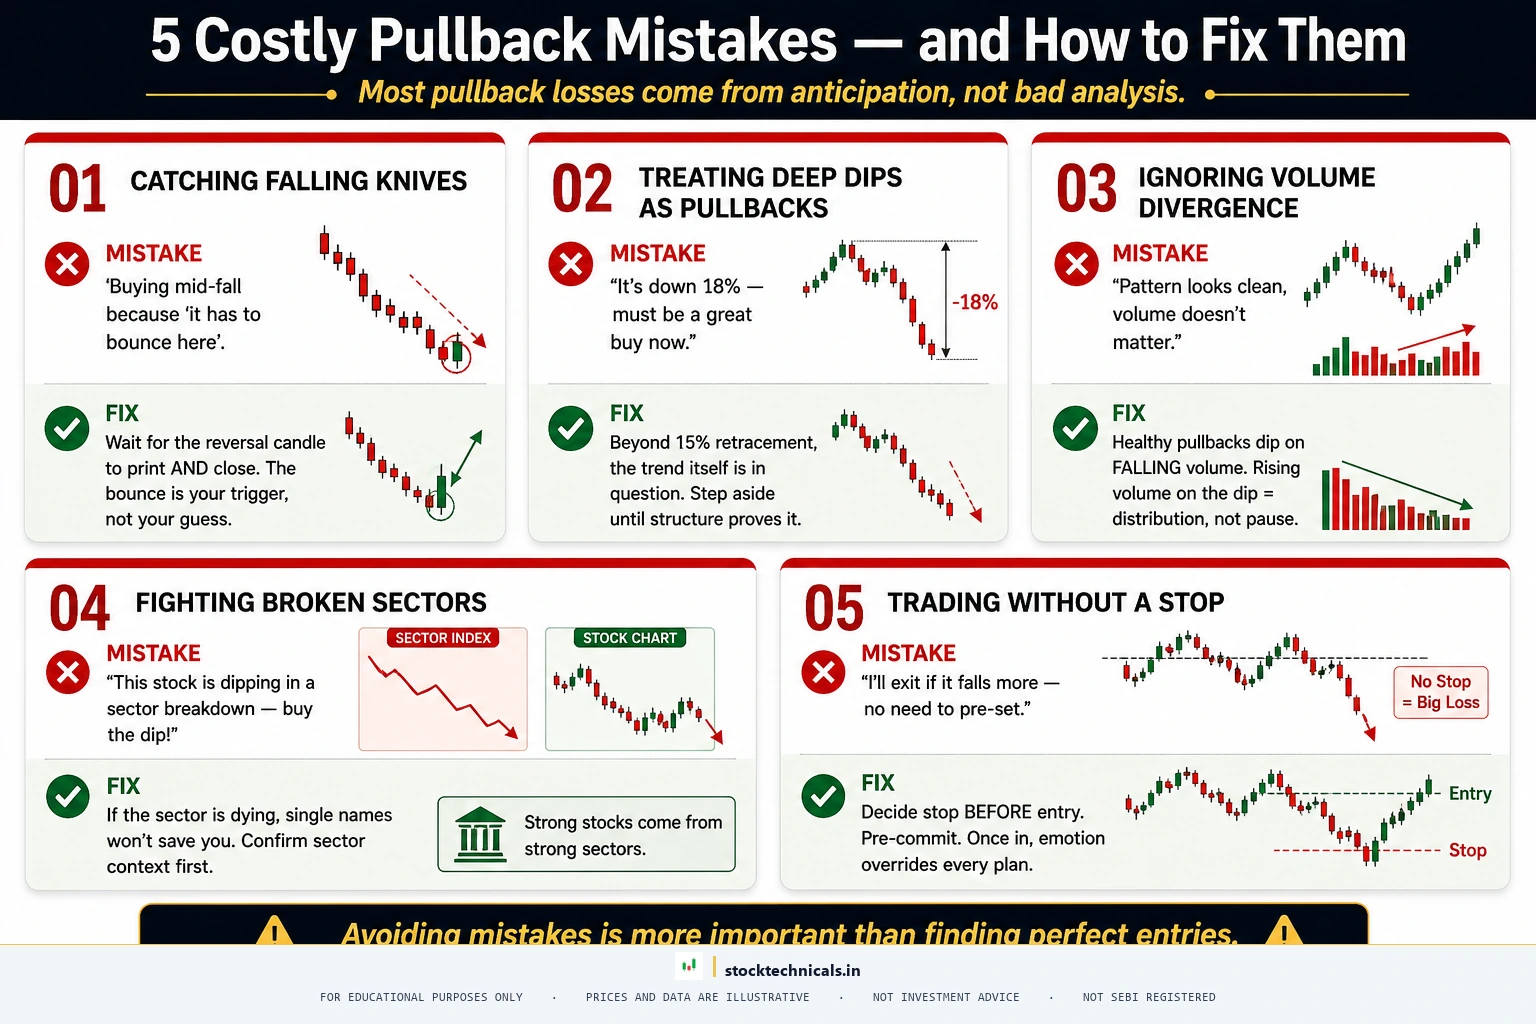

Catching a falling knife. The number one mistake. Buying into a falling stock because "it looks low enough" without waiting for a reversal candle or EMA reclaim. Fix: wait for an actual bullish signal — a hammer candle, a bullish engulfing, or a close back above the 20 EMA on rising volume. Price levels alone are not a signal.
Treating deep dips as pullbacks. When a stock has already retraced 25 to 30 percent, the "pullback" label becomes dangerous. Any dip past Fibonacci 61.8 percent or a clean close below the 50 EMA disqualifies the setup. The probability of the original trend resuming drops sharply past that depth. If you find yourself rationalising a deeper buy, stop and re-read the pullback vs reversal section above.
Ignoring volume. Many beginner traders look at price alone and never check whether volume is rising or falling. Rising volume on a dip is distribution — institutions unloading into retail bids. Declining volume on a dip is accumulation — supply drying up while price consolidates. Knowing the difference is the line between a winning pullback trader and a losing one.
Fighting a broken sector. Buying a stock pullback while the sector index and Nifty 50 are both breaking lower. Context matters more than isolated setups. If the pharma index is in a downtrend, buying a pharma pullback requires that stock to swim against the current. The success rate is materially lower. Filter pullback candidates first by sector strength, then by individual chart.
No predefined stop-loss. Entering a pullback trade without a hard stop below the reversal candle or swing low. Gambling, not trading. Set the exit level before entry. Respect it without exception. A stop can always be tightened as the trade moves in your favour, but it must never be widened.
Pullback Trading Checklist
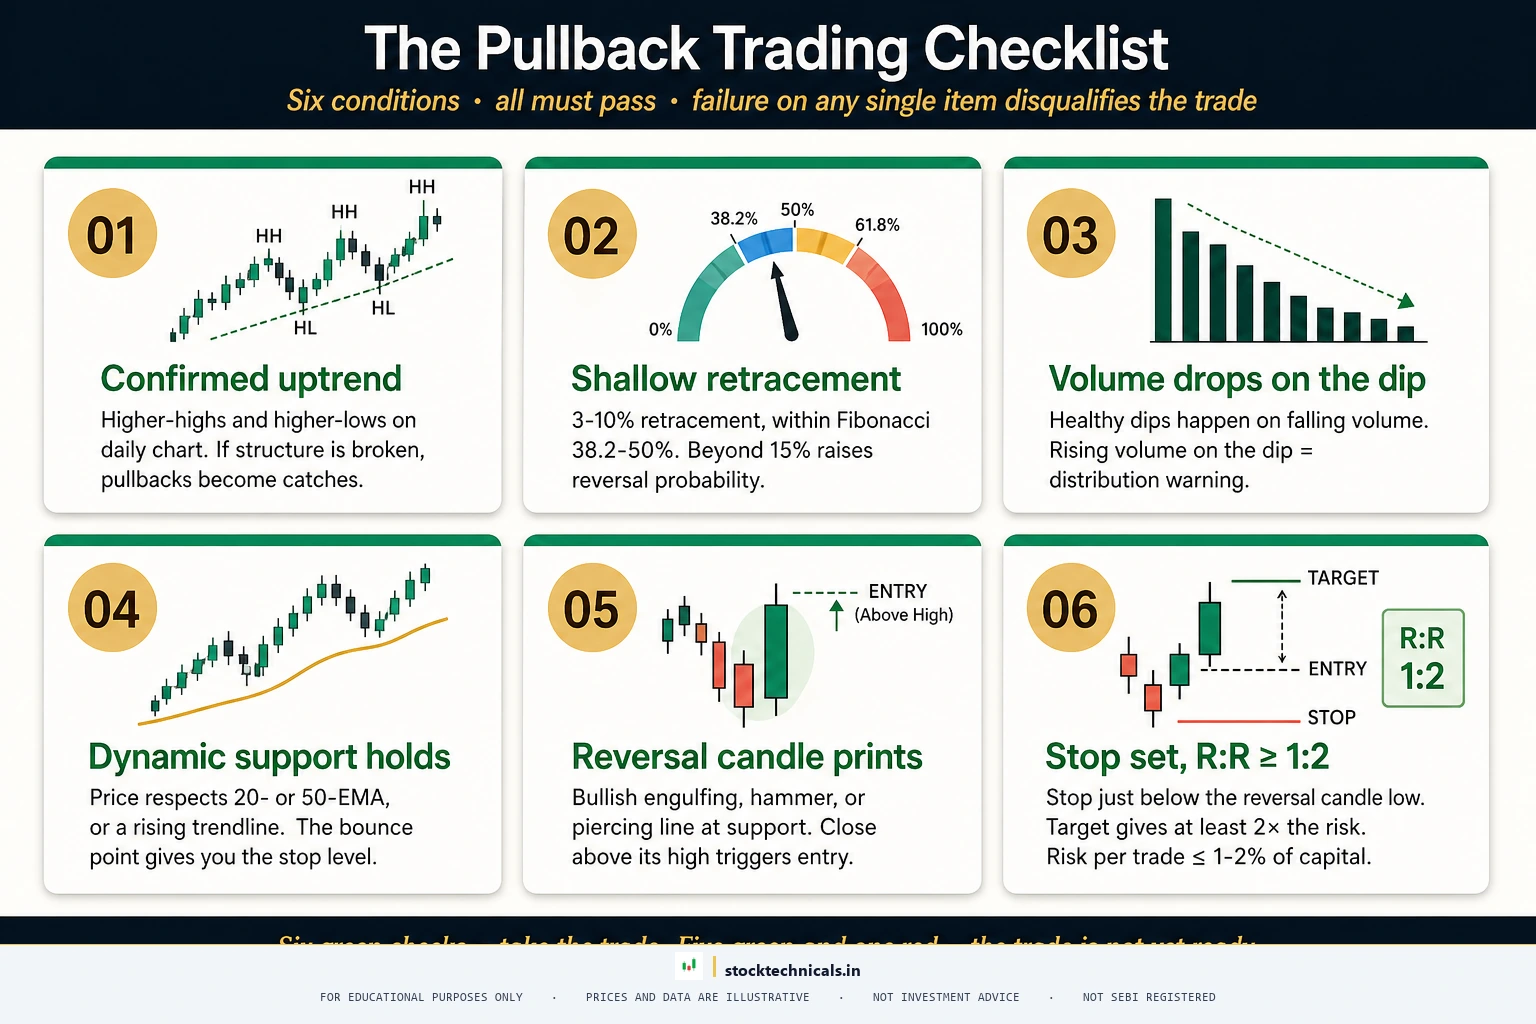

- Clear uptrend: Is the stock making higher highs and higher lows with price above the 50 EMA for at least 4 to 6 weeks?
- Shallow depth: Has the pullback retraced between 3 and 10 percent, staying within the Fibonacci 38.2 to 50 percent zone?
- Volume declining: Is volume fading on the dip, not spiking?
- Dynamic support: Is price testing the 20 or 50 EMA, a rising trendline, or a prior breakout zone?
- Bullish reversal candle: Is a hammer, pin-bar, or bullish engulfing printing near the support level?
- Stop-loss defined: Is the risk-reward ratio at least 1:2 with the stop below the reversal candle low?
If any item on this checklist fails, do not take the trade. Wait for a better setup. Half the work in pullback trading is the no-trade discipline — recognising when the evidence is not strong enough.
Interactive Tool: Pullback Validator
Paper-trading alone will not teach judgment. Use the Pullback Validator below to grade a live setup you are watching. Answer five questions about depth, dynamic support, volume behavior, trend structure, and the reversal candle — the tool returns an A/B/C/F rating plus specific next actions.
Pullback Validator
The Core Idea
A pullback is a temporary price dip within an ongoing uptrend — the market catching its breath before continuing. Healthy pullbacks retrace 3–10%, hold dynamic support (20 or 50 EMA), and resolve with the trend intact. The key test: structure must be preserved.
Grade Your Setup
Answer each question about the pullback you are considering. The validator scores across depth, dynamic support, volume behavior, trend structure, and reversal candle strength.
Test Your Pullback Knowledge
Five questions. Pick the best answer. Score 4 or 5 to pass.
How to Practice Pullback Trading
TradingView offers a bar replay feature that lets traders scroll back in time and advance candles one by one. Load a chart, go back 6 months, and practice identifying pullback setups before seeing the outcome. Track every identification in a journal with screenshots.
Pull up the daily charts of Reliance, TCS, HDFC Bank, Infosys, L&T, and Titan. Go back 3 to 5 years. Identify every pullback that bounced off the 20 or 50 EMA. Measure the retracement depth, the bounce duration, and the eventual new high. This exercise teaches more about pullback behavior than any theoretical article — including this one.
Chartink offers 10+ pre-built pullback scanners for NSE stocks, including "20 EMA pullback," "9-20 EMA pullback," and "pullback above 20 EMA from 50 EMA." Filter by market cap, daily turnover above ₹50 crore, and price above 200 EMA to get a clean universe of trending names in daily pullback mode. Set up TradingView alerts on the resulting watchlist so the screen tells you when to look.
The Bottom Line About Pullback Trading
Pullback trading looks simple on historical charts. Every successful pullback looks obvious in hindsight. In real time it is emotionally hard — because at the exact moment the trade sets up, the stock is falling and the news is scary.
The uncomfortable reality: even with perfect EMA alignment and textbook volume behavior, a meaningful share of pullback entries still fail. The stock breaks the level, stops you out, and sometimes reverses into a full trend change. This is not a flaw in the strategy — it is the cost of doing business. The key is that the winning pullback entries produce profits that significantly exceed the losses from the failed ones, but only if the stop-loss discipline is absolute. Widening a stop on a failing pullback is the fastest way to turn a small loss into an account-ending loss.
Markets reward patience. Capital lost is gone. Trade only what the chart confirms, never what emotions demand. Per the latest SEBI study, 91 percent of individual equity F&O traders lost money in FY24-25 with aggregate net losses of ₹1.06 lakh crore — position sizing and stop-losses are not optional.
Real Talk: No chart pattern, indicator, or strategy works 100 percent of the time. The SEBI study showing 91 percent of F&O traders lost money in FY24-25 with aggregate net losses of ₹1.06 lakh crore is not a scare tactic — it is a filter. Most of that 91 percent traded without a stop-loss, sized positions too large, or confused reversals for pullbacks. Risk no more than 1 to 2 percent of capital per trade. Keep a trading journal. The market rewards patience and discipline — not speed or boldness.
| Pullback depth | Strength reading | Trade response |
|---|---|---|
| 38% of prior leg | Healthy continuation | Buy with confirmation |
| 50% of prior leg | Standard pullback | Wait for reversal candle |
| 62% of prior leg | Trend at risk | Reduce size + tight stop |
| Beyond 78% | Trend likely failed | Stay flat — re-evaluate |
“It never was my thinking that made the big money for me. It always was my sitting.”
— Jesse Livermore, Reminiscences of a Stock Operator
What is the difference between a pullback and a reversal?
A pullback is a temporary price decline within an ongoing uptrend that preserves the higher-high higher-low structure, typically retraces 3 to 10 percent, happens on declining volume, and resolves with the trend intact. A reversal breaks that structure – price closes below the 50 EMA on rising volume, lower-lows start printing, and the stock fails to reclaim prior support. The Adani Enterprises collapse from Rs 4,038.20 on December 20, 2022 to Rs 1,157.08 on February 27, 2023 is a classic example of a pullback that turned into a 71 percent reversal.
How deep can a healthy pullback be?
Healthy pullbacks typically retrace 3 to 10 percent from the swing high, staying within the Fibonacci 38.2 to 50 percent zone. Stronger trends produce shallower pullbacks (3 to 6 percent, holding the 20 EMA). Moderate trends produce 6 to 10 percent pullbacks to the 50 EMA. Any retracement beyond 15 percent requires careful review – and beyond 25 percent the pullback label becomes dangerous because the probability of trend resumption drops sharply.
Which moving average is best for pullback support?
The 20 EMA works best for fast-moving momentum stocks in strong trends – HDFC Bank bounced within 0.11 percent of its 20 EMA on October 7, 2019. The 50 EMA is better for medium-term swing setups – HDFC Bank held its 50 EMA within 0.44 percent in August 2024 and Reliance held its 50 EMA within 0.21 percent in March 2024. The 200 EMA works for long-term position traders. Choose the EMA based on your holding period and the stock’s historical behaviour.
Where should the stop-loss go on a pullback trade?
The tightest placement is just below the bullish reversal candle low – the candle that confirms the bounce at support. A wider alternative is just below the prior swing low, which accommodates more intraday noise. Some traders use an ATR-based stop at 1.5 to 2 times the stock’s average true range below entry. The critical rule is to define the stop before entry and never widen it after the trade is open.
Why is volume important for pullback confirmation?
Volume tells traders whether a dip is profit-taking or distribution. Healthy pullbacks tend to unfold on volume at or below the rally average because the selling is early-buyer profit-booking, not panic. Reversals occur on rising volume because institutions are unloading positions into retail bids. HDFC Bank in October 2019 pulled back while daily volume stayed roughly level with the preceding rally, indicating no distribution. By contrast, Adani Enterprises volume surged 10 to 20 times normal in late January 2023 during the Hindenburg-led collapse – the clearest distribution signal on any large-cap NSE chart. Volume often distinguishes a pullback from a reversal days before the chart structure confirms it.
What Fibonacci levels matter most for pullback entries?
The 38.2 percent level is the first buy zone in strong trends, representing a shallow retracement. The 50 percent level is where moderate pullbacks often stop, a Dow Theory observation more than a true Fibonacci number. The 61.8 percent level is the golden ratio and the last line of defense – pullbacks deeper than 61.8 percent frequently turn into reversals. L&T stopped within Rs 0.87 of its Fib 38.2 level on September 29, 2022, a textbook shallow-pullback bounce.
Can pullback trading be used on intraday timeframes?
Yes, but it is significantly harder for beginners. Intraday pullbacks on 5-minute and 15-minute charts last minutes to hours, with depths of 0.3 to 1 percent, and require fast decision-making with high-quality real-time data. Most retail traders are better served by daily-timeframe pullbacks that give 5 to 20 trading days to plan each entry. Weekly timeframes are even better for position traders, where a 15 percent dip inside a 95 percent rally can still be classified as shallow – as Tata Steel demonstrated in January 2021.
What percentage of pullback trades are expected to fail?
A meaningful share of pullback entries still fail even when the chart setup looks textbook. This is not a flaw – it is the cost of doing business. The strategy works profitably only because the winning pullback trades produce profits that significantly exceed the losses from the failed ones, and only when the stop-loss discipline is absolute. Widening a stop on a failing pullback is the fastest way to turn a small loss into an account-ending loss. Beginners should track their own pullback win rate in a trading journal for at least 20 trades before drawing conclusions about edge.
Continue Learning
- What is a Breakout? — The natural companion to pullback trading
- What is a Trend? — Context for why pullbacks matter
- Trendlines — Diagonal levels for trendline-bounce entries
- Support and Resistance: The Complete Guide — Horizontal levels where pullbacks often stop
- EMA Basics — The dynamic support tool used in every pullback setup
- Volume in Trading — The confirmation signal that separates pullbacks from reversals
- False Breakouts and Traps — How the market fakes continuation signals
- Timeframes in Trading — Choose the right window for your pullback style