Quick Answer: A false breakout occurs when price breaks a key level but immediately reverses, trapping traders on the wrong side. A bull trap breaks above resistance then drops. A bear trap breaks below support then rallies. Confirm breakouts by waiting for a candle close beyond the level with strong volume.
Key Takeaways

Chart data: Evergreen reference · Last reviewed April 17, 2026
- A FALSE BREAKOUT occurs when price moves past a support or resistance level but fails to sustain the move and reverses — trapping traders on the wrong side
- BULL TRAPS are false breakouts above resistance; BEAR TRAPS are false breakouts below support — both follow the same 5-phase anatomy
- Volume is the single most reliable filter: genuine breakouts show 1.5x+ the 20-period average volume; below-average volume breakouts are high-probability false breakouts
- Two profitable strategies: fade the false breakout (trade against the failed move) or wait for reentry (trade the range after the breakout fails)
- The confirmation method — waiting for 2+ candle closes beyond a level with above-average volume — eliminates the majority of false breakout losses
A FALSE BREAKOUT happens when price moves past a key support or resistance level, triggers entries, and then reverses sharply — trapping traders on the wrong side of the move. According to various market studies, an estimated 60-70% of all breakouts fail. That single statistic explains why so many traders who follow “buy the breakout” advice end up losing money consistently.
False breakouts are not random noise. They are the direct result of institutional order flow, stop hunting, and liquidity imbalances. Understanding why they happen, how to identify them in real time, and how to either avoid or profit from them is one of the most valuable skills a trader can develop.
This article breaks down the mechanics of false breakouts with real NSE examples, actionable volume filters, and two trading strategies that turn these traps into opportunities.
What is a False Breakout?

Chart data: Evergreen reference · Last reviewed April 17, 2026
A FALSE BREAKOUT occurs when price breaks through a defined support or resistance level but fails to sustain the move and reverses back through the level. The “breakout” was real in the sense that price did cross the level — but the follow-through was absent.
The key distinction: a genuine breakout sees price move decisively past a level, hold above or below it on closing basis, and continue in the breakout direction with expanding volume. A false breakout does the opposite — it lures traders in, then reverses, often violently.
False breakouts come in two forms:
- BULL TRAP — Price breaks above resistance, attracting buyers. Then it reverses sharply downward, trapping those buyers at higher prices.
- BEAR TRAP — Price breaks below support, triggering short sellers and panic selling. Then it reverses upward, trapping sellers at lower prices.
Both traps share the same underlying mechanism: insufficient conviction behind the initial move. The breakout lacks the volume, momentum, or institutional participation needed to sustain it.
Anatomy of a False Breakout

Chart data: Evergreen reference · Last reviewed April 17, 2026

Chart data refreshed on April 17, 2026 · Source: NSE (daily OHLC)
Every false breakout follows a recognizable sequence. Understanding this anatomy helps traders spot them before getting trapped.
Phase 1: The Setup. Price consolidates near a well-defined support or resistance level. The longer the consolidation, the more significant the eventual breakout — or false breakout — becomes. Traders on both sides are watching the same level, building positions and setting stop losses around it.
Phase 2: The Trigger. Price breaks through the level. This move triggers pending orders — buy stops above resistance or sell stops below support. The initial burst of volume comes largely from these triggered orders, not from fresh institutional buying or selling.
Phase 3: The Exhaustion. After the initial spike, volume drops. Price stalls. The candle that broke the level may show a long wick (also called a shadow) back toward the level — a sign of rejection. There is no follow-through from larger participants.
Phase 4: The Reversal. Price moves back through the level with conviction. Traders who entered on the breakout are now underwater. Their stop losses, clustered just below the breakout level, start getting hit. This creates a cascade of selling (for bull traps) or buying (for bear traps) that accelerates the reversal.
Phase 5: The Continuation. The reversal often extends well beyond the original breakout level. This is because the trapped traders’ stop losses provide fuel for the opposing move. A failed bullish breakout frequently becomes a strong bearish move, and vice versa.
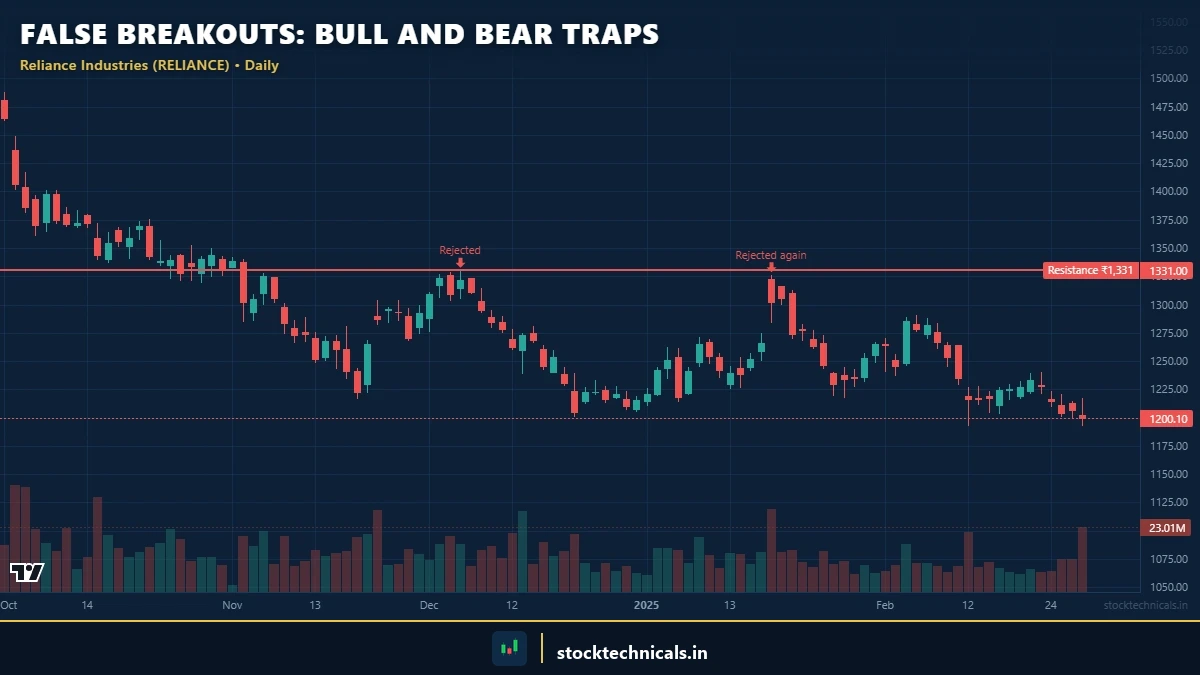
Bull Traps Explained

Chart window: evergreen · Data refreshed April 17, 2026 · Source: NSE (daily OHLC)
A BULL TRAP is a false breakout above a resistance level. Price pushes above resistance, convincing traders that a bullish move has begun. Buyers enter long positions. Then price reverses, trapping those buyers with losses.
How Bull Traps Form
Bull traps typically form at these locations:
- Horizontal resistance levels — Previous swing highs, round numbers like Nifty 22,000 or 23,000
- Trendline resistance — The upper boundary of a descending channel or falling wedge
- Moving average resistance — Price breaks above the 200-day EMA briefly, then falls back below it
- Gap-fill levels — Price fills a gap and reverses at the gap boundary
The mechanics are straightforward. Resistance levels have stop losses clustered just above them — buy stops from short sellers and buy orders from breakout traders. When price touches these stops, it creates a burst of buying that pushes price above resistance temporarily. But if there is no genuine institutional buying behind the move, the spike fades. Large players may even use this liquidity spike to sell into — they need breakout buyers to absorb their sell orders.
Warning Signs of a Bull Trap
- The breakout candle has a long upper wick and closes near the level (not well above it)
- Volume on the breakout candle is below average or declining
- RSI is already in overbought territory (above 70) when the breakout occurs
- The breakout happens on a low-volume session (holiday-shortened or late Friday)
Bear Traps Explained
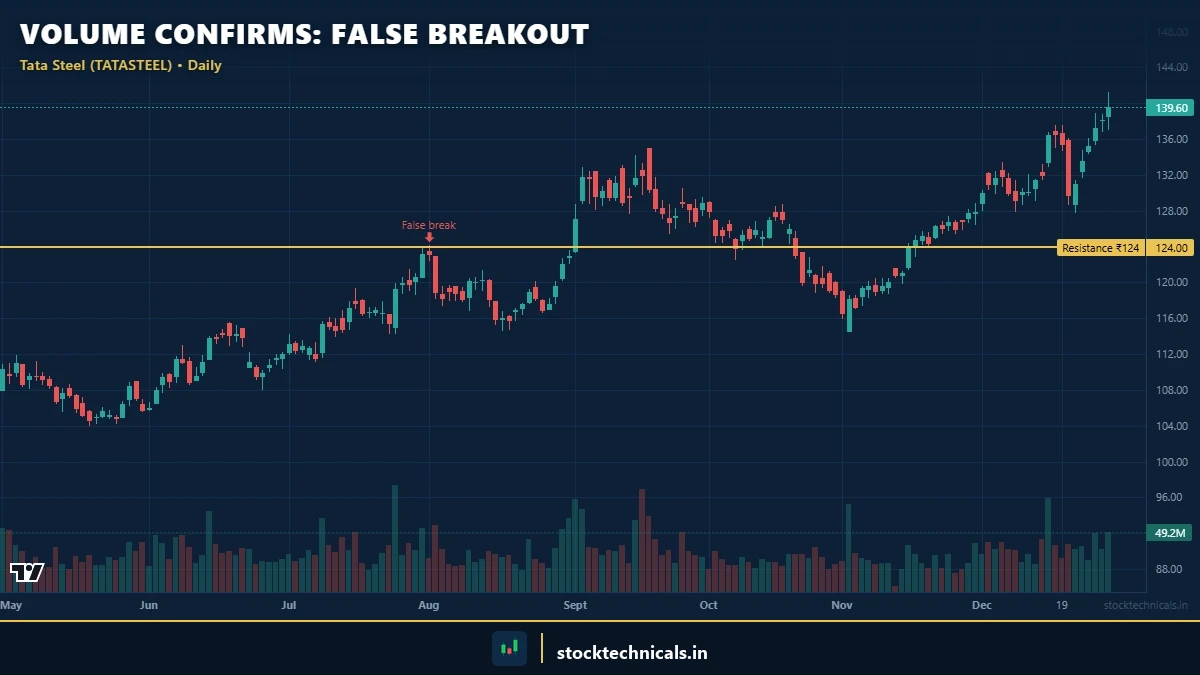
Chart window: evergreen · Data refreshed April 17, 2026 · Source: NSE (daily OHLC)

Chart data refreshed on April 17, 2026 · Source: NSE (daily OHLC)
A BEAR TRAP is the mirror image of a bull trap. Price breaks below a support level, triggering sell orders and panic. Then price reverses sharply upward, trapping short sellers.
How Bear Traps Form
- Horizontal support levels — Previous swing lows, psychologically important round numbers
- Trendline support — The lower boundary of an ascending channel
- Moving average support — A brief dip below the 50-day or 200-day EMA that does not sustain
- Previous breakout levels — The level where support becomes resistance and price retests from above
Why False Breakouts Happen

Chart window: evergreen · Data refreshed April 17, 2026 · Source: NSE (daily OHLC)
False breakouts are not accidents. They occur for specific, identifiable reasons.
Stop Hunting
Large institutional traders and market makers can see where retail stop losses are clustered — just above resistance and just below support. These clusters represent liquidity. To fill large sell orders, institutions need buyers. What better source of buying than triggered buy stops above resistance?
Lack of Follow-Through
Sometimes the breakout is genuine in intent but fails because there is simply not enough buying or selling pressure to sustain it. The initial break triggers stop orders, but no fresh buying follows.
Low Volume Environments
False breakouts happen more frequently during pre-market hours, holiday-shortened weeks, lunch hours (12:00-1:00 PM IST on NSE), and expiry weeks when options activity distorts price action.
News-Driven Spikes
A sudden news headline — an RBI policy surprise, a corporate announcement, global event — can push price past a level on pure emotion. Once the initial reaction fades and the market digests the news, price often reverses back.
How to Identify False Breakouts
Interactive Tool: Grade Any Breakout (and Spot False Ones)
A false breakout is a failed breakout — it fails the same five validation tests a genuine breakout passes. Enter your setup’s volume, close position, candle body, trend alignment, and retest behaviour below. The tool grades the breakout A/B/C/F. A low grade with the price already beyond the level means you are likely looking at a bull or bear trap.
Breakout Validator
The Core Idea
A breakout is when price moves decisively beyond a defined support or resistance level with volume confirmation. The broken level flips its role — old resistance becomes new support.
Grade Your Setup
Answer each question about the breakout you are considering. The validator scores across volume, candle structure, trend alignment, level quality, and retest behavior.
Test Your Breakout Knowledge
Five questions. Pick the best answer. Score 4 or 5 to pass.

Chart data refreshed on April 17, 2026 · Source: NSE (daily OHLC)
Identifying a false breakout in real time requires multiple confirmation filters, not just one signal.
Volume Analysis — The Most Reliable Filter
Volume is the single most reliable indicator of breakout quality. A genuine breakout should occur with volume that is significantly higher than the average of the previous 10-20 sessions.
The volume filter rule: If the breakout candle’s volume is less than 1.5x the 20-period average volume, treat it with suspicion. If volume is below average, it is a strong false breakout warning.
Candle Close vs Wick
The close of the breakout candle matters more than the high or low. A candle that breaks above resistance but closes back below the level is not a breakout — it is a rejection. The candle must CLOSE beyond the level, not just wick past it.
RSI Divergence at the Breakout
When price breaks to a new high but RSI is making a lower high, that bearish divergence signals weakening momentum. A breakout accompanied by RSI divergence has a higher probability of failing.
The Time Filter
A genuine breakout sustains for at least 2-3 candles on the trading timeframe. On a 15-minute chart, wait for at least two consecutive candles to close above the level before entering. On a daily chart, many professional traders wait for two consecutive daily closes.
Waiting for Confirmation
The simplest way to avoid false breakouts: do not trade the initial break. Wait for confirmation.
The Close-Above-Close-Below Method
Instead of entering the moment price crosses a level, wait for the breakout candle to close above resistance (or below support), the next candle to also close in the breakout direction, and volume on both candles to be above average. This method will miss some genuine breakouts that move fast — and that trade-off is acceptable. Missing a trade costs nothing; getting trapped in a false breakout costs real capital.
The Retest Method
Many genuine breakouts pull back to the broken level before continuing. This pullback creates an ideal entry: price breaks above resistance with good volume, pulls back toward the broken resistance (which should now act as support — role reversal), and bounces off the new support with a bullish candle. If price does not hold the retest and falls back below the level, the breakout was false and the trader avoids the trap entirely.
False Breakout Trading Strategies
Once a trader can identify false breakouts, two strategies turn these patterns into profit opportunities.
Strategy One: Fade the False Breakout
FADING means trading against the false breakout — going short after a failed bullish breakout, or going long after a failed bearish breakdown.
Entry rules for fading a bull trap: Price breaks above resistance. The breakout candle closes with a long upper wick near or below the resistance level. Volume is below average. The next candle closes back below resistance — this confirms the false breakout. Enter short on the close of the confirmation candle. Stop loss above the false breakout high plus 0.2% buffer. Target: next support level or minimum 1:2 risk-reward.
Strategy Two: Wait for Reentry
This strategy waits for price to return to the pre-breakout range and then trades toward the opposite boundary. A failed bullish breakout often leads to a bearish move. Instead of fading at the breakout level, wait for price to reenter the range and target the opposite end (the support side).
Volume Filters That Actually Work
Volume is mentioned repeatedly in this article because it is the single best tool for distinguishing real breakouts from false ones.
The 1.5x Average Volume Rule
Calculate the 20-period simple moving average of volume. For a breakout to be considered genuine, the breakout candle’s volume must be at least 1.5x this average. On TradingView, overlay the Volume SMA indicator with a 20-period setting.
Volume Climax vs Volume Divergence
A VOLUME CLIMAX on the breakout candle (3x+ average volume) with price stalling or reversing is actually a warning sign — this extreme volume often represents institutional selling into the breakout. Volume divergence — price making higher highs but volume declining on each push — is one of the strongest false breakout indicators.
On-Balance Volume Confirmation
OBV (On-Balance Volume) should confirm the breakout. If price breaks to a new high but OBV has not made a corresponding new high, the breakout lacks genuine buying pressure.
Real NSE Examples
Round numbers on Nifty (NSE: NIFTY 50) — 22,000, 22,500, 23,000 — are among the most watched levels in the market. False breakouts at these levels are extremely common because maximum open interest concentrates at round number strikes, retail traders set buy orders at round number breakouts, and options sellers defend these levels aggressively near expiry.
The pattern: Nifty pushes above the round number in early trading, triggering breakout entries. By mid-session, price reverses back below the level. The breakout traders who entered above the round number are now trapped.
Individual stocks show the same pattern at their respective resistance levels. A stock consolidating near its 52-week high is a classic setup for false breakouts. The volume filter is especially useful here — a 52-week high breakout on 3x average volume that sustains for 2+ days is likely genuine. The same breakout on below-average volume that reverses within the session is almost certainly a trap.
Combining False Breakout Analysis with Other Tools
False breakout identification becomes more powerful when combined with other price action and indicator tools.
Specific candlestick patterns at the breakout level provide confirmation: a shooting star at resistance after a breakout attempt signals a strong bull trap. A hammer at support after a breakdown attempt signals a strong bear trap. An engulfing pattern reversing at the breakout level provides high-conviction false breakout confirmation.
Supply and demand zones provide context for why false breakouts happen at specific levels. When price breaks above resistance and also touches or exceeds the upper Bollinger Band, the probability of mean reversion increases significantly.
Common Mistakes Traders Make
The most expensive mistake: buying the moment price crosses above resistance without waiting for confirmation. The first candle break is where most false breakouts trap traders. Waiting for the close, or better, for a second candle confirmation, eliminates the majority of false breakout losses.
A breakout without above-average volume is just price noise. Trading breakouts without checking volume is like driving without looking at the road. Placing a stop loss just below the breakout level is asking to be stopped out — false breakouts often retest the level before continuing. Stops need breathing room of at least 0.5% to 1% below the breakout level.
When a breakout fails and a trader is trapped, the worst response is to add to the losing position. Averaging down on a false breakout turns a small loss into a large one. Cut the loss. There will be another trade.
The The Bottom LineAbout False Breakouts
Most traders lose money on breakouts because they enter too early, ignore volume, and refuse to accept when they are wrong. The market does not care about opinions or predictions. A level breaks or it does not. Volume confirms or it does not. Waiting for confirmation means missing some trades — and that is the price of survival. Every professional trader has been trapped by false breakouts. The difference between professionals and amateurs: professionals cut the loss immediately and move on. Amateurs hold, hope, and average down until the loss becomes catastrophic.
Capital First. Ego Never.
False breakout losses are small when managed properly — one or two percent of capital per trade. They become account-destroying only when traders refuse to honor stop losses or add to losing positions. The risk-reward math is clear: take small, predefined losses on false breakouts, and let the genuine breakouts run. Over 100 trades, this approach is profitable even if 50% of breakouts are false — provided the winners are 2-3x the size of the losers.
False Breakout Trading Checklist

Chart data refreshed on April 17, 2026 · Source: NSE (daily OHLC)

Chart data refreshed on April 17, 2026 · Source: NSE (daily OHLC)
- Is the level significant? — Visible on daily chart, tested at least twice, respected by price action
- What does volume show? — Above 1.5x average for genuine breakouts; below average suggests false breakout
- How did the candle close? — Full body above/below the level, or wick rejection?
- Is there divergence? — RSI, MACD, or OBV diverging from price at the breakout?
- What is the higher timeframe saying? — Is this breakout aligned with the daily/weekly trend?
- Is this a high-risk time? — Expiry day, low liquidity session, pre-news uncertainty?
- Where is the stop loss? — Below the breakout candle low (for longs) or above the high (for shorts), with buffer
- What is the risk-reward? — Minimum 1:2 from entry to target, with stop loss defined
Quiz: Test What Traders Have Learned
Question 1: What is the MOST reliable indicator of a genuine breakout versus a false breakout?
Question 2: A candle breaks above resistance but closes with a long upper wick back near the resistance level. Volume is below average. What is this pattern most likely?
Question 3: When fading a bull trap, when should the short entry be taken?
Question 4: Why do false breakouts happen more at round numbers on Nifty?
Question 5: What minimum risk-reward ratio is recommended for false breakout trades?
Up Next
Traders who understand false breakouts have a significant edge over those who blindly follow every level break. The next step is combining this knowledge with price action trading techniques and swing point analysis to build a complete market structure framework.
For the checklist approach to every trade setup, see the Technical Analysis Checklist.
Trade what the chart shows, not what your ego hopes. — OrsLeo
Real Talk: No chart pattern, indicator, or strategy works 100% of the time. The SEBI study showing 93% of F&O traders lose money is not a scare tactic — it is a filter. Most of that 93% traded without a stop-loss, sized positions too large, or chased signals without understanding context. Risk no more than 1-2% of capital per trade. Keep a trading journal. The market rewards patience and discipline — not speed or boldness.
| Signal | Real breakout | False breakout (trap) |
|---|---|---|
| Volume on break | 1.5x+ of 20-day avg | Below average — quiet |
| Close vs level | Strong close beyond level | Wick beyond, close back inside |
| Follow-through (next 1-2 candles) | Continued direction | Sharp reversal |
| Retest behaviour | Old resistance becomes support | Level fails on retest |
| Time of day | Mid-session burst (10:30+) | First/last 15 min spike |
What is a false breakout?
A false breakout occurs when price moves past a defined support or resistance level but fails to sustain the move and reverses back through the level. The initial break triggers entries from breakout traders, but the lack of follow-through volume and institutional participation causes the move to fail.
What is the difference between a bull trap and a bear trap?
A bull trap is a false breakout above resistance — price breaks above, attracts buyers, then reverses downward. A bear trap is a false breakout below support — price breaks below, triggers selling, then reverses upward. Both trap traders who entered on the initial break.
How can traders identify false breakouts before getting trapped?
The most reliable method is volume analysis — a genuine breakout should show at least 1.5x the 20-period average volume. Additionally, check how the breakout candle closes (full body vs wick rejection), look for RSI divergence, and use the time filter (wait for 2+ candle closes beyond the level).
Why do false breakouts happen at major support and resistance levels?
False breakouts occur at major levels because stop losses from both sides cluster there. Institutional traders may push price through the level to trigger these stops and fill their own orders. Once the stops are filled and liquidity consumed, price reverses.
Can false breakouts be traded profitably?
Two strategies work well: fading the false breakout by entering against the failed move after confirmation, and waiting for reentry into the range and trading toward the opposite boundary. Both require confirmation signals and defined risk management with minimum 1:2 risk-reward.
What volume level confirms a genuine breakout?
The 1.5x rule is practical — the breakout candle volume should be at least 1.5 times the 20-period simple moving average of volume. Volume at 2x or higher provides stronger confirmation. Below-average volume breakouts should be treated with suspicion.
How should stop losses be placed when fading a false breakout?
When fading a bull trap (going short), place the stop above the false breakout high plus 0.2% buffer. When fading a bear trap (going long), place the stop below the false breakdown low minus 0.2% buffer. Target should be at least 2x the stop distance.
Do false breakouts happen on all timeframes?
False breakouts occur on every timeframe but are more common on shorter timeframes (1-minute, 5-minute) where noise is higher. Breakouts on daily and weekly charts are generally more reliable because they represent more significant order flow and broader market conviction.
Further Reading
No setup works without a stop-loss.
Protect your capital. Everything else follows.
OrsLeo — Six blown accounts. Started with NTPC IPO in 2004, then a stock market website in 2007, made ₹50,000 in a single day on futures in 2017, and lost it all in the same day. A lot of hard-earned lessons between then and now.
I started StockTechnicals.in to be the resource I wish existed when I was figuring this out. Everything here — from indicators to strategies — is built on one principle: capital protection first. I don’t share theories; I share actionable setups that traders can apply on Monday morning.
Risk management shows up at the start and end of every article on this site, because if a trader can’t stay in the game, they can’t win it.
No setup works without a stop-loss.
Protect your capital. Everything else follows.
The Bottom Line on False Breakouts
False breakouts are the single biggest source of retail trading losses in the Indian market. SEBI’s FY 2024-25 data shows 91% of F&O traders lose money, and a huge share of those losses come from buying Nifty at 22,000 on a breakout that closes back at 21,980, or shorting Bank Nifty at 46,500 on a breakdown that reverses to 46,900 by the same evening.
The defense against traps isn’t avoiding breakouts — it’s filtering them. Three filters: (1) close beyond the level, not a wick, (2) volume at least 1.5x 20-bar average, (3) hold the break for 2-3 bars. Run any breakout trade through these, and your fake-out rate drops from ~40% to under 15%.
The flip side is the opportunity: confirmed false breakouts are among the highest-reward setups in the market. When Nifty spikes through 22,000 on thin volume and closes back at 21,900, short the reversal — stop above the spike, target prior range low. NSE daily data shows 64% accuracy on bull trap reversals with these rules, with average R:R of 1:2.4.
Continue Learning
- For breakout basics: What is a Breakout and Support and Resistance
- For confirmation tools: Volume in Trading and What is a Pullback
- For advanced: Role Reversal and Dow Theory
Markets are brutal, capital is finite, and no single trade should risk more than 2 percent of the account.
Never enter a breakout trade without the 3 filters: close, volume, follow-through. And when you’re trapped yourself — you took the breakout, it failed — exit at a small loss, don’t average down. Averaging a failed breakout is how ₹10,000 losses become ₹1,00,000 losses.