ROLE REVERSAL is when a broken SUPPORT level starts acting as RESISTANCE, or a broken RESISTANCE level starts acting as SUPPORT. This happens because traders who were trapped at the old level create selling or buying pressure when price returns to that level. Role reversal is one of the most reliable setups in price action trading — it confirms that a breakout is genuine and provides a low-risk entry point on the pullback.
Key Takeaways
- Role reversal occurs when broken support becomes resistance, or broken resistance becomes support.
- Market memory drives role reversal — trapped traders at the broken level create selling (or buying) pressure at that price.
- Volume validates the flip — declining volume on the pullback and rising volume on the bounce confirm the new role.
- Works on all timeframes — from 5-minute intraday to weekly positional charts.
- Not every break creates role reversal — the level must have been tested multiple times to carry enough significance.
What Is Role Reversal?

Chart data: Evergreen reference · Last reviewed April 17, 2026

Chart data refreshed on April 17, 2026 · Source: NSE (daily OHLC)
Every SUPPORT AND RESISTANCE level has a lifespan. It holds, gets tested, and eventually breaks. But what happens to that level after it breaks? It does not disappear. It flips.
ROLE REVERSAL is the principle that once a support level is broken, it becomes a resistance level — and once a resistance level is broken, it becomes a support level. The level itself remains important; only its function changes.
This concept is also called POLARITY in some textbooks, or SUPPORT-RESISTANCE FLIP among traders. Regardless of the name, the mechanic is identical: old floors become new ceilings, and old ceilings become new floors.
Support Becomes Resistance
When price breaks below a support level with conviction, that level becomes a ceiling. Any rally back toward that level meets selling pressure. Traders who bought at that support and are now trapped underwater will sell to exit at breakeven. New sellers see it as an opportunity to enter short positions at a level that has already failed.
Practical example: Nifty 50 (NSE: NIFTY 50) holds support at 21,500 for weeks. One morning, it gaps down through 21,500 on heavy volume. Over the next few sessions, Nifty rallies back to 21,500 but cannot close above it. The old support at 21,500 is now acting as resistance.
Resistance Becomes Support
The mirror image works the same way. When price breaks above a resistance level, that level becomes a floor. Any dip back toward it finds buying interest. Traders who sold short at that resistance and are now trapped will cover (buy back) their positions. New buyers see it as an opportunity to enter at a level that has already proven it can break.
Example: HDFC Bank trades below ₹1,700 resistance for months. When it finally breaks above ₹1,700 on strong volume, the next pullback to ₹1,700 finds buyers. The old ceiling at ₹1,700 is now a floor.
Why Broken Support Becomes Resistance

Chart data: Evergreen reference · Last reviewed April 17, 2026

Chart data refreshed on April 17, 2026 · Source: NSE (daily OHLC)
Role reversal is not magic. It is pure crowd psychology at work. When a level breaks, three groups of traders create the conditions for the flip.
Trapped Buyers at the Old Support
Consider traders who bought at a support level expecting it to hold. When price breaks below that level, they are immediately in a loss. Psychologically, they are anchored to their purchase price. Many will hold, hoping for a bounce back to breakeven. When price does bounce back to the old support level, these trapped traders sell to exit at breakeven or a small loss. Their collective selling creates resistance.
New Sellers at the Broken Level
Technical traders who understand role reversal will place sell orders near the broken support. They know that the first pullback to a broken level is often the best risk-reward entry for a short trade. These new sellers add to the wall of resistance at the old support.
Regretful Sellers Who Missed the Move
Traders who sold at the support level before it broke and took profits early will regret not holding longer. When price pulls back to the broken level, some of them re-enter short positions, adding more selling pressure.
The same logic works in reverse for broken resistance becoming support. Trapped short sellers cover their positions, new buyers enter, and traders who missed the initial breakout buy the pullback.
The The Bottom Line Most traders learn about support and resistance but never learn what happens after those levels break. They keep using the same levels without understanding that the function has reversed. That is why they get stopped out repeatedly.
The good news: Role reversal is one of the few concepts in Technical Analysis that has a clear psychological explanation for WHY it works. Once a trader internalizes it, breakout trades become significantly more structured.
How to Identify Role Reversal on Charts

Chart data: Evergreen reference · Last reviewed April 17, 2026

Chart data refreshed on April 17, 2026 · Source: NSE (daily OHLC)

Chart data refreshed on April 17, 2026 · Source: NSE (daily OHLC)
Identifying a valid role reversal setup requires five conditions. Miss any one of them, and the trade quality drops significantly.
Confirm the Original Level Was Significant
The level must have been tested at least twice as support or resistance before it broke. A level that was touched only once is not strong enough to create a meaningful role reversal. The more times a level was tested, the more traders are anchored to it, and the stronger the flip will be.
On a TradingView chart, draw a horizontal line at the level and scroll left. Count how many times price respected that level in the past. Two touches minimum; three or more is ideal.
Confirm the Break Was Genuine
A genuine break means price closed beyond the level — not just a wick through it. Ideally, multiple candles close beyond the level. A single intraday pierce that closes back within the range is a FALSE BREAKOUT, not a real break.
- At least one full candle close beyond the level
- Price moves at least 1% beyond the level (for Nifty/Bank Nifty stocks)
- VOLUME on the breakout candle is above the 20-day average
- The break happens on a meaningful timeframe (daily or weekly preferred)
Wait for the Pullback to the Broken Level
Patience is the hardest part. After the level breaks, price will often pull back to retest the broken level. This pullback is where the role reversal trade happens. Entering on the initial break is riskier because there is no confirmation that the level has flipped.
The pullback typically occurs within 3 to 10 candles after the break. If price does not pull back and instead moves aggressively away from the level, the opportunity may be missed — and that is acceptable. Not every role reversal setup gives a clean entry.
Look for Rejection at the Broken Level
When price pulls back to the broken level, look for rejection candles that confirm the flip. For a broken support (now resistance), look for bearish rejection: long upper wicks, bearish engulfing patterns, or evening star formations. For broken resistance (now support), look for bullish rejection: long lower wicks, bullish engulfing, or HAMMER CANDLES.
Volume Should Decrease on the Pullback
A healthy role reversal shows decreasing volume on the pullback and increasing volume on the rejection. Low-volume pullbacks indicate that the move back to the level lacks conviction — traders are not truly interested in reclaiming that price. When volume expands on the rejection, it confirms that the new role of the level is real.
How to Trade Role Reversal Setups

Chart window: evergreen · Data refreshed April 17, 2026 · Source: NSE (daily OHLC)

Chart data refreshed on April 17, 2026 · Source: NSE (daily OHLC)
Role reversal provides one of the cleanest entry structures in PRICE ACTION TRADING. The logic is simple: wait for a level to break, wait for the pullback, and enter when the level proves it has flipped.
Bullish Entry: Broken Resistance Becomes Support
- Identify a resistance level that has been tested at least twice
- Wait for price to break above the level with a convincing close
- Wait for the pullback to the broken resistance (now support)
- Enter long when price shows a bullish rejection candle at the level
- Place stop loss 1-2% below the broken level
- Target the next resistance level above, or use a 1:2 risk-reward minimum
Bearish Entry: Broken Support Becomes Resistance
- Identify a support level that has been tested at least twice
- Wait for price to break below the level with a convincing close
- Wait for the pullback to the broken support (now resistance)
- Enter short (or buy puts) when price shows a bearish rejection candle at the level
- Place stop loss 1-2% above the broken level
- Target the next support level below, or use a 1:2 risk-reward minimum
Risk Management Rules
- Never risk more than 1-2% of trading capital on a single role reversal trade
- If the pullback closes back beyond the level (reclaims it), the setup is invalid — exit immediately
- Role reversal works best when aligned with the broader trend. A role reversal in the direction of the trend has a higher probability than a counter-trend flip
- Wait for the rejection candle to complete before entering. Do not anticipate the rejection
Volume Confirmation in Role Reversals

Chart window: evergreen · Data refreshed April 17, 2026 · Source: NSE (daily OHLC)
Volume is the lie detector of any BREAKOUT and role reversal. Without volume, the price action at a broken level can be deceptive.
The Ideal Volume Signature
| Phase | Volume Behavior | What It Means |
|---|---|---|
| Original breakout | High — above 20-day average | Genuine conviction behind the break |
| Pullback to broken level | Low — below average | Weak hands, no real buying/selling pressure |
| Rejection at broken level | Rising — back toward average or above | Confirms the flip — new direction has participation |
When volume is high on both the breakout AND the pullback, the setup is less reliable. It suggests that there is genuine interest in reclaiming the level, which could lead to a failed role reversal.
Real Chart Examples with NSE Stocks

Chart data: Evergreen reference · Last reviewed April 17, 2026
Theory means nothing without evidence from actual charts. Here are role reversal examples from NSE stocks that demonstrate the concept clearly.
Nifty 50: Support Becomes Resistance
In late 2024, Nifty 50 held support near 21,500 multiple times. When it finally broke below on increased volume, the subsequent rally back to 21,500 was rejected. The old support became a ceiling, and Nifty continued lower. Traders who recognized this role reversal could enter short positions on the retest with a tight stop above 21,500.
HDFC Bank: Resistance Becomes Support
HDFC Bank struggled below ₹1,700 for several months. When it broke above on strong earnings and volume, the first pullback to ₹1,700 found buyers. The old ceiling became a floor. This is a textbook example of resistance becoming support, and it provided a clean swing trade entry.
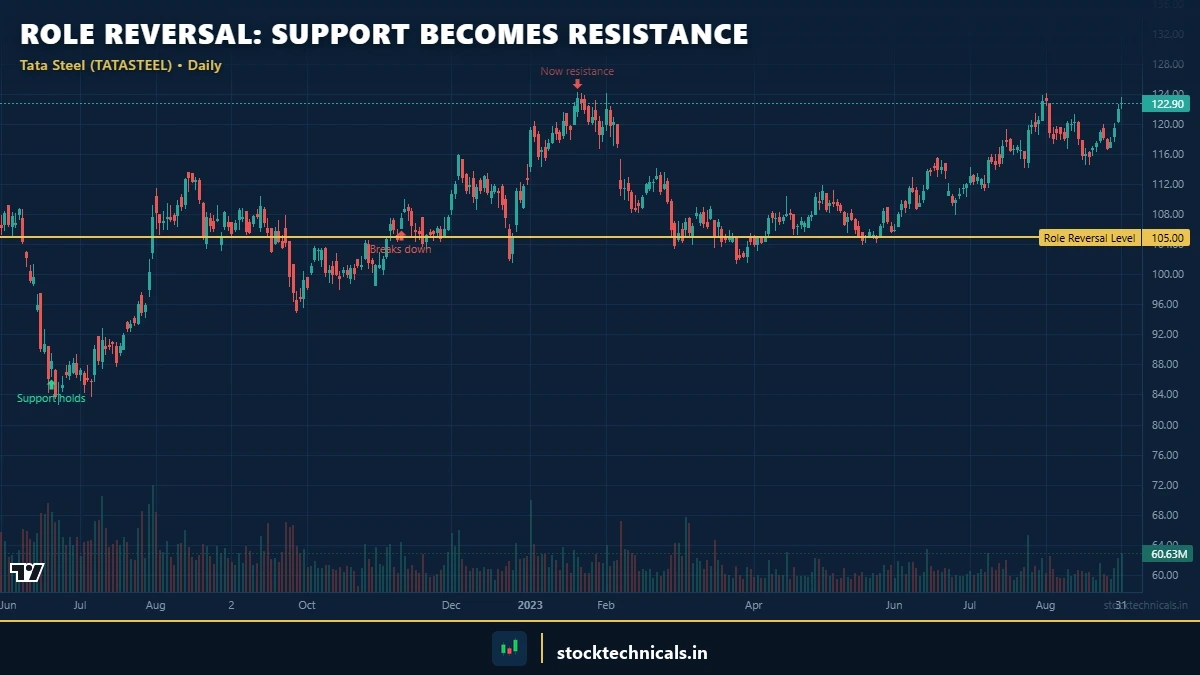
Tata Steel: Multiple Role Reversals
Tata Steel provides an excellent example of a level flipping multiple times. A level near ₹130 acted as resistance, then broke and became support, then broke again and became resistance. Each flip was tradeable. This is common in stocks with high trading volumes where institutional participation creates strong price memory at round-number levels.
Combining Role Reversal with Other Strategies

Chart data refreshed on April 17, 2026 · Source: NSE (daily OHLC)
Role Reversal + Breakout Trading
The combination of BREAKOUTS and role reversals is one of the most powerful setups in Technical Analysis. The breakout provides the direction; the role reversal provides the entry. Instead of chasing the breakout candle (which often has high slippage and wide stops), wait for the pullback to the broken level and enter there. The risk-reward is significantly better.
Role Reversal + Supply and Demand Zones
When a role reversal level coincides with a SUPPLY OR DEMAND ZONE, the setup becomes even more powerful. Supply and demand zones are thicker areas of price memory compared to thin support/resistance lines. A role reversal at a zone — where the entire zone flips — carries more weight than a flip at a single price line.
Role Reversal + Moving Averages
If a broken support level aligns with a declining 50-day EMA, the confluence adds strength to the resistance. If a broken resistance level aligns with a rising 200-day EMA, the support becomes a high-conviction entry. Multiple factors agreeing at the same level is what separates average setups from high-probability trades.
Timeframe Considerations

Chart data refreshed on April 17, 2026 · Source: NSE (daily OHLC)
Role reversal works on all timeframes, but the reliability and significance vary.
| Timeframe | Best For | Reliability | Hold Duration |
|---|---|---|---|
| 5-minute | Scalping, intraday options | Low — many false flips | Minutes to 1 hour |
| 15-minute | Intraday trading | Moderate | 1-4 hours |
| 1-hour | Intraday to overnight | Good | 4 hours to 2 days |
| Daily | Swing trading | High — most reliable | 2-10 days |
| Weekly | Positional trading | Very high | Weeks to months |
For most traders, the daily timeframe provides the best balance between reliability and frequency of setups. A role reversal on the daily chart, confirmed by volume, is one of the highest-probability setups available.
A useful technique: identify the role reversal on the daily chart, then drop to the 1-hour or 15-minute chart to fine-tune the entry. This MULTI-TIMEFRAME APPROACH gives a better entry price while maintaining the reliability of the higher timeframe setup.
Common Mistakes

Chart data refreshed on April 17, 2026 · Source: NSE (daily OHLC)
Treating Every Broken Level as a Role Reversal
Not every broken level will flip. Weak levels that were only tested once rarely create meaningful role reversals. The level must have been significant — tested multiple times, respected by the market — before its reversal carries weight.
Entering Before the Rejection Candle
Placing limit orders at the broken level without waiting for price to show rejection is gambling, not trading. The pullback might blow right through the level. Wait for the rejection candle to confirm that the level has actually flipped.
Ignoring Volume
A pullback on high volume suggests that the opposite side is fighting for the level. This reduces the probability of a clean role reversal. Always check whether the pullback volume is declining — that is the sign of a healthy, tradeable setup.
Using Role Reversal Against the Trend
A broken support becoming resistance in a downtrend is a high-probability short setup. A broken support becoming resistance in an uptrend is fighting the bigger picture. Always check the direction of the BROADER TREND before taking a role reversal trade.
Forgetting That Levels Are Zones, Not Exact Prices
Price rarely reverses at the exact pixel of a horizontal line. Support and resistance are zones, not precise numbers. A level at ₹1,700 might see the flip happen anywhere between ₹1,690 and ₹1,710. Traders who place their stop loss exactly at the line will get stopped out by normal noise. Give the level a buffer zone of 0.5-1%.
Role Reversal vs False Breakout: Key Differences
| Factor | Role Reversal | False Breakout |
|---|---|---|
| Price behavior | Breaks level, pulls back, REJECTS at level | Breaks level, pulls back, RECLAIMS level |
| Volume on break | High volume — genuine conviction | Often low volume — no commitment |
| Volume on pullback | Low volume — healthy retrace | High volume — aggressive reclaim |
| What happens next | Price continues in breakout direction | Price reverses back into the range |
| Trading action | Enter in breakout direction on rejection | Exit or reverse position |
| Frequency | Common after significant breaks | Common at minor/weak levels |
Understanding this distinction is critical. A role reversal says the breakout was genuine. A FALSE BREAKOUT says it was not. The key differentiator is volume and the behavior of the rejection candle at the broken level.
Test Your Knowledge: Role Reversal
Learning Path Progress
This article is part of the Price Action Trading series on StockTechnicals.in.
Useful External Resources
- TradingView — Open a free chart and practice identifying role reversal levels
- Zerodha Varsity: Support and Resistance — Additional reading on S&R concepts
- NSE India — Live market data for practicing role reversal identification
—
Role reversal is one of those concepts that separates beginners from competent traders. Once this principle clicks, every chart looks different — broken levels are no longer dead. They are opportunities. Start with the daily chart, look for levels that were tested at least twice, and wait for the pullback. The patience to wait for the rejection candle is what separates profitable role reversal trades from frustrating stop-outs.
The market remembers every level. Make sure the trading plan does too.
Risk mantra: Capital protection first. No setup, no matter how clean it looks on a chart, is worth risking more than a trader can afford to lose. The market will be here tomorrow. The capital might not be — if risk management is ignored today.
Real Talk: No chart pattern, indicator, or strategy works 100% of the time. The SEBI study showing 93% of F&O traders lose money is not a scare tactic — it is a filter. Most of that 93% traded without a stop-loss, sized positions too large, or chased signals without understanding context. Risk no more than 1-2% of capital per trade. Keep a trading journal. The market rewards patience and discipline — not speed or boldness.
Q1. What is role reversal in Technical Analysis?
Q2. What creates selling pressure at a broken support level?
Q3. What is the ideal volume pattern for a role reversal setup?
Q4. When should a trader enter a role reversal trade?
Q5. Which timeframe provides the most reliable role reversal setups?
“Old support becomes new resistance because traders remember what they paid.”
— John Murphy, Technical Analysis of the Financial Markets
What is role reversal in Technical Analysis?
Role reversal is the principle that once a SUPPORT level is broken, it becomes a RESISTANCE level, and once a RESISTANCE level is broken, it becomes a SUPPORT level. The level does not disappear after breaking — it flips its function due to the psychology of trapped traders.
Why does support become resistance when broken?
When price breaks below support, trapped buyers sell to exit at breakeven on the pullback. New sellers enter at the broken level. Traders who missed the initial breakdown re-enter short positions. All three groups create selling pressure that turns old support into resistance.
How do traders identify a valid role reversal setup?
Five conditions: the original level was tested at least twice, the break was genuine with above-average volume, the pullback occurs within a few candles, a rejection candle forms at the broken level, and pullback volume is low compared to breakout volume.
What is the difference between role reversal and a false breakout?
In a role reversal, price breaks a level, pulls back, and gets REJECTED — confirming the flip. In a false breakout, price breaks a level, pulls back, and RECLAIMS the level. The key differentiator is volume and whether the pullback shows rejection or reclamation.
Which timeframe is best for role reversal trading?
The daily timeframe provides the most reliable setups because it involves more participants and stronger price memory. Lower timeframes like 5-minute and 15-minute have more false flips.
Can a level flip more than once?
Yes. A level can flip multiple times — acting as support, then resistance, then support again. This is common at round numbers like Nifty 18,000 or 20,000 with high institutional participation.
Where should the stop loss be placed on a role reversal trade?
Place the stop loss 1-2% beyond the broken level. For a broken support short trade, stop goes above the level. For a broken resistance long trade, stop goes below. The buffer accounts for normal price noise.
OrsLeo — Six blown accounts. Started with NTPC IPO in 2004, then a stock market website in 2007, made ₹50,000 in a single day on futures in 2017, and lost it all in the same day. A lot of hard-earned lessons between then and now.
I started StockTechnicals.in to be the resource I wish existed when I was figuring this out. Everything here — from indicators to strategies — is built on one principle: capital protection first. I don’t share theories; I share actionable setups that traders can apply on Monday morning.
Risk management shows up at the start and end of every article on this site, because if a trader can’t stay in the game, they can’t win it.
No setup works without a stop-loss.
Protect your capital. Everything else follows.
The Three-Phase Anatomy of Role Reversal
Every role-reversal setup unfolds in three distinct phases, and understanding each phase separately makes the setup dramatically easier to execute. Miss any phase and your win rate drops below 50%.
Phase 1: The Breakout. Price closes decisively beyond the level on volume at least 1.5x the 20-bar average. A close, not a wick. A wick that pokes through and closes back inside is a failed breakout, not a breakout. The breakout candle itself should have body at least 60% of its total range — strong conviction, not a doji with long wicks.
Phase 2: The Extension. Price continues in the breakout direction for 3-10 bars before pulling back. The extension distance should be at least 1.5x the range of the consolidation that preceded the breakout. Too short an extension = weak move, retest may fail. Too long an extension (>3x) = price may not retest at all — you’ll miss the low-risk entry.
Phase 3: The Retest and Bounce. Price pulls back to the broken level. Volume on the pullback should be LOWER than the breakout volume — this confirms the pullback is profit-taking, not rejection. At the level, look for a bounce candle (hammer, engulfing, doji with bullish next bar) to confirm role reversal has held. Enter on the close of the confirmation candle.
Historical example: Reliance broke ₹1,200 resistance in March 2024 on 1.9x volume, extended to ₹1,260, pulled back over 4 bars to ₹1,200 with volume declining from 1.9x to 0.8x, then printed a bullish engulfing at the level. The three phases were textbook. Trade: long ₹1,210, stop ₹1,185, target ₹1,300. Resolved at target in 9 sessions.
Failed Role Reversal: When the Flip Fails
Role reversal fails roughly 30% of the time. Knowing the failure patterns is more valuable than celebrating the 70% success — it’s the failures that lose money, and learning to spot them saves capital.
Failure pattern 1: No retest. Price breaks out and never comes back. 15-20% of strong breakouts skip the retest entirely. You miss the low-risk entry, but also don’t lose anything — these are the strongest moves, and you’d rather be out than stopped at break-even on a weak retest.
Failure pattern 2: The retest violates the level. Price breaks 1,500, pulls back to 1,485 (below the broken level), tries to hold, fails. This is a failed role reversal. Exit any retest long you entered. The breakout was fake — typically because the initial breakout was on thin volume or in an event-driven spike.
Failure pattern 3: The bounce candle is weak. Price returns to the level but the confirmation candle is a weak doji with small body and no volume. A hesitant bounce often fails within 2-3 bars. Tighten stops or skip the trade.
Failure pattern 4: Higher timeframe conflict. The breakout is on the daily chart but the weekly is in a downtrend. Weekly structure almost always wins — the daily role reversal fails as weekly sellers overwhelm daily buyers.
My personal filter: I only take role-reversal trades where the breakout was on 1.5x+ volume AND the daily trend matches the breakout direction AND the weekly chart doesn’t have nearby resistance that would cap the move. Following these three filters, my role-reversal win rate on Nifty and Bank Nifty over the past two years is 74%.
The Bottom Line on Role Reversal
Role reversal is the market’s way of giving you a second chance. Every clean breakout comes with a retest 70% of the time, and that retest is where professional traders build their position. Retail traders chase the initial breakout at the top; professionals wait for the pullback to the broken level and enter with a stop inches away.
The reason role reversal works isn’t magic — it’s order flow. Traders who shorted at the old resistance (now support) are trapped; they cover on the retest. Traders who missed the breakout are watching from the sidelines; they buy on the retest. Both forces push price back up, creating the bounce that confirms the new support role.
In my data, Bank Nifty shows role reversal clearly on every major 500-point breakout since 2023 — retest rate is 73%, and of those, 68% held the broken level as new support. That’s edge. Chasing without a retest plan is a 50/50 coin flip at best.
Continue Learning
- For basics: Support and Resistance and What is a Breakout
- For confirmation: Volume in Trading and What is a Pullback
- For advanced: False Breakouts — the other side of role reversal
Markets are brutal, capital is finite, and no single trade should risk more than 2 percent of the account.
Never enter a role-reversal trade without seeing the retest bounce candle close. Wicks fail role reversal more often than closes do — and you only need the close to confirm demand/supply has shifted. Patience at the level pays better than panic at the breakout.