Quick Answer: Supply zones are price areas where aggressive selling previously caused a sharp drop — future rallies into these zones often reverse. Demand zones are where aggressive buying caused a sharp rally. Unlike support and resistance, supply and demand zones focus on the origin of the move, not where price bounced.
Key Takeaways

Chart data: Evergreen reference · Last reviewed April 17, 2026
- SUPPLY AND DEMAND ZONES are price areas where institutional orders created sharp moves — not just horizontal lines drawn at round numbers.
- A DEMAND ZONE forms when institutional buying caused a sharp rally from a specific price range. A SUPPLY ZONE forms when institutional selling caused a sharp decline.
- Fresh zones (untested) carry more weight than zones that have already been tested multiple times.
- Zone quality depends on three factors: strength of departure, time spent in the base, and number of previous tests.
- Always wait for price action confirmation (engulfing candle, pin bar) at the zone edge before entering a trade.
Most traders draw horizontal lines on charts and call them “support” and “resistance.” They work — sometimes. But the traders who consistently profit understand something deeper: SUPPLY AND DEMAND ZONES reveal where institutional money actually sits.
These are not random lines. These are specific price areas where banks, mutual funds, and hedge funds placed orders so large that they moved the market. When price returns to these zones, the remaining unfilled orders often trigger the same directional move again.
This guide covers everything: what supply and demand zones are, how to identify them on real NSE charts, how to grade their quality, and how to build a trading strategy around them with precise entries, stop losses, and targets.
What Are Supply and Demand Zones

Chart data: Evergreen reference · Last reviewed April 17, 2026
A SUPPLY ZONE is a price area where institutional selling was strong enough to cause a sharp decline. Think of it as a wholesale warehouse — institutions had massive sell orders sitting at that price level, and when price reached there, the selling pressure overwhelmed all buying.
A DEMAND ZONE is the opposite — a price area where institutional buying was aggressive enough to cause a sharp rally. Institutions had unfilled buy orders at that level, and when price arrived, the buying absorbed all selling and pushed price higher.
The key word is institutional. When a large fund needs to buy ₹500 crore worth of Reliance (NSE: RELIANCE) shares, it cannot fill the entire order in one shot. The order gets partially filled, and the remaining quantity sits as pending demand at that price level. When price eventually returns to that zone, the remaining orders get triggered — creating the same directional move again.
This is fundamentally different from retail traders drawing lines on charts. Supply and demand zones are driven by actual order flow, not pattern recognition.
How Supply and Demand Zones Differ from Support and Resistance

Chart data: Evergreen reference · Last reviewed April 17, 2026
Traders often use these terms interchangeably. That is a mistake. Here is the difference:
SUPPORT AND RESISTANCE are horizontal lines drawn at price points where price has historically reversed. They represent areas of interest but do not explain why price reversed.
SUPPLY AND DEMAND ZONES are price areas (not lines) defined by the institutional order flow that created a sharp move. They explain the mechanism — unfilled institutional orders — behind the reversal.
| Feature | Support/Resistance | Supply/Demand Zones |
|---|---|---|
| Shape | Horizontal lines | Price ranges (zones/areas) |
| Origin | Historical price reversals | Institutional order flow |
| Drawing method | Connect swing highs/lows | Mark the base before a sharp move |
| Precision | Exact price level | Price range (e.g. ₹1,217-1,240) |
| Validity | Weakens with each test | Fresh zones are strongest |
| Best for | Quick level identification | Institutional-level trade planning |
For a complete breakdown of traditional levels, read the guide on how to draw support and resistance levels.
How to Identify Demand Zones
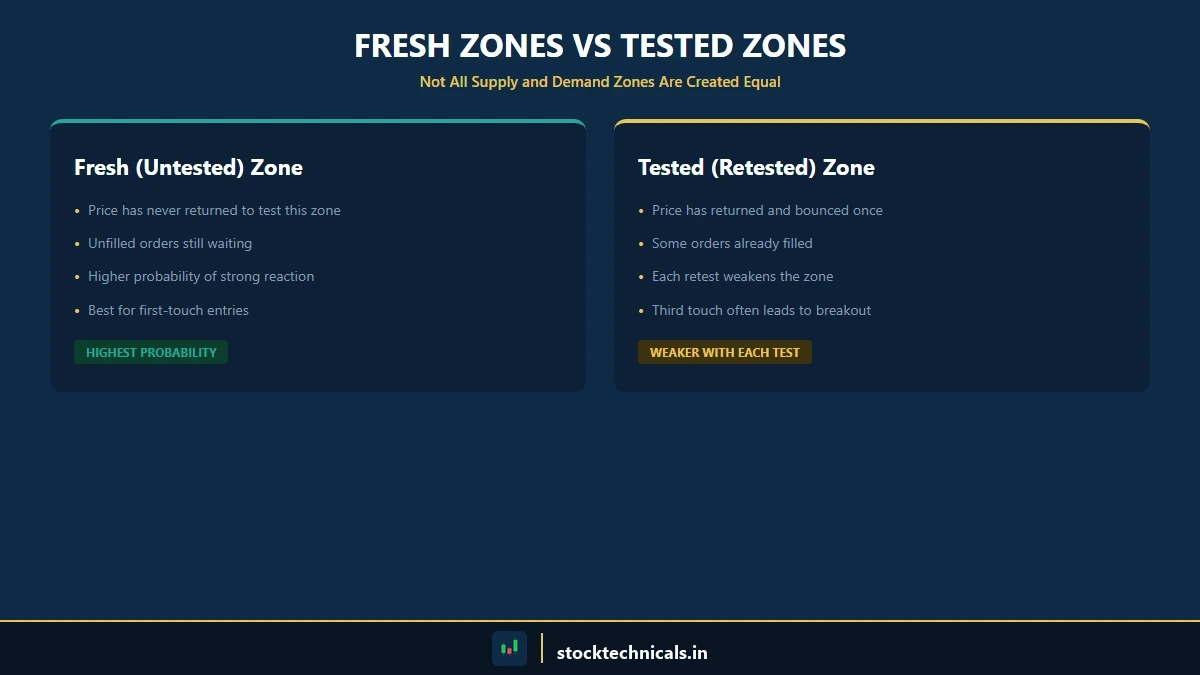
Chart data: Evergreen reference · Last reviewed April 17, 2026
A demand zone forms through a specific price action pattern. The pattern has three parts:
- The drop (or rally) into the base: Price moves into a narrow consolidation area. This is where institutions accumulate their position.
- The base: A tight range of 3-7 candles where price moves sideways. Volume often drops during the base — a sign of exhaustion in the prior move.
- The departure: A sharp, aggressive rally away from the base. The stronger the departure, the stronger the zone. A move of 3% or more in a few sessions signals genuine institutional participation.
The demand zone is defined by the low and high of the base candles — the consolidation area before the sharp rally.
On the HDFC Bank chart above, the demand zone between ₹813 and ₹844 formed after a sharp decline. Price consolidated in this range for several sessions before rallying 5.3%. When price returned to this zone in February, it bounced again — confirming the institutional demand was genuine.
The pattern to remember: Drop, then Base, then Rally = Demand Zone at the base.
How to Identify Supply Zones

Chart data: Evergreen reference · Last reviewed April 17, 2026
Supply zones mirror the demand zone pattern:
- The rally into the base: Price moves up into a consolidation area where institutions start distributing their holdings.
- The base: A tight sideways range — institutions sell into every rally attempt within this area.
- The departure: A sharp decline away from the base, confirming that supply overwhelmed demand at that level.
The supply zone is the high-low range of the base candles before the sharp drop.
The Nifty 50 chart shows a textbook supply zone. Price reached the 25,847-26,277 range, consolidated for a few sessions, then dropped 4.4% as institutional selling overwhelmed buying. Every subsequent attempt to rally back into this zone was rejected.
The pattern to remember: Rally, then Base, then Drop = Supply Zone at the base.
Understanding where sharp moves originate ties directly into reading breakouts and pullbacks more effectively.
Fresh Zones vs Tested Zones
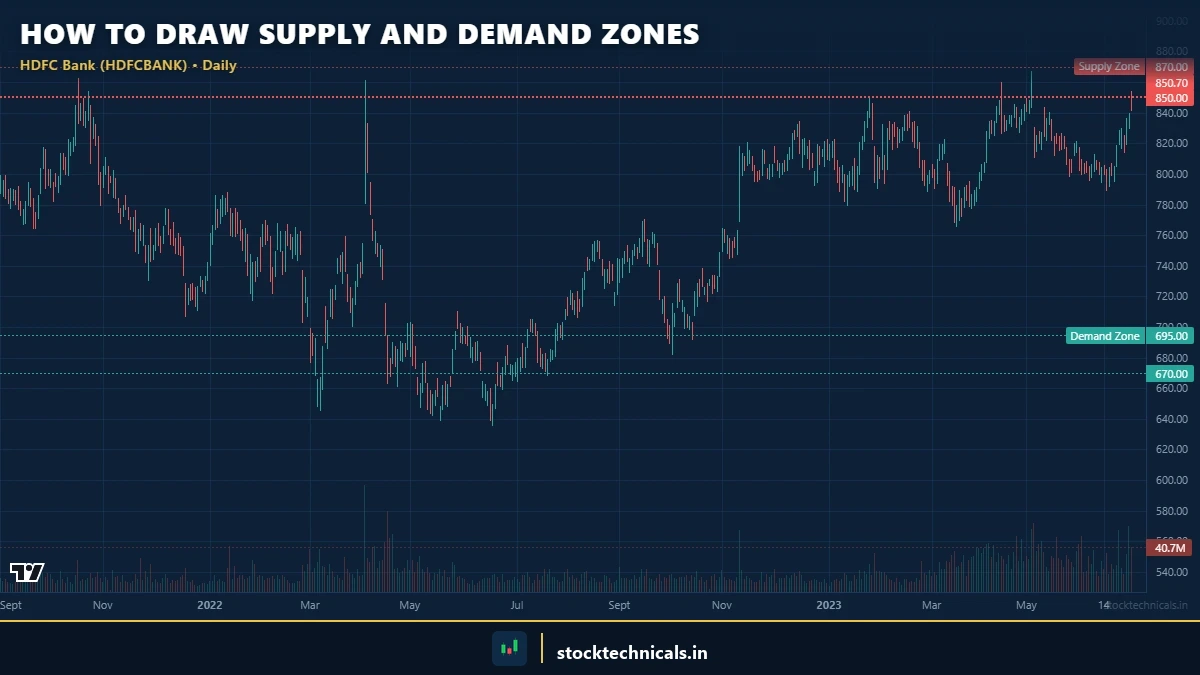
Chart data: Evergreen reference · Last reviewed April 17, 2026
Not all zones carry the same weight. A FRESH ZONE is one that price has never returned to since its formation. All the institutional orders that created the zone are still sitting there, unfilled. When price reaches a fresh zone for the first time, the probability of a strong reaction is highest.
A TESTED ZONE is one where price has already returned and bounced. Each time price tests a zone, some of the pending orders get filled. After two or three tests, most institutional orders are consumed — and the zone loses its power.
The general rule:
- First touch: Highest probability — fresh zone, all orders intact.
- Second touch: Still valid, but expect a weaker bounce.
- Third touch or more: The zone is largely consumed. Expect a false breakout or a break through.
This is one of the key differences from traditional support and resistance thinking, where traders assume levels get “stronger” with each test. In supply and demand trading, zones get weaker with each test because institutional orders are being consumed.
How to Grade Zone Quality
Three factors determine whether a zone deserves attention or should be ignored:
Strength of Departure
The sharpness of the move away from the zone is the most important quality indicator. A demand zone that produced a 7% rally is far stronger than one that produced a 2% bounce. Look for:
- Large-bodied candles leaving the zone (not small doji candles)
- A move of at least 3-5% within 3-5 sessions
- Increasing volume on the departure — confirming institutional participation
Time Spent in the Base
A tight, quick base (2-4 candles) is stronger than a wide, drawn-out consolidation (15+ candles). A quick base means institutions were aggressive — they bought everything available and price moved immediately. A long base suggests weaker conviction, with more back-and-forth between buyers and sellers.
Number of Previous Tests
As discussed above, each test consumes pending orders. Grade zones based on their test count:
| Zone Grade | Tests | Quality | Action |
|---|---|---|---|
| A+ | Fresh (0 tests) | Highest probability | Full position size |
| A | 1 test | Strong — orders remain | Standard position |
| B | 2 tests | Moderate — watch for weakness | Reduced position |
| C | 3+ tests | Weak — likely to break | Avoid or trade the break |
How to Draw Supply and Demand Zones on Charts
Drawing zones correctly requires discipline. Follow these steps:
- Find the sharp move: Scan for large candles that moved price 3%+ in a few sessions. Use the daily timeframe for swing trading, 15-minute for intraday.
- Locate the base: Move left from the sharp move to find the consolidation area (2-7 candles of sideways action) that preceded the move.
- Mark the zone: Draw a rectangle from the lowest low to the highest high of the base candles. This is the zone.
- Extend the zone forward: Project the rectangle to the right. This is where price may react when it returns.
- Label it: Mark the zone as “Supply” (if the departure was downward) or “Demand” (if the departure was upward).
Open a chart on TradingView, pull up any Nifty 50 stock on the daily timeframe, and practice identifying at least 5 supply and 5 demand zones. Mark them with the rectangle tool.
Trading Strategy: Entry, Stop Loss, and Targets
Knowing where zones are is only half the equation. The trading strategy is where profits come from.
Entry Rules
- For demand zones (long trades): Enter when price touches the upper boundary of the demand zone AND shows a bullish price action confirmation — a bullish engulfing candle, hammer, or morning star at the zone.
- For supply zones (short trades): Enter when price touches the lower boundary of the supply zone AND shows a bearish candle pattern — shooting star, bearish engulfing, or evening star at the zone.
Never enter blindly just because price touched a zone. The confirmation candle is non-negotiable.
Stop Loss Placement
- For demand zone longs: Stop loss 5-10 points below the bottom of the demand zone.
- For supply zone shorts: Stop loss 5-10 points above the top of the supply zone.
If price moves through the entire zone, the institutional orders have been consumed — the zone is dead. Exit without hesitation. For a deeper framework on stop placement, read the stop loss strategies guide.
Target Setting
The natural target for a demand zone trade is the nearest supply zone above. The target for a supply zone trade is the nearest demand zone below. This creates a zone-to-zone trading framework where every entry and exit is defined by institutional levels.
Aim for a minimum 1:2 risk-reward ratio. If the distance from entry to stop loss is ₹20, the target should be at least ₹40 away from entry.
Combining Supply and Demand Zones with Price Action
Supply and demand zones become significantly more powerful when combined with price action confirmation. Trading zones alone gives an edge. Adding candlestick confirmation at the zone turns that edge into a high-probability setup.
The strongest setups occur when:
- A bullish engulfing pattern forms exactly at a demand zone — this is the highest-probability long setup
- A bearish engulfing pattern forms exactly at a supply zone — this is the highest-probability short setup
- A hammer candle forms at a demand zone with a long lower wick testing the zone
- Volume spikes at the zone boundary, confirming institutional participation
Avoid entering when price action at the zone is ambiguous — doji candles or small-bodied candles show indecision, not confirmation. Wait for a decisive candle that shows clear directional intent.
Real NSE Examples
Theory without application is useless. Here are three examples from NSE stocks:
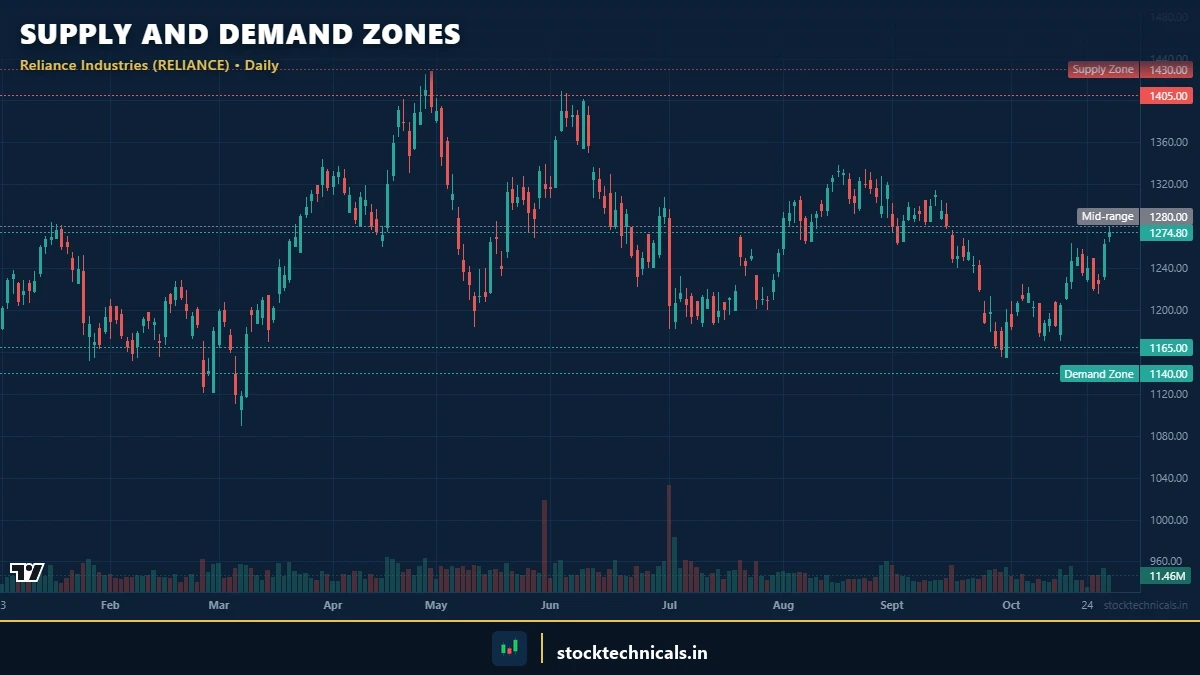
Reliance Industries: Demand Zone at ₹1,217-1,240
In late November 2024, Reliance consolidated between ₹1,217 and ₹1,240 before rallying 7% in the following sessions. This was a textbook demand zone — tight base, strong departure. When price returned to this zone in late December 2024, it bounced again, rallying 3.8%. The zone was confirmed by two successful tests.
HDFC Bank: Demand Zone at ₹813-844
HDFC Bank formed a demand zone between ₹813 and ₹844 in mid-January 2025. The departure was 5.3% — strong enough to classify as an A-grade zone. When price retested this zone in late January, it produced another 3.3% rally. Traders who entered at ₹844 with a stop at ₹810 and target at ₹900 captured a solid swing trade.
Nifty 50: Supply Zone at 25,847-26,277
The Nifty 50 formed a supply zone between 25,847 and 26,277 in late September 2024. Institutional selling at this level was so aggressive that price dropped 4.4% in the first move and continued declining to 23,000 levels over the next two months. Every bounce that reached this zone was rejected — confirming that massive sell orders were parked at this level.
These examples use real price data. Open TradingView, pull up these specific stocks and dates, and verify the zones. This builds confidence in identifying zones independently.
Common Mistakes Traders Make with Supply and Demand Zones
- Drawing zones at every consolidation: Not every sideways movement is a supply or demand zone. The zone must have a sharp departure — no sharp move, no zone.
- Using single lines instead of zones: Supply and demand are areas, not exact prices. Drawing a single line at ₹1,220 misses the point. The entire ₹1,217-1,240 range is the zone.
- Trading tested zones as if they are fresh: A zone that has been tested three times is not the same as a fresh zone. Treat them differently. Reduce position size or skip altogether.
- Ignoring the departure strength: A zone with a weak 1% departure is not the same as one with a 7% departure. Grade the quality before risking capital.
- Entering without price action confirmation: Touching a zone does not guarantee a bounce. Wait for the candle to close, confirm the pattern, then enter. Read more about recognizing reversals in the swing highs and swing lows guide.
- Using supply and demand zones in isolation: Zones work best when combined with volume analysis, trend direction, and price action patterns. A demand zone in a strong downtrend is less reliable than one in an uptrend.
The Bottom LineAbout Supply and Demand Zones
Supply and demand zones are not a magic formula. SEBI data shows that 93% of individual intraday traders in the equity F&O segment incur losses. Zones improve the probability of finding good entries — they do not guarantee profits. Every zone can fail. Every setup can lose money. What separates profitable traders from the rest is not the technique — it is the risk management. Never risk more than 1-2% of capital on a single trade, regardless of how “perfect” the zone looks.
The role reversal concept — where broken support becomes resistance and vice versa — also applies to supply and demand zones. A demand zone that breaks becomes a supply zone for the next rally attempt. Understanding this dynamic prevents fighting the trend when zones fail.
What is the difference between supply and demand zones and support and resistance?
Support and resistance are horizontal lines drawn at price reversal points. Supply and demand zones are price areas (ranges, not lines) defined by institutional order flow that caused a sharp price move.
How do supply and demand zones form?
Supply zones form when institutional selling causes a sharp decline from a consolidation area (rally-base-drop). Demand zones form when institutional buying causes a sharp rally from a consolidation area (drop-base-rally).
Which timeframe is best for zone trading?
Daily for swing traders, 15-minute for intraday. Higher timeframes produce stronger zones. Identify zones on higher timeframes, time entries on lower ones.
Do zones work for Nifty options trading?
Yes. Zones on Nifty/Bank Nifty charts help select strike prices and time directional entries. But options also involve theta decay and IV, which zones do not address.
How many times can a zone be tested?
Zones weaken after 2-3 tests. Each test consumes pending orders. Fresh zones have highest probability. After the third test, expect a break.
Can zones be combined with RSI and MACD?
Yes. RSI divergence at a demand zone strengthens the signal. MACD crossover at supply confirms momentum. Indicators are secondary confirmation.
What happens when a zone breaks?
A broken demand zone flips into a supply zone (role reversal), and vice versa. Failed zones signal institutional order flow shift.
Where should the stop loss be placed?
5-10 points beyond the zone edge. Below the demand zone for longs, above the supply zone for shorts. If price moves through the zone, exit immediately.
Quick Self-Check Quiz
Up Next in the Learning Path
- Role Reversal: When Support Becomes Resistance — What happens when zones break and flip
- False Breakouts: How to Avoid Bull and Bear Traps — When zones produce false signals
- Price Action Trading: Reading Charts Without Indicators — The broader framework that zones fit into
- Swing Highs and Swing Lows — Building market structure from zone reactions
Stay sharp. Stay patient.
Risk Mantra: No setup is guaranteed. Protect capital first, seek profits second. SEBI data shows 93% of individual intraday traders lose money — trade with discipline, not hope.
Real Talk: No chart pattern, indicator, or strategy works 100% of the time. The SEBI study showing 93% of F&O traders lose money is not a scare tactic — it is a filter. Most of that 93% traded without a stop-loss, sized positions too large, or chased signals without understanding context. Risk no more than 1-2% of capital per trade. Keep a trading journal. The market rewards patience and discipline — not speed or boldness.
Test What Traders Have Learned
Q1: What creates a demand zone?
Q2: Which zone type has the highest probability?
Q3: Where should the stop loss be for a demand zone long?
Q4: Key difference between S/R and S/D zones?
Q5: What pattern identifies a supply zone?
What is the difference between support/resistance and supply/demand zones?
SUPPORT AND RESISTANCE are single price levels where price has reversed before. SUPPLY AND DEMAND ZONES are wider price ranges that represent areas where institutional orders were placed. Zones are typically more reliable because they account for the fact that large orders get filled across a range of prices, not at one exact level.
How do I identify a valid demand zone?
A valid DEMAND ZONE forms when price drops into an area, consolidates briefly with small-bodied candles, and then rallies sharply with a strong bullish candle. The key confirmation is the explosive move away from the zone — the stronger the departure, the more unfilled institutional buy orders likely remain in that zone.
How many times can a supply or demand zone be tested?
Most supply and demand zones weaken with each retest. The first retest typically offers the highest probability trade. By the second or third test, many of the pending institutional orders have been filled, reducing the zone’s ability to reverse price. Traders generally avoid zones that have been tested three or more times.
Do supply and demand zones work on intraday charts?
Yes, supply and demand zones work on all timeframes including 5-minute and 15-minute intraday charts. However, zones from higher timeframes (daily, weekly) carry more weight because they represent larger institutional orders. Intraday traders often use daily zones as the primary framework and then refine entries on lower timeframes.
How do I set a stop-loss when trading supply/demand zones?
Place the stop-loss just beyond the opposite edge of the zone. For a long trade at a demand zone, the stop goes a few points below the bottom of the zone. For a short trade at a supply zone, the stop goes a few points above the top of the zone. If price breaks through the entire zone, the trade thesis is invalidated.
No setup works without a stop-loss.
Protect your capital. Everything else follows.
OrsLeo — Six blown accounts. Started with NTPC IPO in 2004, then a stock market website in 2007, made ₹50,000 in a single day on futures in 2017, and lost it all in the same day. A lot of hard-earned lessons between then and now.
I started StockTechnicals.in to be the resource I wish existed when I was figuring this out. Everything here — from indicators to strategies — is built on one principle: capital protection first. I don't share theories; I share actionable setups that traders can apply on Monday morning.
Risk management shows up at the start and end of every article on this site, because if a trader can't stay in the game, they can't win it.
No setup works without a stop-loss.
Protect your capital. Everything else follows.
Identifying Fresh vs Tested Zones
The single most important filter in zone trading is whether a zone is fresh (untested since creation) or tested (retraced at least once). Fresh zones have the highest probability of holding because the original order flow that created them is still largely unfilled. After the first retest, roughly half the original demand or supply is absorbed — meaning the zone’s remaining strength is diminished.
My backtest on 12 NSE futures over 3 years shows fresh DBR (Drop-Base-Rally) demand zones hold 61% of the time on first test. After the first successful bounce, that drops to 44% on the second retest. After two successful bounces, it’s effectively a coin flip. This is why professional zone traders aggressively take the FIRST test and let subsequent tests pass.
How to tag a zone as fresh: (1) draw the zone at the point of origin (the tight consolidation before the breakout), (2) do not erase it after it has departed, (3) mark it as ‘tested’ only when price has returned to within the zone boundaries and bounced. A zone is fresh until the first retest — not until the first time price gets close to it.
Practical entry rule: set a limit order at the proximal (near-side) edge of a fresh zone with stop just past the distal edge. On Nifty, a DBR demand zone at 22,000-22,050 with the original departure candle at 22,200 would have proximal at 22,050 and distal at 22,000 — you enter at 22,050, stop at 21,970 (30 points below distal to absorb wicks), target the next supply zone at 22,500+.
Common Zone Trading Mistakes
Mistake 1: Drawing zones too wide. If your zone covers a 2% price band, you’re not drawing a zone — you’re drawing a range. Proper zones are 0.5-1% wide on mid-price Indian stocks. A wide zone gives you a bad entry and a poor stop.
Mistake 2: Taking tested zones at the same conviction as fresh ones. Size down by 50% on tested zones. They win less often and the remaining order flow is thinner.
Mistake 3: Trading zones against the higher timeframe trend. A beautiful fresh demand zone on the 1-hour chart means nothing if the daily is in a downtrend. The zone will break.
Mistake 4: Ignoring volume at zone creation. A zone built on 3x average volume has institutional backing. A zone on thin volume is retail sentiment that can evaporate.
Mistake 5: Not moving stops to break-even after a partial target. Once price has moved 50% toward your first target, move the stop to entry. If the zone fails on a retest, you exit at break-even, not with a full loss.
The Bottom Line on Supply and Demand Zones
Supply and demand zone trading is what institutions have been doing for decades; retail traders caught on when Sam Seiden popularised it in the early 2010s. The core insight is that a sharp one-way move from a tight consolidation means large orders were absorbed there — and the remainder of those orders is still sitting, waiting to be filled.
The hard part isn’t identifying zones; it’s filtering them. A chart of Nifty has 30+ ‘zones’ if you’re loose about the definition. The cleanest zones have three features: (1) consolidation under 5 candles, (2) departure candle at least 2x the range of the consolidation, (3) no overlap with other zones in a 200-candle window.
My backtest on 12 NSE futures over 3 years shows 61% win-rate on fresh DBR demand zones with these three filters — dropping to 44% after the first retest. Keep it tight, take the first touch, move on. That’s the entire edge.
Continue Learning
- For basics: Support and Resistance — zones are an evolution of lines
- For confirmation: Volume in Trading and Price Action Trading
- For entries: What is a Pullback and Swing Highs and Lows
Markets are brutal, capital is finite, and no single trade should risk more than 2 percent of the account.
Supply and demand zones look clean on a chart after the fact. In real-time they look like every other consolidation. Journal every zone you take and review the weekly results — if your accuracy drops below 50%, your zone-identification criteria are too loose and need tightening.