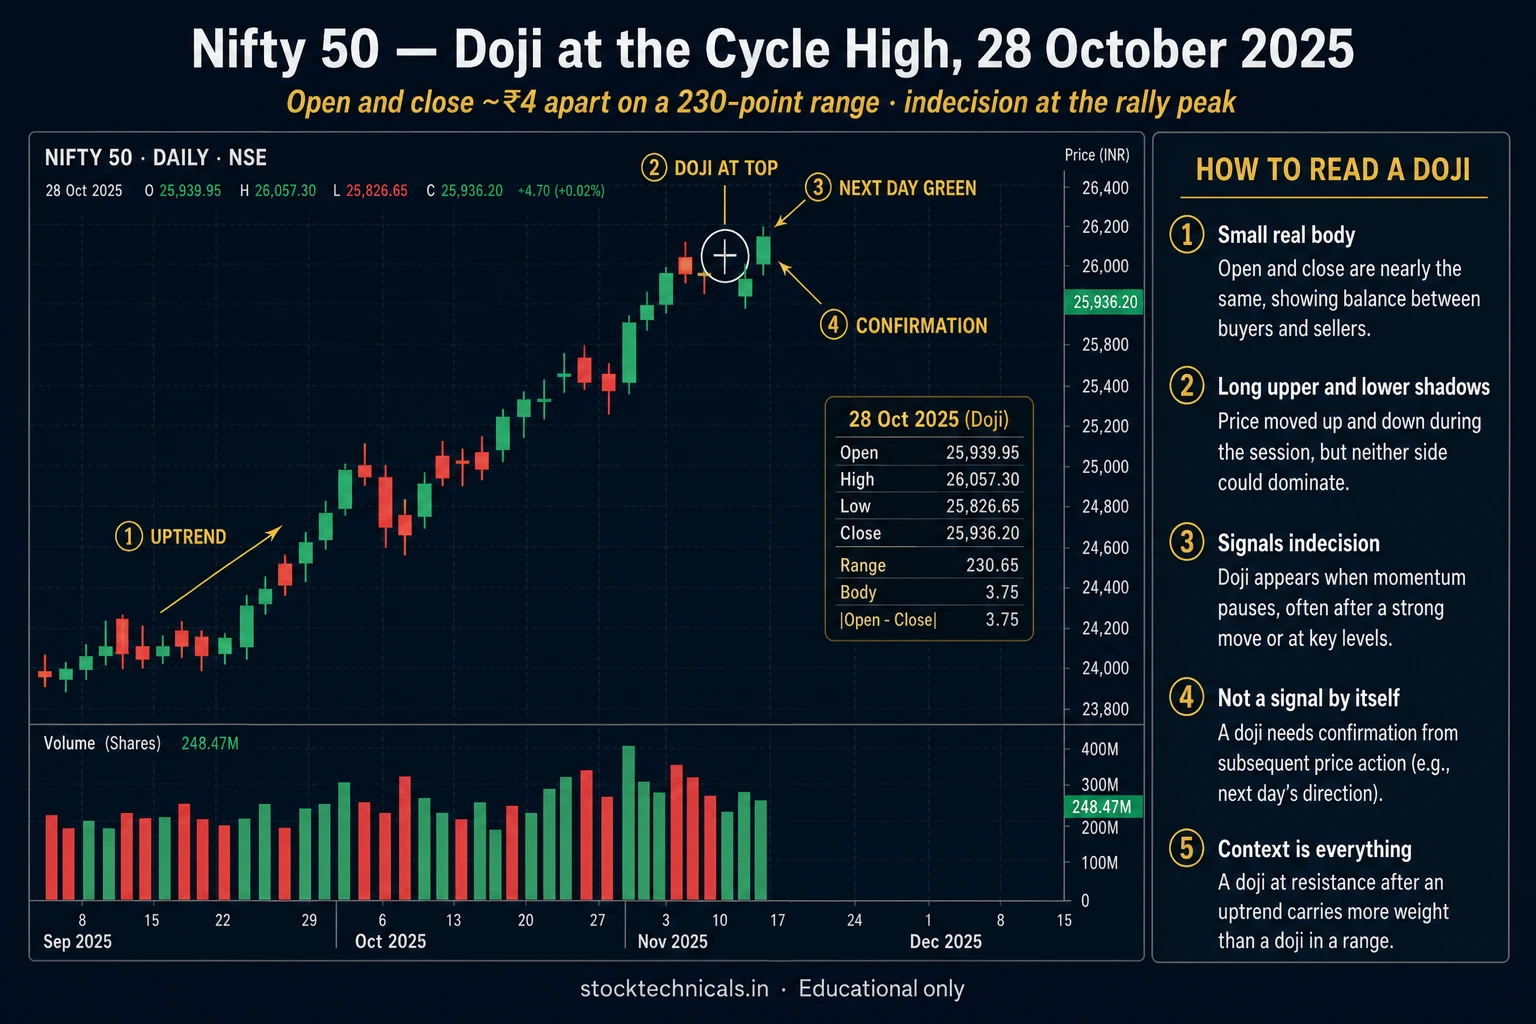
Every chart has one candle that stops the argument. Bulls were winning. Bears were winning. Then a single candle prints where the open and the close are almost exactly the same. Neither side moved the needle by the end of the session. The pause has a name: DOJI.
Quick Answer: A doji is a candlestick where the open and close are almost identical, producing a body less than 10 percent of the total range — the clearest visual signal of market indecision. It is not a directional signal on its own; it is a stop sign that flags a moment where buyers and sellers fought to a draw. On NSE, a doji at the top of a rally in Reliance or a doji at the bottom of a sell-off in HDFC Bank is a warning to pause and wait for the next candle to confirm direction.
Published January 20, 2026 · Last refreshed April 27, 2026. Prices and data are compiled with reasonable care — always confirm against your broker before trading.
A DOJI CANDLE (a candlestick where the body is less than 10 percent of the total range) is the clearest visual signal of market indecision. It is not a directional signal by itself. It is a STOP sign — a moment where buyers and sellers fought to a draw. What matters is the LOCATION of that draw. A doji in the middle of a sideways range means nothing. A doji at the top of a rally or the bottom of a decline is often the first warning that the trend is exhausting.
This article breaks down the five doji subtypes, shows seven NSE examples (prices cross-checked against NSE (daily OHLC) to two decimal places), and lays out the exact rules for trading them. Every chart shows 85-105 days of context so traders can see not just the doji but the trend it appeared in.
Key Takeaways
- A DOJI has a body less than 10 percent of the total range — the open equals the close (within 0.1 percent)
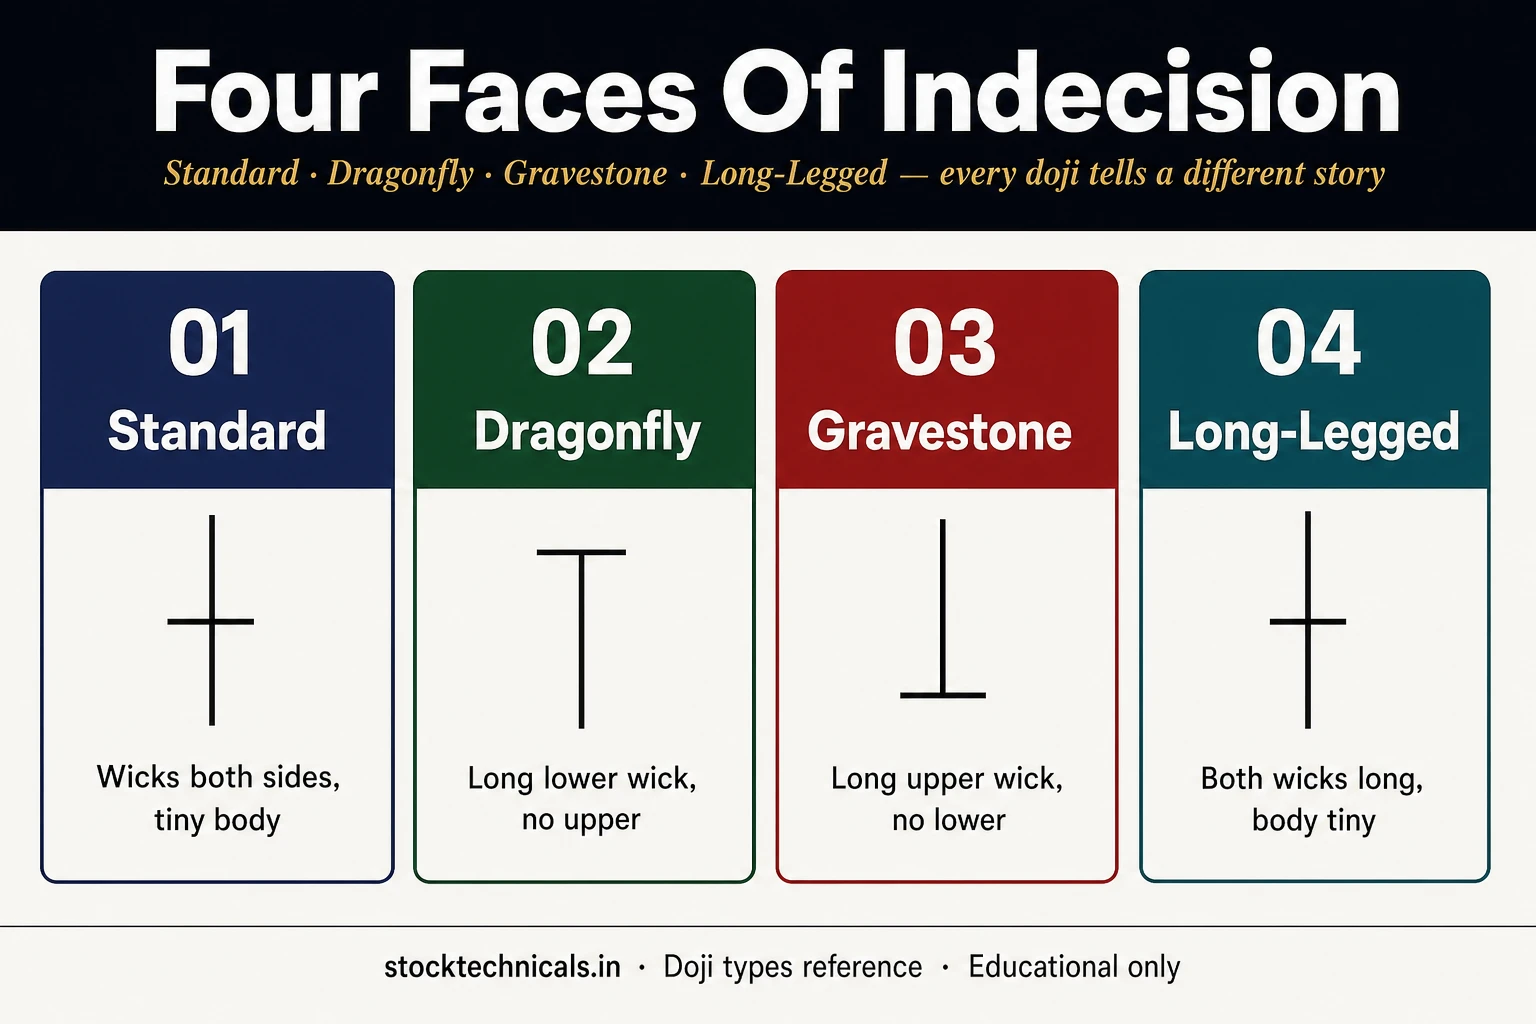
- Five subtypes: STANDARD, DRAGONFLY, GRAVESTONE, LONG-LEGGED, and FOUR-PRICE DOJI
- DRAGONFLY at a downtrend bottom = bullish reversal signal (buyers defended the floor)
- GRAVESTONE at an uptrend top = bearish reversal signal (sellers rejected the ceiling)
- LONG-LEGGED = maximum indecision with big wicks on both sides — often precedes violent moves
- LOCATION matters more than the doji shape — a doji in a sideways range is just noise
- Volume above 1.5x the 20-day average confirms the doji signal; below 0.8x treats it as failed
- Doji signals require NEXT-DAY confirmation — never enter on the doji candle itself
- A doji is a WARNING, not a confirmed reversal — use stop-loss at the far side of the wick
Anatomy of a Doji Candle
Before the subtypes, understand what makes a candle a doji. The defining rule is simple: the BODY (the vertical rectangle between open and close) must be less than 10 percent of the total RANGE (high minus low). In practice this means the open price and the close price are within 0.1 percent of each other — visually invisible to the eye at normal chart zoom.
The body is effectively a horizontal line. The wicks tell the full story. A doji with a giant upper wick and no lower wick looks completely different from one with two equal wicks — but both share the same zero-body core. That is why doji subtypes exist: the shape of the wicks changes the signal even though the body is identical.
The seven rules above are non-negotiable. Rule 3 is the one most beginners miss: LOCATION matters more than wick size. A textbook gravestone doji in the middle of a chop zone means nothing. The same gravestone at a fresh all-time high after a multi-week rally is a major warning.
Standard Doji (Neutral Doji)
The STANDARD DOJI is the classic cross shape — a tiny horizontal body with roughly balanced wicks above and below. Both buyers and sellers had some say during the session, but neither won. It represents pure indecision, neutral between the two sides.
How to identify a Standard Doji
- Body less than 10 percent of the total range
- Upper wick between 15-65 percent of range
- Lower wick between 15-65 percent of range
- No extreme wick dominance in either direction
- Open and Close are nearly identical
Example: Axis Bank (NSE: AXISBANK) on September 27, 2024 printed a textbook STANDARD DOJI at the top of a 6-day rally from Rs 1,239 to Rs 1,277. The OHLC was Open Rs 1,273.00, High Rs 1,281.55, Low Rs 1,257.25, Close Rs 1,273.15. Open and Close differed by just Rs 0.15 — body Rs 0.15 at 0.6 percent of the Rs 24.30 range. Upper wick Rs 8.40 (34.6%), lower wick Rs 15.75 (64.8%) — the lower wick was slightly dominant but neither side broke out. Volume was 1.73x the 20-day average — heavy confusion at the top.
What happened next: Five sessions later Axis Bank closed at Rs 1,145.70 — a −10.01 percent collapse. The intraday low over 10 days reached Rs 1,130.90 (−11.17 percent). The doji marked the exact peak. When indecision appears at a rally top on heavy volume, it is the smart money distributing silently.

Example 2 (Bullish Reversal): Wipro on May 31, 2024. After a 5-day decline from Rs 231.83 to Rs 218.48, Wipro printed a standard doji: Open Rs 218.78, High Rs 221.08, Low Rs 217.75, Close Rs 219.10. Body just Rs 0.32 (9.6 percent of the Rs 3.33 range). Upper wick Rs 1.98 (59.5%), lower wick Rs 1.03 (30.9%). Volume was 2.00x the 20-day average — heavy conviction at the bottom. Five sessions later Wipro closed Rs 242.28 (+10.58 percent). The 10-day high reached Rs 244.20 (+11.46 percent). Seller exhaustion confirmed by a doji at support, traded long on confirmation.
Dragonfly Doji
The DRAGONFLY DOJI is the bullish sibling of the doji family. It has a tiny body at the TOP of the range, no upper wick, and a long lower wick that looks like a dragonfly’s tail. It says: sellers pushed hard during the session, but buyers stepped in and drove the price right back to the opening level. The recovery is complete. The reversal pressure is obvious.
How to identify a Dragonfly Doji
- Body less than 10 percent of total range
- Upper wick less than 10 percent of range (near zero)
- Lower wick more than 65 percent of range
- Open equals High (or nearly so)
- Close equals High (or nearly so)
- Forms at the bottom of a downtrend for maximum effect
Example: NTPC on June 5, 2024 — the day after the Indian general election results crash. On 4 June the results pushed NTPC from Rs 391.80 to Rs 331.25 (−15.46 percent intraday). The next day NTPC gapped up to Open Rs 340.00 and fought an all-day battle. Low Rs 315.30 (sellers trying to break lower), High Rs 342.25, Close Rs 341.00. The body was Rs 1.00 (3.7 percent of the Rs 26.95 range). Upper wick Rs 1.25 (4.6%), lower wick Rs 24.70 — a massive 91.7 percent of the range. Classic dragonfly geometry. Volume was 2.61x the 20-day average.
What happened next: Five sessions later NTPC closed Rs 371.30 (+8.89 percent from the dragonfly close). The intraday high touched Rs 376.40 (+10.38 percent). The election-day low of Rs 313.95 was never retested. Dragonfly at a panic-capitulation bottom, heavy volume, followed by a clean recovery.

Gravestone Doji
The GRAVESTONE DOJI is the bearish mirror of the dragonfly. Tiny body at the BOTTOM of the range, no lower wick, long upper wick reaching skyward like a gravestone. It says: buyers pushed hard to a new intraday high, but sellers arrived at that new high and drove the price all the way back down to the opening level. By the close, every intraday buyer was sitting on a loss. The supply rejection is total.
How to identify a Gravestone Doji
- Body less than 10 percent of total range
- Lower wick less than 10 percent of range (near zero)
- Upper wick more than 65 percent of range
- Open equals Low (or nearly so)
- Close equals Low (or nearly so)
- Forms at the top of an uptrend for maximum effect
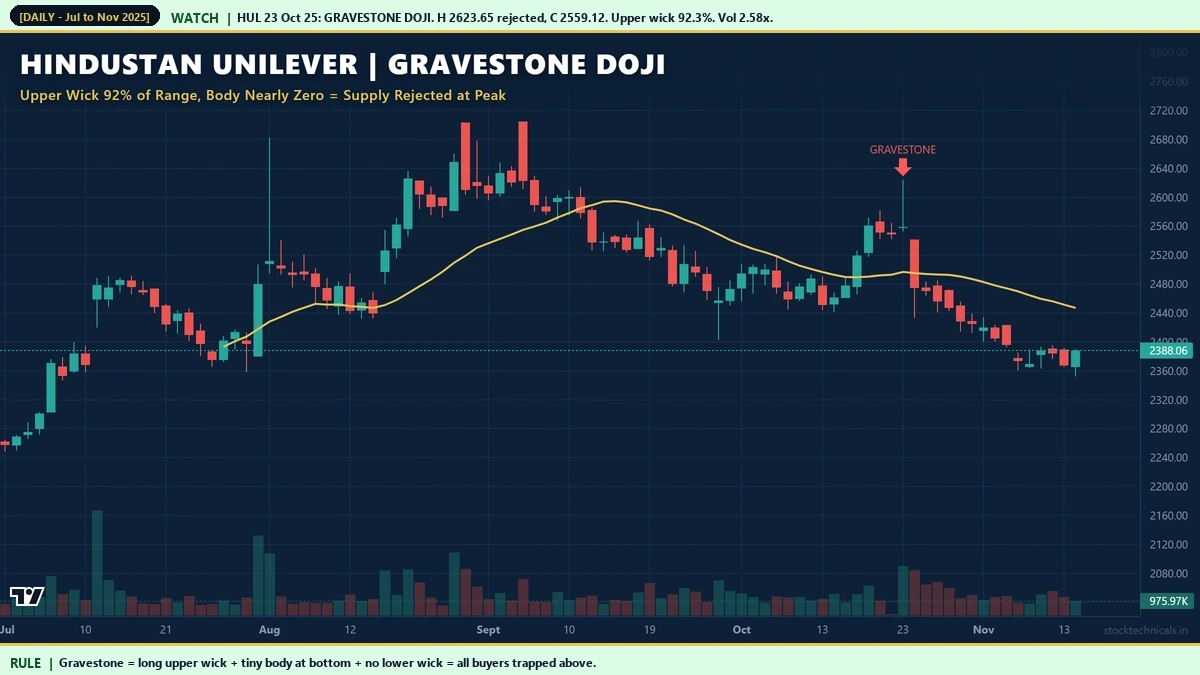
Example: Hindustan Unilever on October 23, 2025 (same chart as the featured image). HUL had rallied for several weeks into new high ground. On that Thursday, HUL opened Rs 2,558.53, rallied hard to High Rs 2,623.65 intraday, but collapsed back to Close Rs 2,559.12. The body was just Rs 0.59 (0.8 percent of the Rs 69.94 range). Upper wick Rs 64.53 (92.3%), lower wick Rs 4.82 (6.9%). Volume was 2.58x the 20-day average — distribution at the top was confirmed by the tape.
What happened next: The very next session HUL gapped down, opening Rs 2,541.81 and closing Rs 2,475.31 (−3.28 percent). Five sessions later HUL closed Rs 2,429.27 (−5.07 percent from the doji). The 10-day low reached Rs 2,361.40 (−7.73 percent). The gravestone marked the absolute top.
Long-Legged Doji
The LONG-LEGGED DOJI is the most dramatic of the family. Tiny body in the middle of a wide range, with both upper AND lower wicks stretching long distances. It says: buyers pushed hard one way, sellers pushed hard the other, and by the close they ended up exactly where they started. The total distance traveled is huge but the directional progress is zero. Maximum volatility, maximum indecision, maximum potential energy waiting to be released.
How to identify a Long-Legged Doji
- Body less than 10 percent of total range
- Upper wick more than 35 percent of range
- Lower wick more than 35 percent of range
- Total range is unusually wide compared to recent sessions
- Volume usually elevated above 1.5x average
Example: IndusInd Bank on October 23, 2024 — two days before the infamous −17 percent crash. Open Rs 1,274.35, High Rs 1,284.90, Low Rs 1,266.50, Close Rs 1,274.30. The body was just Rs 0.05 (0.3 percent of the Rs 18.40 range). Upper wick Rs 10.55 (57.3%), lower wick Rs 7.80 (42.4%). Volume was 1.55x the 20-day average. The doji represented maximum confusion: buyers and sellers were both fighting for control but neither could move the needle.
What happened next: Two sessions later IndusInd Bank opened Rs 1,163.00 and collapsed to Close Rs 1,041.60 — a −17.10 percent single-day crash on massive volume (57 million shares vs 3 million average). The 10-day low reached Rs 1,018.10 (−20.11 percent). The long-legged doji was the last warning: maximum indecision before a news-driven collapse. Traders who treated the doji as an exit signal saved themselves from one of the biggest single-day losses of 2024.

Four-Price Doji
The FOUR-PRICE DOJI is the rarest of the family — and the least tradeable. The name describes it literally: Open, High, Low, and Close are all the same price. The candle is a single horizontal line with no body and no wicks. This happens when a stock trades at exactly one price for the entire session, usually because of a circuit filter (NSE upper or lower circuit lock) or a complete absence of participants.
Four-price dojis are almost always technical artifacts, not signals. They show up in illiquid small-caps, in penny stocks hit by circuit filters, or occasionally in F&O contracts far from the money. For liquid large-cap stocks they are essentially non-existent — across all 39 Nifty stocks over the last 5 years, zero four-price dojis were detected using the strict zero-range definition. The takeaway: if a four-price doji appears in a liquid name, investigate for data errors or trading halts before treating it as a signal.
Doji vs Spinning Top — The Critical Difference
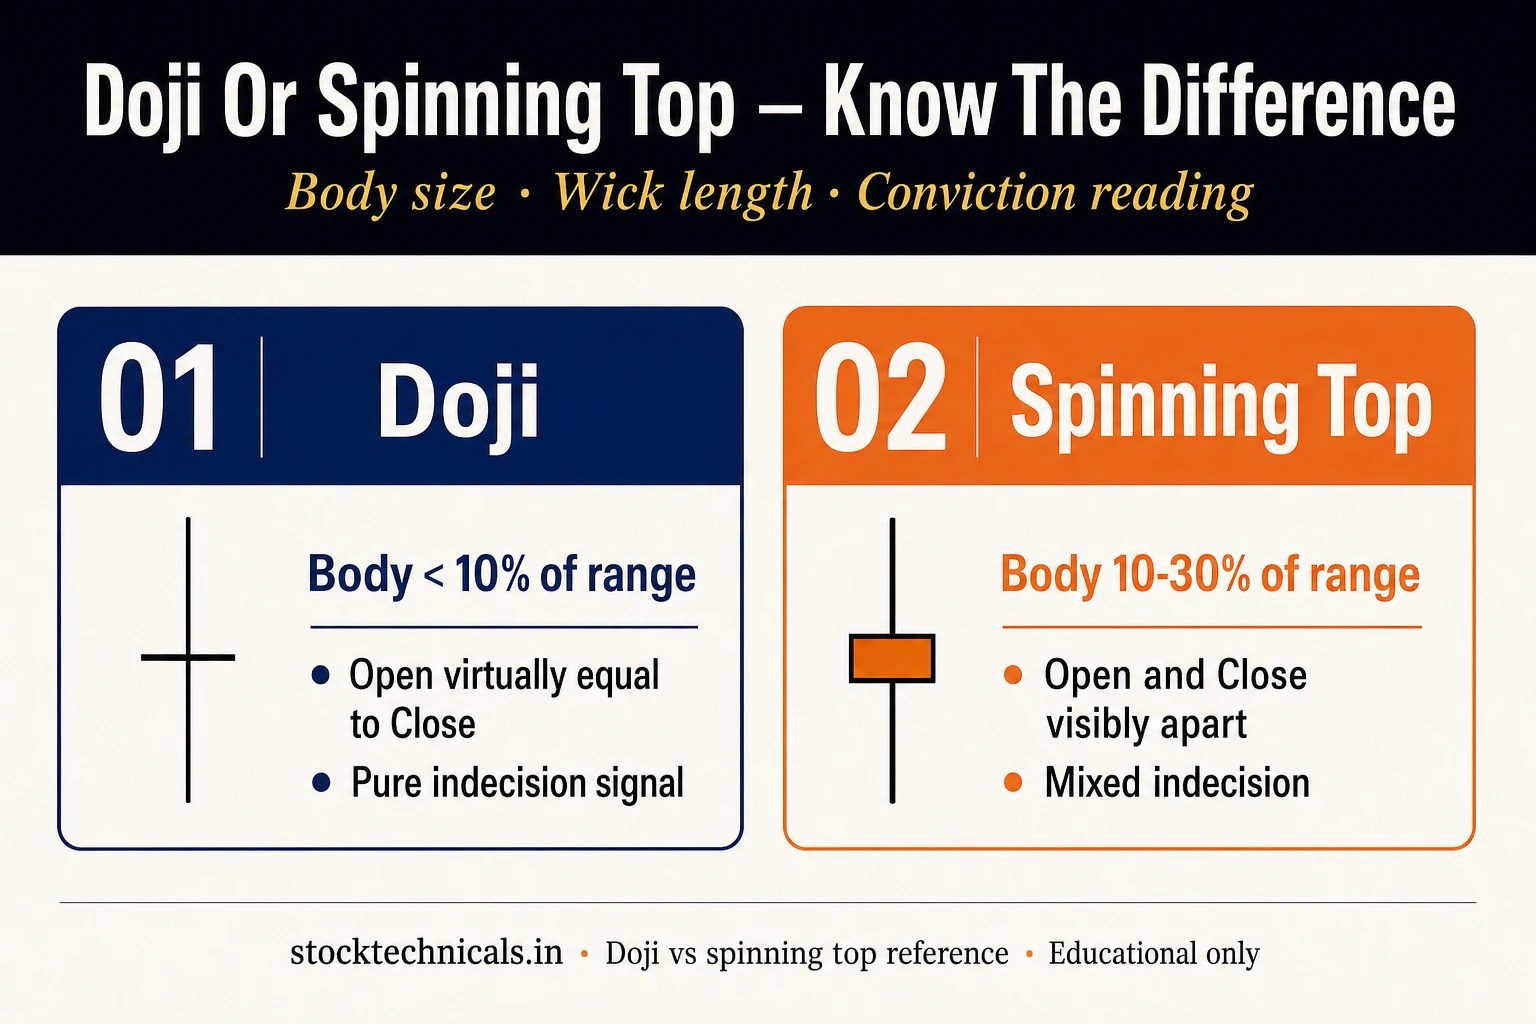
Beginners often confuse dojis with spinning tops. Both show indecision. Both have small bodies with visible wicks. The difference is a hard numerical line: a doji’s body is LESS THAN 10 percent of the range, while a spinning top’s body is between 10-30 percent. A doji is absolute indecision. A spinning top is near-indecision with a slight directional lean.
Spinning tops are weaker signals. A doji at a rally top carries more weight than a spinning top at the same location because the body really is zero — there is no argument about direction at all. When in doubt, measure: if the body is under 10 percent of range, treat it as a doji; if it is 10-30 percent, treat it as a spinning top with reduced reliability.
When Dojis Fail — The Teaching Example
Not every doji produces a reversal. Many dojis fail, particularly when volume is light or the trend context is wrong. A doji in the middle of an established strong trend on below-average volume has almost no predictive value — the indecision is a one-day pause inside a larger trend that is still dominant.
Example: Maruti Suzuki on August 13, 2025. Maruti was in a strong uptrend from Rs 12,524 to Rs 12,840 over the prior 5 sessions. On 13 August the stock printed a near-textbook doji shape: Open Rs 12,840, High Rs 12,925, Low Rs 12,752, Close Rs 12,834. Body Rs 6.00 (just 3.5 percent of range). Upper wick 49.1 percent, lower wick 47.4 percent — a long-legged doji in shape. But volume was just 0.96x the 20-day average — BELOW average. There was no conviction behind the indecision.
What happened next: The doji was completely ignored. Five sessions later Maruti closed Rs 14,280 (+11.27 percent). The 10-day high reached Rs 14,895 (+16.06 percent). The prior trend simply continued. The lesson: a doji in the middle of a strong trend on light volume is noise, not signal. Always check volume before treating any doji as a reversal trigger.

Doji Around Event Days
Event-driven dojis are a different animal. Earnings announcements, budget days, RBI policy days, and election results all produce violent one-day moves that can leave a doji footprint. These dojis are not classical reversal signals — they are exhaustion markers showing the market has absorbed the shock and is now searching for a new direction.
Example: Larsen & Toubro on March 2, 2026. On 24 February LT had crashed 3.6 percent (the Evening Star top covered in the bearish patterns article). On 2 March LT printed a massive long-legged doji: Open Rs 4,061.00, High Rs 4,141.40, Low Rs 3,975.40, Close Rs 4,066.70. Body Rs 5.70 (3.4 percent of the Rs 166 range). Upper wick 45 percent, lower wick 51.6 percent. Volume was 3.04x the 20-day average — heavy participation in the indecision.
What happened next: The doji marked the end of the initial sell-off but NOT the bottom. Five sessions later LT closed Rs 3,876.00 (−4.69 percent from the doji). The 10-day low reached Rs 3,396.60 (−16.48 percent). The doji meant the panic phase was over; a slower bleed phase was beginning. Event-day dojis are transitional — they are not tradeable in the traditional sense. Wait for a new pattern to form before acting.

Where Doji Candles Have the Most Power
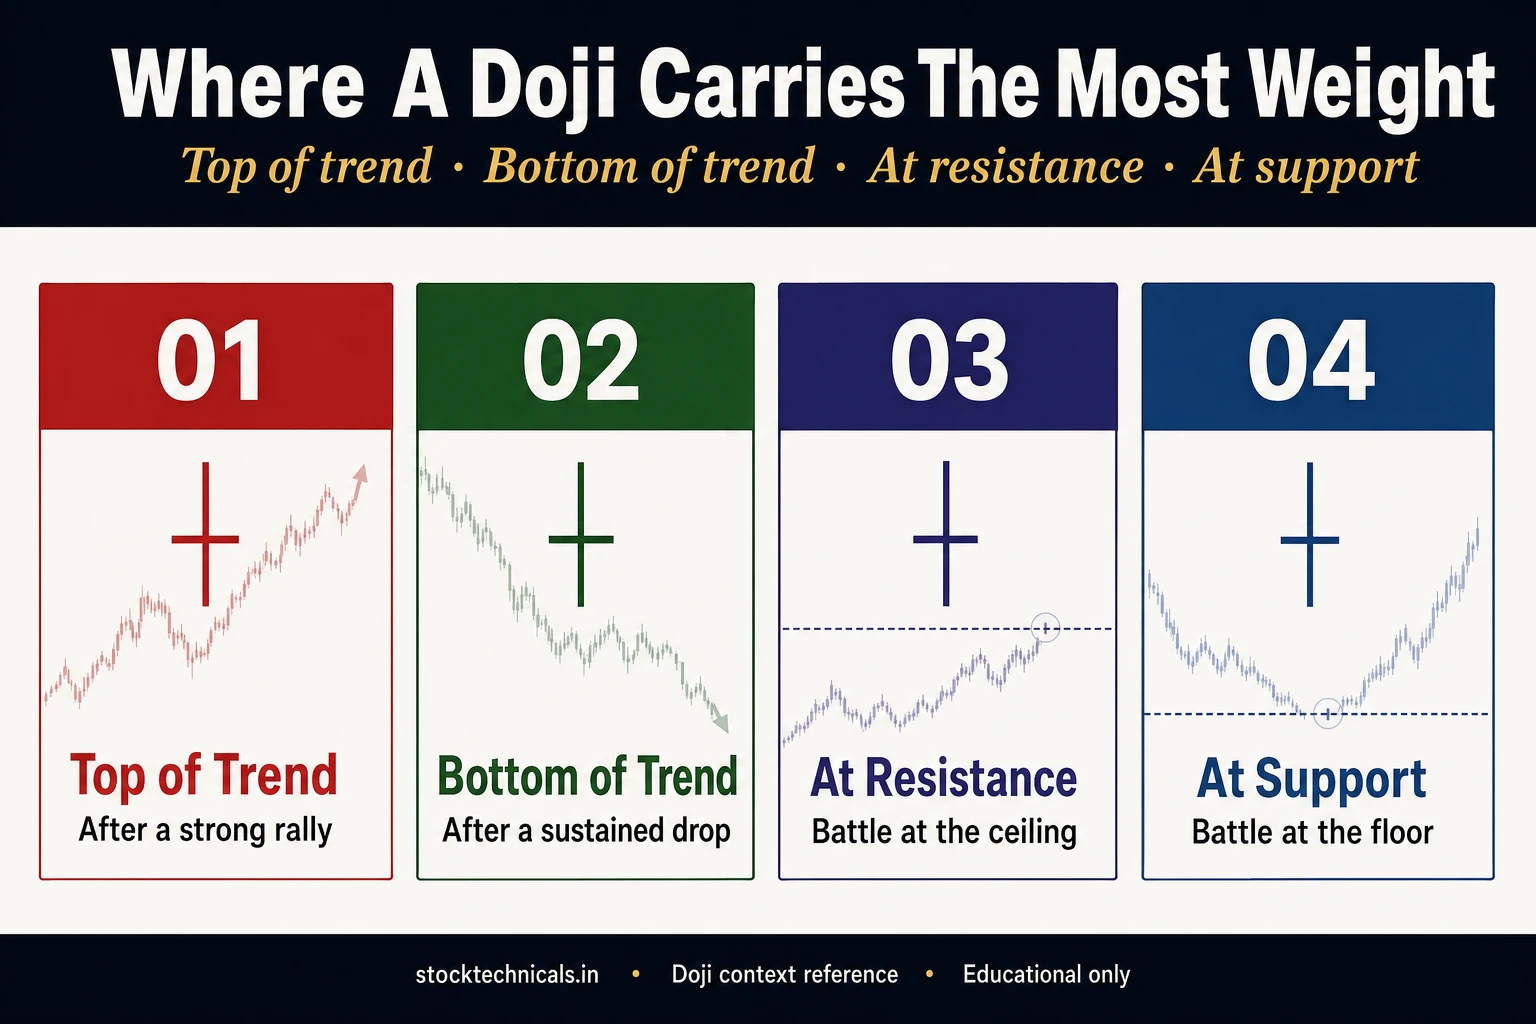
Location is the single most important factor for doji interpretation. The same doji at different locations means completely different things:
- At support levels after a downtrend — strongest bullish signal. Sellers failed to break support, buyers defended the line.
- At resistance levels after an uptrend — strongest bearish signal. Buyers failed to break resistance, sellers defended.
- At fresh all-time highs — gravestone and long-legged dojis here are major warnings. No overhead supply means the only way to fail is loss of buyer conviction.
- At Fibonacci retracement levels — adds confluence. A doji at the 61.8% retracement during a correction is a classic entry zone.
- During earnings season or around major events — exhaustion markers, not reversal signals. Wait for a new pattern.
- In sideways ranges — essentially no meaning. Ignore and wait for direction.
- In the middle of a strong trend on light volume — failed signals. Trend wins.
How to Confirm and Trade a Doji
Dojis are NEVER traded on the doji candle itself. Confirmation is mandatory. Here is the three-step protocol:
Step 1: Assess location and volume
Is the doji at a known support/resistance level, Fibonacci retracement, or trend boundary? Is volume above 1.5x the 20-day average? If yes to both, the doji is tradeable. If either is no, skip it.
Step 2: Wait for the next candle
The NEXT session is the confirmation session. For a bullish doji signal (at a bottom), the next candle must close above the doji high. For a bearish doji signal (at a top), the next candle must close below the doji low. Without this confirmation, the doji is just indecision and the trade is invalid.
Step 3: Enter with defined risk
Entry is at the open of the session after confirmation. Stop-loss goes at the far extreme of the doji: above the high for short entries, below the low for long entries. Target is the next visible support/resistance level. Minimum risk-reward is 1:2 — if the math does not work, skip the trade even if the setup is valid.
Doji and Volume — The Hidden Confirmation
Volume is the single best doji filter. A doji on heavy volume means the indecision is real — lots of traders participated and still could not break the balance. A doji on light volume means nobody cared — the pause is just a quiet session, not a battle. The Maruti failed-doji example above shows exactly this: shape was correct, location was wrong for the rule (middle of uptrend), and volume was light (0.96x average). The pattern failed predictably.
- Volume above 1.5x average = doji is tradeable on confirmation
- Volume between 0.8x and 1.5x = marginal signal, wait for stronger confirmation
- Volume below 0.8x = treat doji as failed signal, ignore
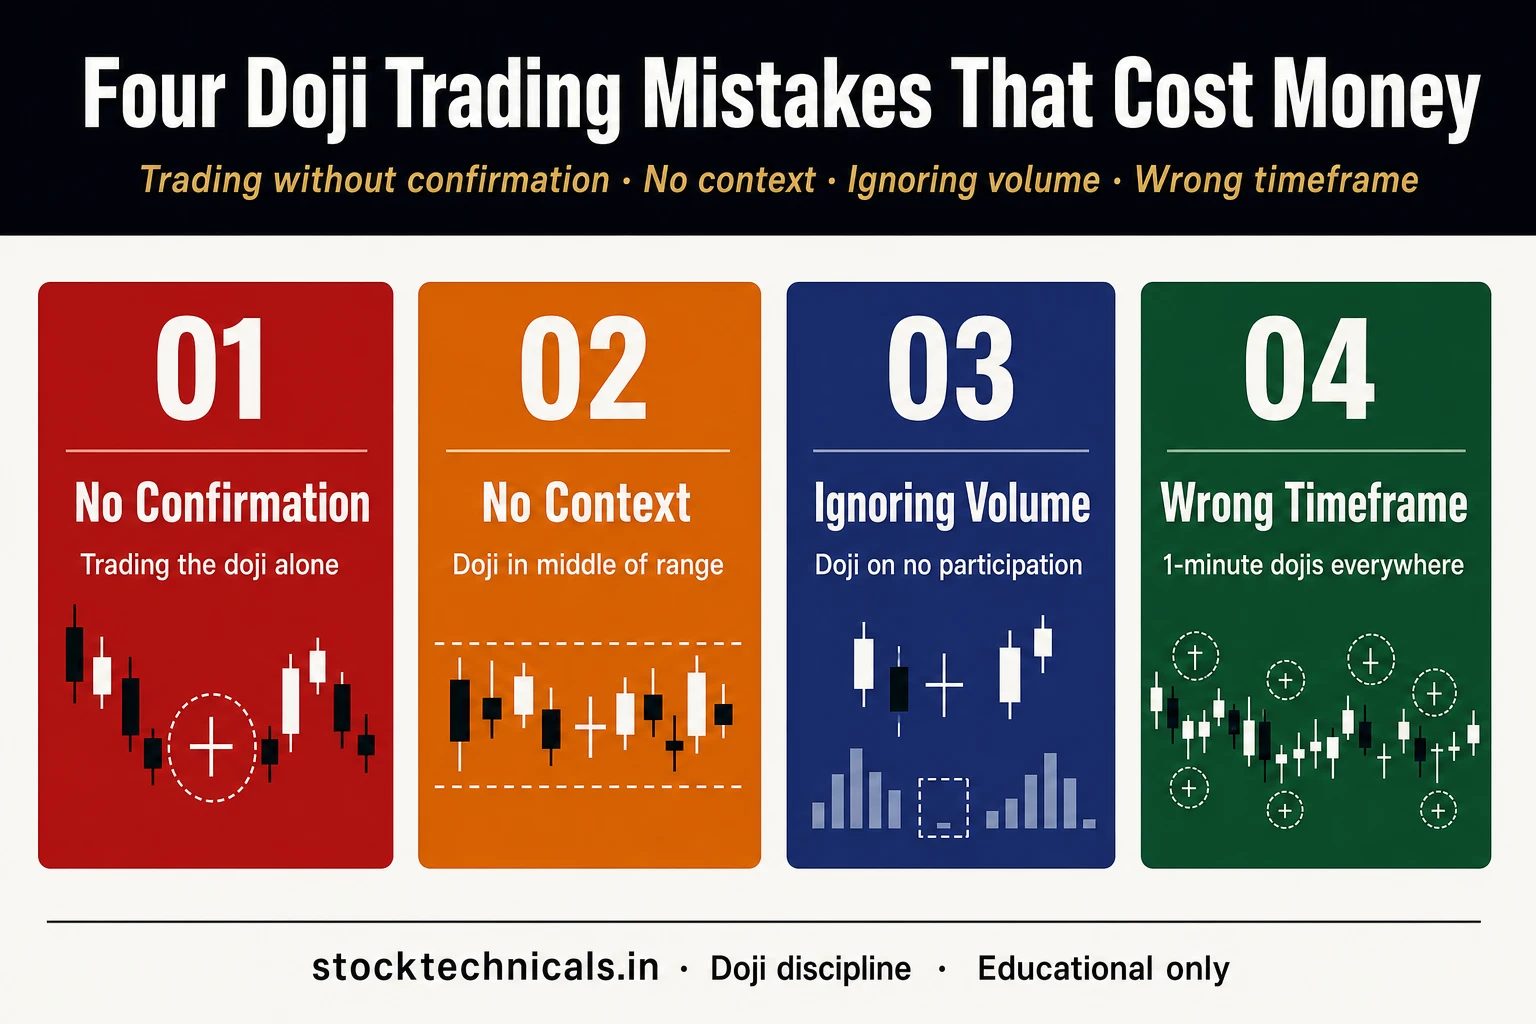
Common Doji Trading Mistakes
- Trading every doji regardless of location (most dojis in chop zones are meaningless)
- Ignoring volume (a doji without volume confirmation is just noise)
- Entering on the doji day instead of waiting for the next candle to confirm
- Treating event-day dojis as reversal signals (they are exhaustion, not reversal)
- Setting stop-loss too tight (the stop must go beyond the doji wick, not the body)
- Confusing dojis with spinning tops (spinning tops have 10-30% bodies, dojis have under 10%)
- Ignoring the prior trend context (dojis only signal reversal if there is a trend to reverse)
Interactive Tool: Doji Decoder
Practice identifying doji subtypes from real OHLC data with this interactive tool. Six NSE examples cycle through, and a 5-question quiz tests your understanding of the doji rules.
Interactive Tool: Doji Decoder
Identify the doji subtype from real NSE OHLC data and read the signal
The Bottom Line
A doji is a pause, not a prediction. It is the market saying: "I do not know what to do next." Whether that pause becomes a reversal or a continuation depends entirely on three factors: WHERE the doji appears (location), HOW MANY participants were involved (volume), and WHAT HAPPENS NEXT (confirmation).
The five subtypes — Standard, Dragonfly, Gravestone, Long-Legged, and Four-Price — all share the same zero-body core but carry different signal strengths based on wick geometry. Gravestone at a top and Dragonfly at a bottom are the cleanest signals. Standard doji at either extreme is moderately reliable. Long-legged doji means maximum indecision and often precedes violent moves in either direction — wait for the breakout before committing.
Memorise the anatomy. Recognise the subtypes. But never trade a doji without the three filters: location, volume, confirmation. The indecision candle is valuable precisely because it is rare at critical levels — when it shows up at the right place with the right volume, it is often the cleanest signal any chart can give you.
| Doji subtype | Open ≈ Close shape | Signal strength | Best location |
|---|---|---|---|
| Standard Doji | Small body, equal wicks | Indecision | Anywhere |
| Long-Legged Doji | Long upper + lower wick | Strong indecision | After trend |
| Dragonfly Doji | Long lower wick, no upper | Bullish reversal | At support |
| Gravestone Doji | Long upper wick, no lower | Bearish reversal | At resistance |
| Four-Price Doji | All four prices equal | Extreme low volume | Rare — ignore |
“The market does not beat them. They beat themselves, because though they have brains, they cannot sit tight.”
— Jesse Livermore, Reminiscences of a Stock Operator
What is a doji candle in simple terms?
A doji is a candlestick where the opening price and the closing price are nearly identical (within 0.1 percent) — which means the body is less than 10 percent of the total range. Visually the body looks like a horizontal line with wicks above and below. It represents indecision: buyers and sellers fought during the session and neither won. Dojis are most meaningful at trend extremes where they can signal exhaustion and potential reversal.
How many types of doji candles exist?
Five main types: Standard (balanced wicks), Dragonfly (long lower wick, body at top), Gravestone (long upper wick, body at bottom), Long-Legged (both wicks large), and Four-Price (all four prices identical, extremely rare). The shape difference comes from wick geometry — the body is nearly zero in all five cases. Each subtype carries a different signal depending on location.
Is a doji bullish or bearish?
Neither by itself — a doji is neutral indecision. The signal direction depends on WHERE it appears. A Dragonfly Doji at the bottom of a downtrend is bullish. A Gravestone Doji at the top of an uptrend is bearish. A Standard Doji inside a sideways range is neither — just noise. Always read a doji in the context of the prior trend, not in isolation.
How reliable are doji candles as reversal signals?
Moderate to high when combined with the right filters. A Gravestone Doji at a resistance level with volume above 1.5x the 20-day average and a confirming red candle the next day has a high probability of signaling a top. The same gravestone in a chop zone on light volume is essentially worthless. Reliability comes from location plus volume plus confirmation — never from the shape alone.
What is the difference between a doji and a spinning top?
The body size. A doji has a body that is less than 10 percent of the total range (open equals close). A spinning top has a body between 10-30 percent of the range (open and close are close but not identical). Both show indecision, but a doji shows absolute indecision while a spinning top shows near-indecision with a small directional bias. Dojis are slightly stronger signals.
How do I trade a doji candle?
Three steps. (1) Check location: is the doji at a known support/resistance level, Fibonacci retracement, or trend boundary? (2) Check volume: above 1.5x the 20-day average? (3) Wait for the NEXT candle to confirm direction. For a bullish signal, the next candle must close above the doji high. For a bearish signal, below the doji low. Enter on the open after confirmation, stop-loss beyond the doji wick, minimum risk-reward 1:2.
Can a doji appear in the middle of a trend?
Yes, and it usually means nothing. Dojis in the middle of strong trends are one-day pauses, not reversal signals — the trend context overwhelms the indecision. The Maruti Suzuki example on August 13, 2025 showed a textbook doji shape in the middle of a strong uptrend on light volume. The market ignored it completely and the uptrend added another 11 percent over the following five sessions. Always check if there is a trend to reverse before trusting a doji.
Why are event-day dojis different from regular dojis?
Event-day dojis (earnings, budget, RBI policy, election results) are exhaustion markers, not reversal signals. They mark the moment the market has absorbed a major shock and is searching for a new direction. The LT March 2, 2026 example showed a massive long-legged doji after a prior crash day — but price kept falling 4.7 percent more over the next five sessions. Event-day dojis say "the panic is over" but do NOT say "the move is over." Wait for a new pattern to form before acting.
Related Articles:
- What Are Candlestick Charts?
- Anatomy of a Candlestick
- Bullish Candlestick Patterns
- Bearish Candlestick Patterns
- Hammer and Hanging Man
- Engulfing Patterns Detailed look
- Support and Resistance
- Volume in Trading
- What is a Trend?
A Doji is indecision, not a signal. Wait for the next candle before acting. Per the SEBI FY24-25 study, 91 percent of individual equity F&O traders lost money — many from trading the Doji itself.