Three White Soldiers and Three Black Crows Explained

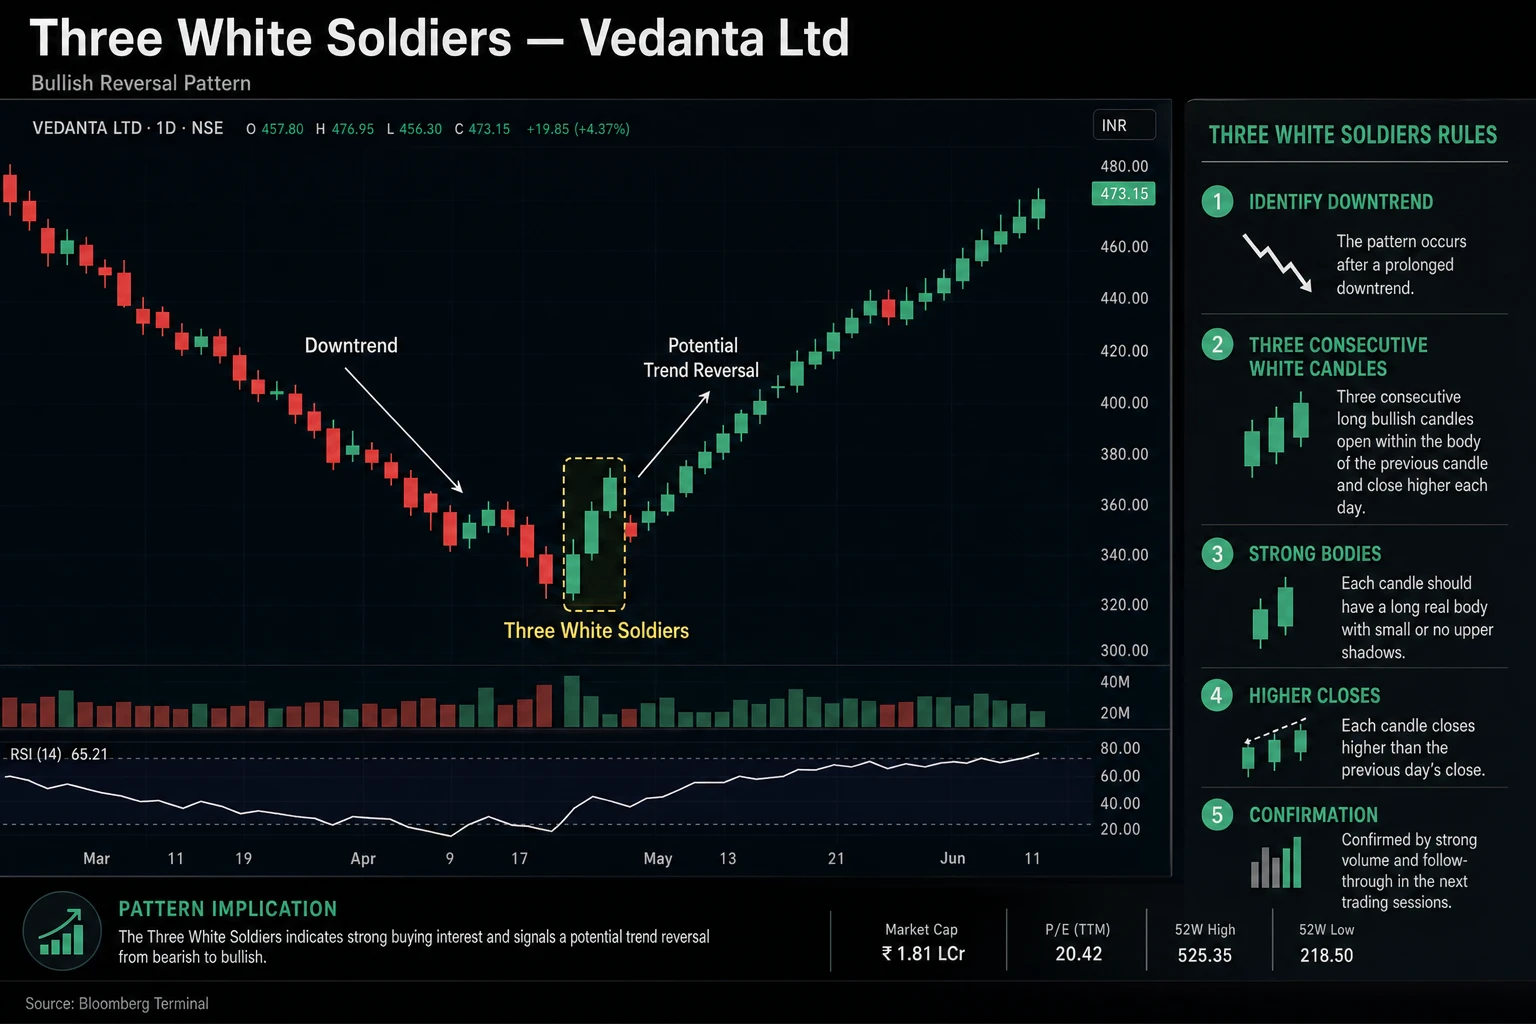
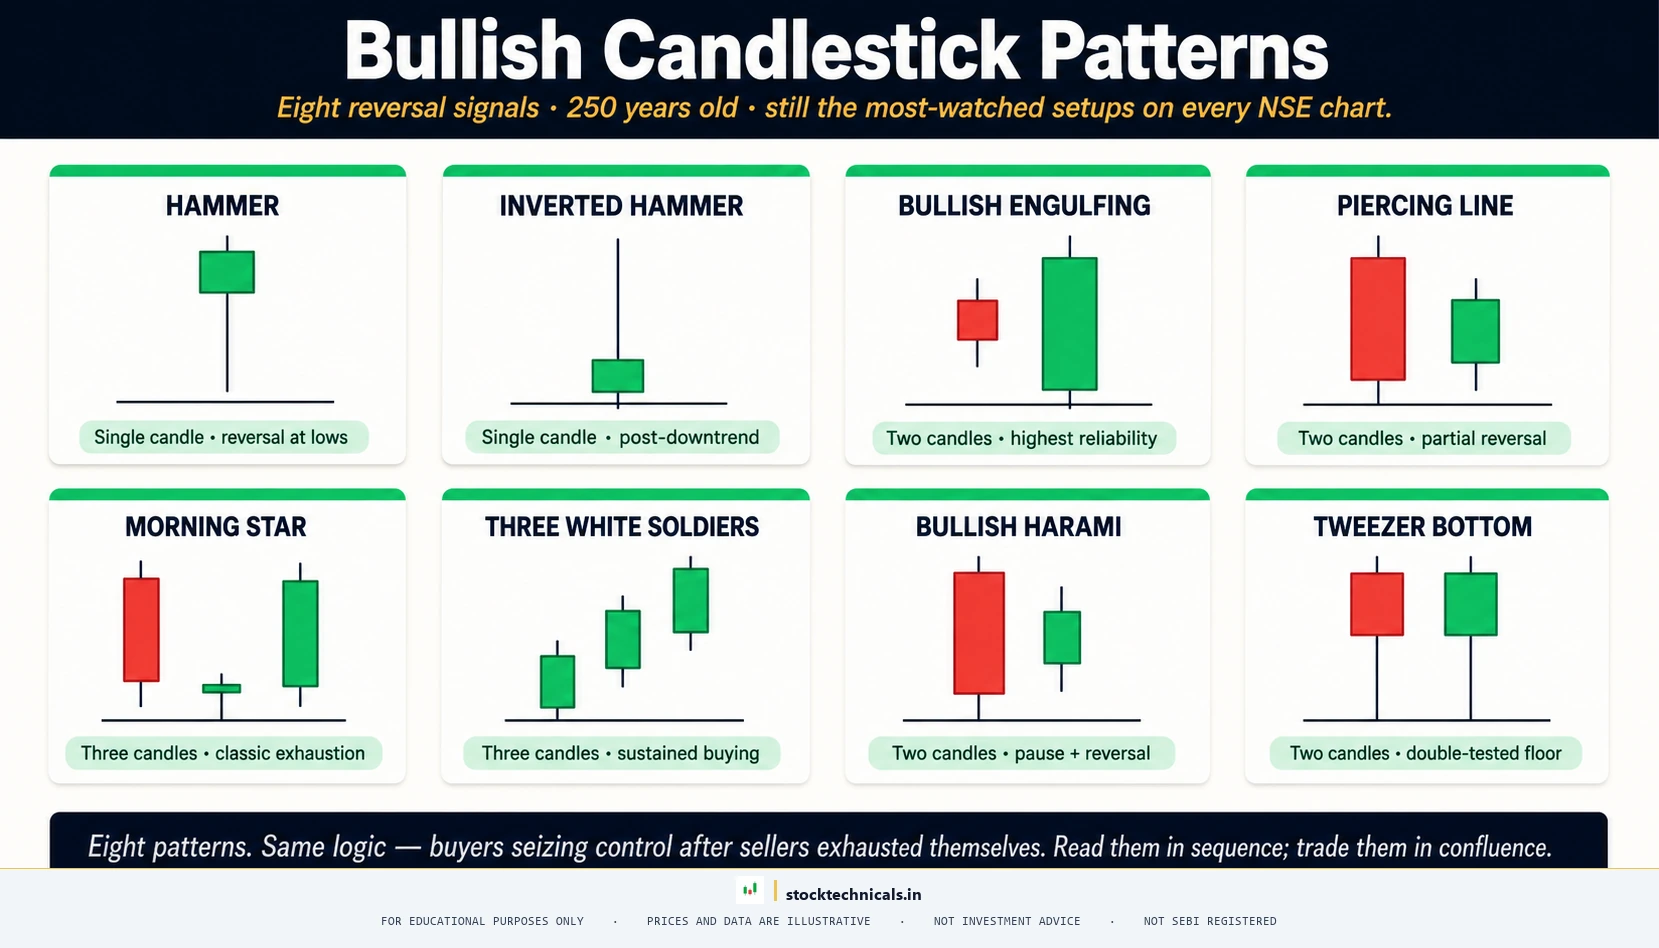
Most candlestick patterns are single-candle signals. A doji here, a hammer there — useful, but they represent one session of market activity. THREE WHITE SOLDIERS and THREE BLACK CROWS are different. These patterns span three full trading sessions, and that extended timeframe is exactly what makes them more reliable than almost any single-candle formation. When … Read more

Marubozu Candlestick Pattern: The Naked Candle That Signals Dominance

The Marubozu — meaning “bald” or “shaven” in Japanese — is a candlestick with NO wicks (or nearly none). It shows complete dominance by one side for the entire session. Unlike most candlestick patterns which signal REVERSALS, the Marubozu is primarily amomentum CONTINUATION pattern. When it appears in a strong uptrend, it signals buyers are … Read more

Shooting Star vs Inverted Hammer

The shooting star and inverted hammer are arguably the most fascinating candlesticks in technical analysis — they have theexact same shape but signalopposite directions based entirely on where they form. At the top of an uptrend, this candle is a shooting star (bearish reversal). At the bottom of a downtrend, the same candle becomes an … Read more

Morning Star and Evening Star Patterns with Chart Examples

The morning star and evening star are three-candle reversal patterns that rank among the most reliable in candlestick analysis. Independent pattern research ranks the These three-candle patterns tend to be more reliable than two-candle patterns because they tell a more complete reversal story: trend confirmation, exhaustion, and reversal confirmation across three sessions of evidence. But … Read more

Engulfing Patterns: Bullish and Bearish Setups for Trading

The engulfing pattern is one of the most recognisable two-candle reversal signals in technical analysis. But there is a critical distinction between an engulfing pattern that LOOKS correct geometrically and one that actually signals a reversal. This article shows the difference using real NSE data, verified against strict trend and follow-through criteria. According to That … Read more

Doji Candles Explained

Every chart has one candle that stops the argument. Bulls were winning. Bears were winning. Then a single candle prints where the open and the close are almost exactly the same. Neither side moved the needle by the end of the session. The pause has a name: DOJI. Quick Answer: A doji is a candlestick … Read more

Bearish Candlestick Patterns

Tops are quieter than bottoms. A bottom screams — panic, capitulation, volume spikes. A top whispers. Buyers simply stop showing up. The rally loses momentum, one candle at a time, and by the time the reversal is obvious the best exits are already gone. Quick Answer: Bearish candlestick patterns appear at the top of an … Read more

Bullish Candlestick Patterns

Most traders chase patterns. Profitable traders read what the patterns mean. There is a difference. Quick Answer: Bullish candlestick patterns appear at the end of a downtrend and signal that selling pressure is exhausting and buyers are stepping in. The eight most reliable are hammer, inverted hammer, bullish engulfing, piercing line, morning star, three white … Read more