The Marubozu — meaning “bald” or “shaven” in Japanese — is a candlestick with NO wicks (or nearly none). It shows complete dominance by one side for the entire session. Unlike most candlestick patterns which signal REVERSALS, the Marubozu is primarily amomentum CONTINUATION pattern. When it appears in a strong uptrend, it signals buyers are still in full control. In a downtrend, sellers are dominating without any intraday pushback.
Our NSE audit found233 bullish marubozu continuations,189 bearish marubozu continuations, and47 bearish marubozu reversals that passed the 4-criterion follow-through test. The sample is large because Marubozu appears frequently in trending markets — it is a signal OF momentum, not a signal of trend change.
Key Takeaways
- Marubozu = candle with body covering 90%+ of total range (no wicks). Shows one-sided dominance.
- Primary use: CONTINUATION pattern in established trends, not reversal. Most common candlestick misconception.
- Three types: Full Marubozu (no wicks), Opening Marubozu (no wick on open side), Closing Marubozu (no wick on close side).
- NSE audit: 233 bullish + 189 bearish continuations + 47 bearish reversals pass the 4-criterion follow-through test.
- Bearish marubozu at uptrend top can be a reversal signal — 47 qualify in our audit. Requires prior rally and pattern at 20-day high.
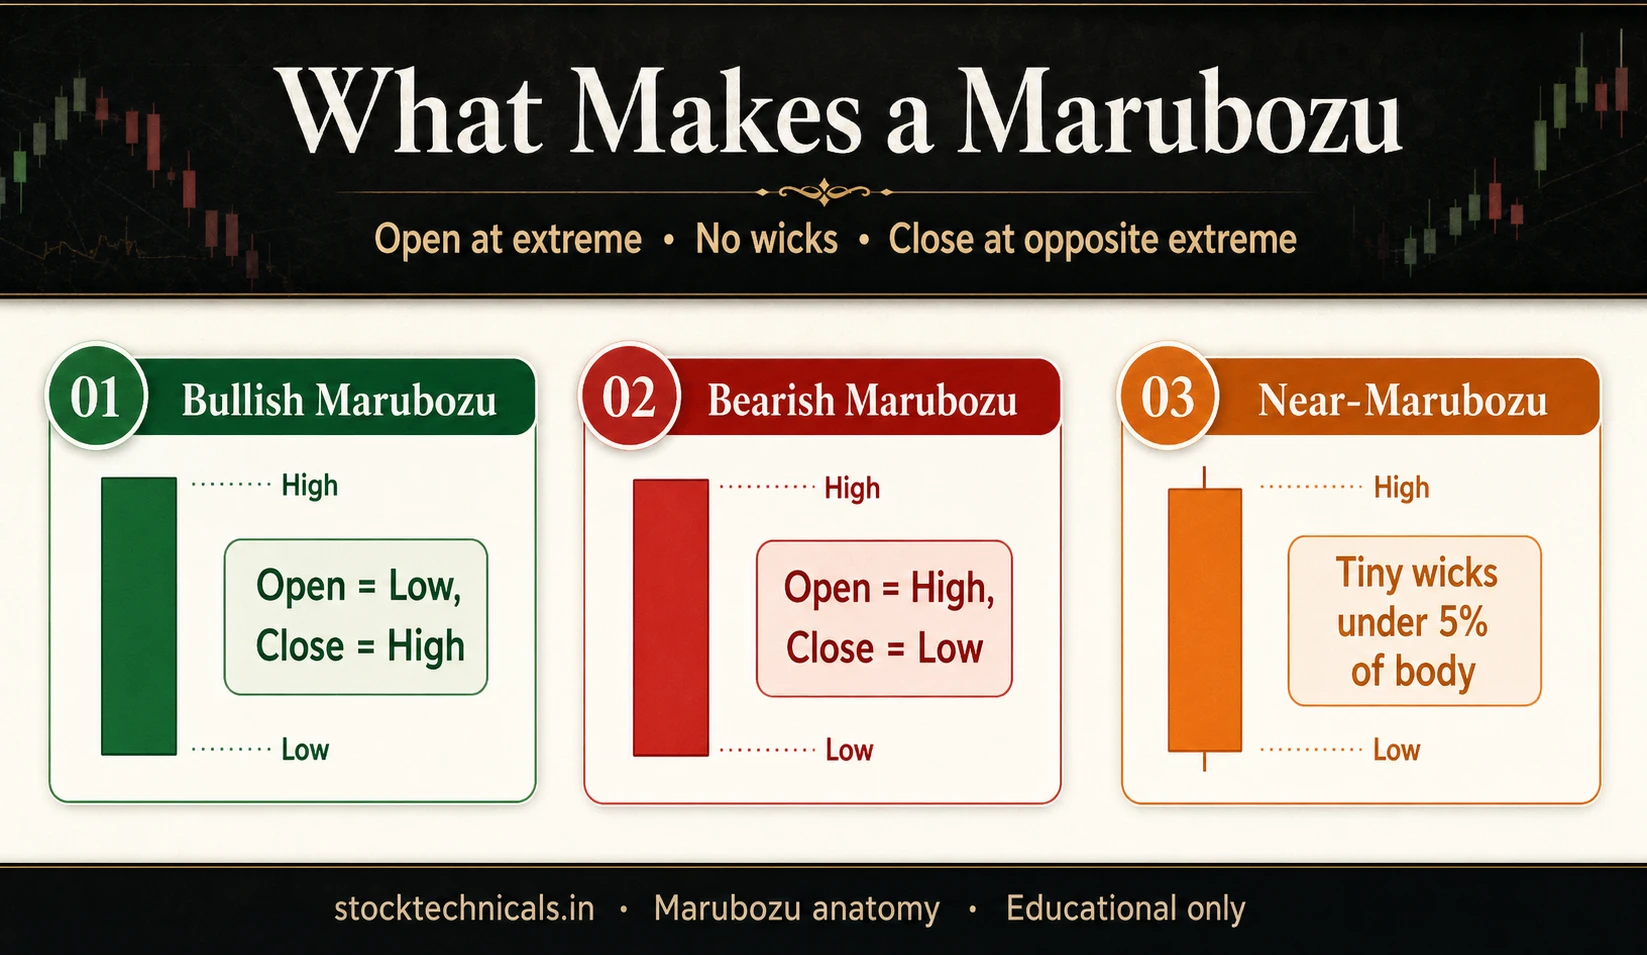
What Makes a Marubozu
The definition is geometric and strict. The body (open-to-close range) must cover at least 90% of the total candle range (high-to-low). Anything less is just a “long-body” candle, not a true Marubozu.
Full Marubozu
Open = Low AND Close = High (bullish) or Open = High AND Close = Low (bearish). No wicks on either end. Body = 100% of range. The strongest form.
Opening Marubozu
Open = Low (bullish) or Open = High (bearish) — tiny wick on the close side. Shows clean commitment on the open, with slight indecision near the close.
Closing Marubozu
Close = High (bullish) or Close = Low (bearish) — tiny wick on the open side. Momentum started slowly but finished strong. The strongest continuation signal because the session ENDED on the extreme.
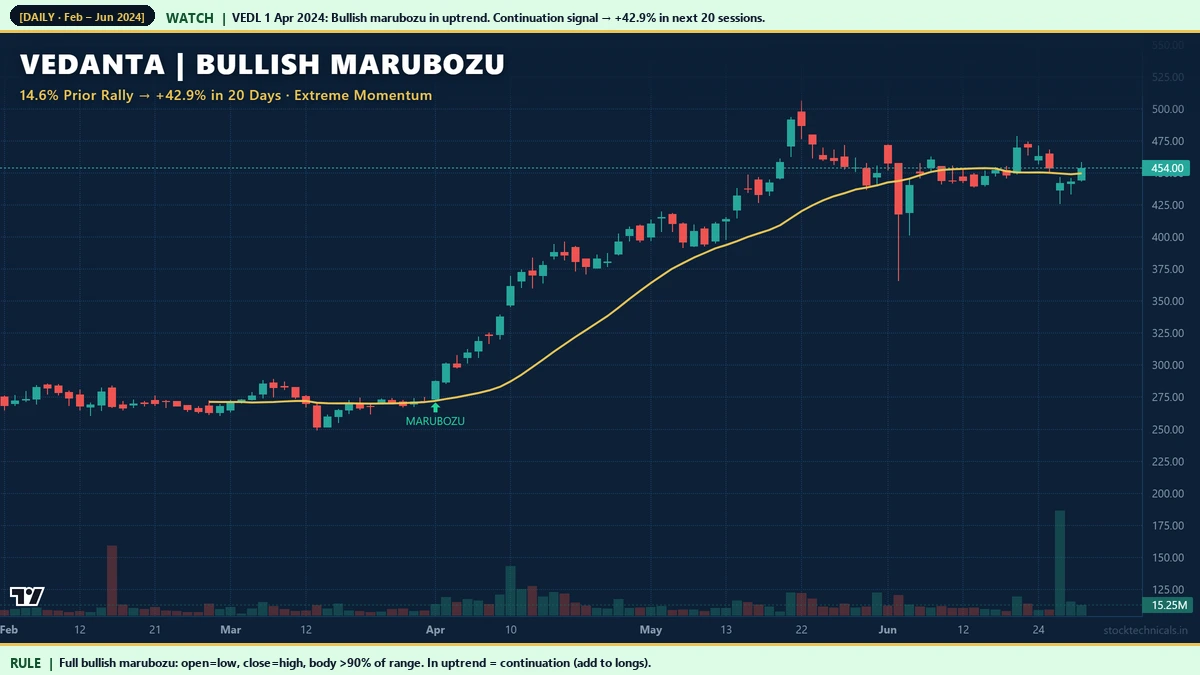
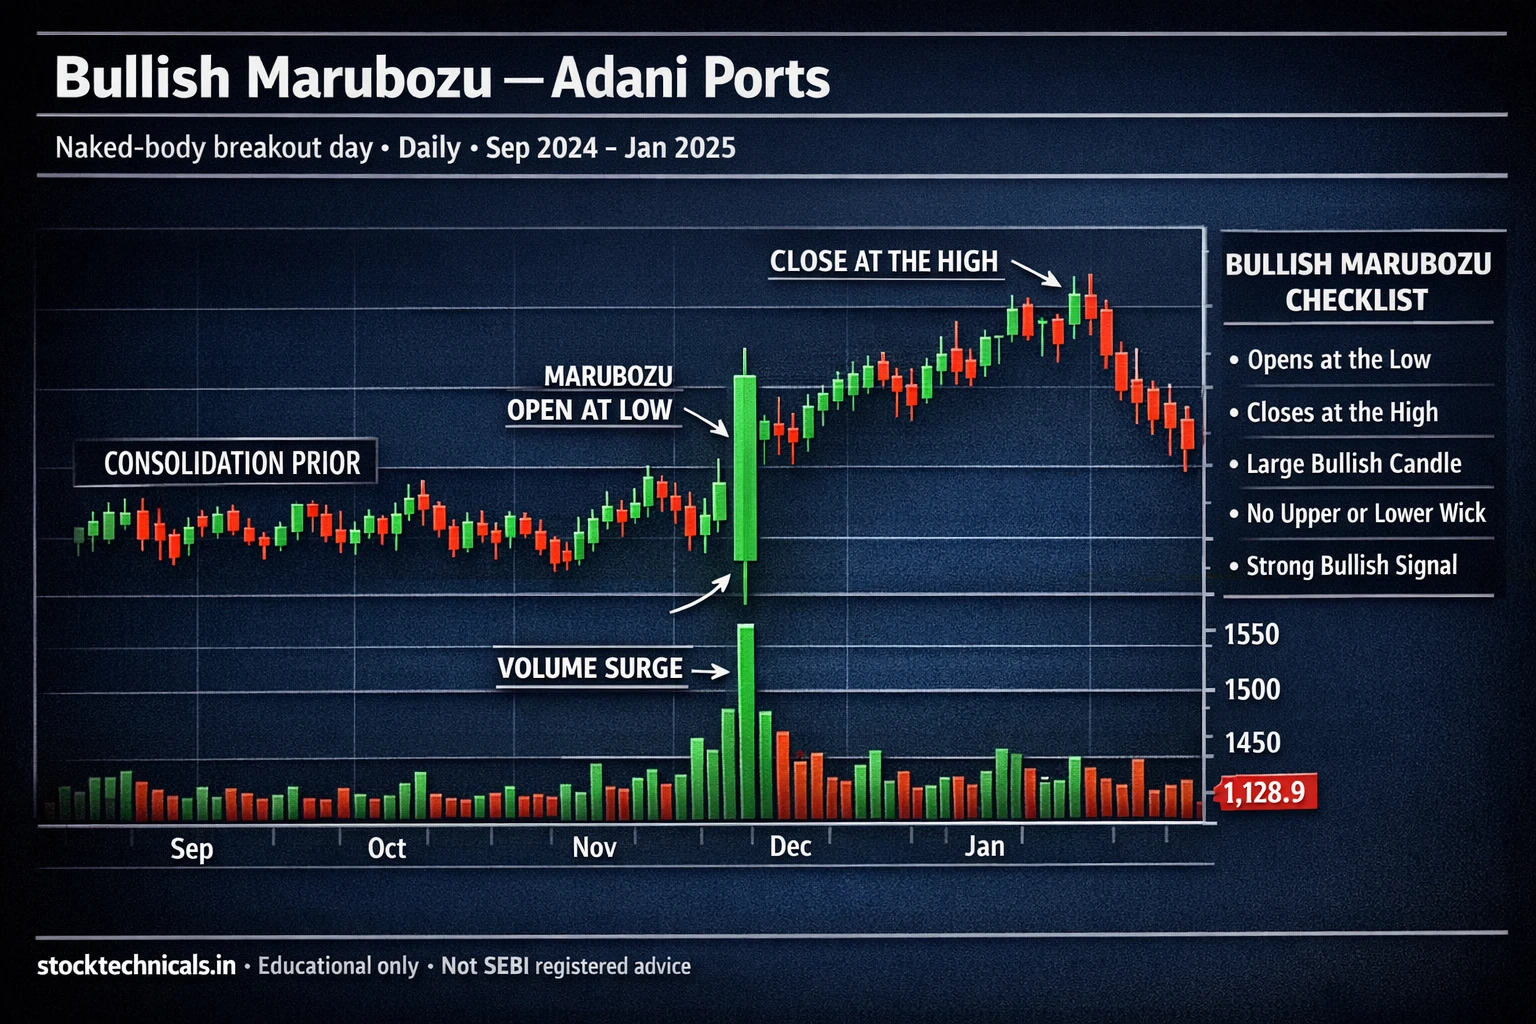
Bullish Marubozu in Action
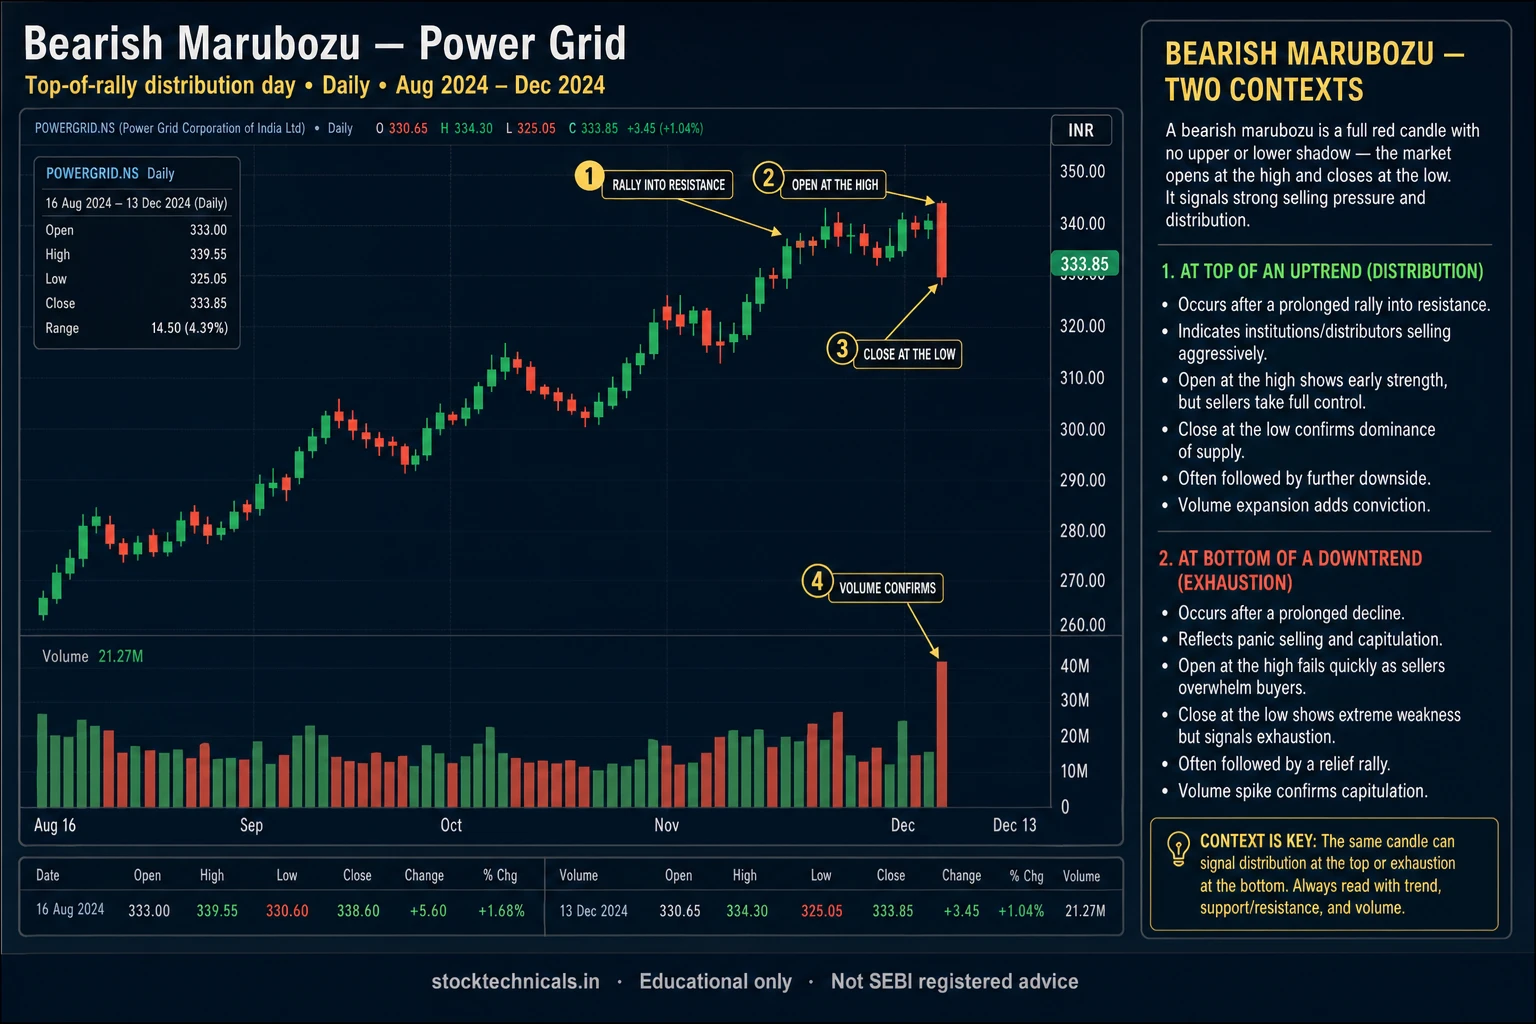
Bearish Marubozu: Two Contexts
Context 1: Bearish Continuation in Downtrend
Tata Consumer Products also printed a bearish marubozu on October 22, 2024 during the Q3 earnings cycle weakness. Same stock as Chart 02 (bullish marubozu in January) but opposite direction in October. Same stocks produce both types at different trend locations.
Context 2: Bearish Marubozu REVERSAL at Top (Rare)
When Bank Nifty (NSE: BANKNIFTY) prints a bearish marubozu at the index top (like September 27, 2024), it signals sector-wide sentiment shift. All major banks felt the decline in the following weeks. Index-level marubozu reversals are the heaviest-weight signals in this article.
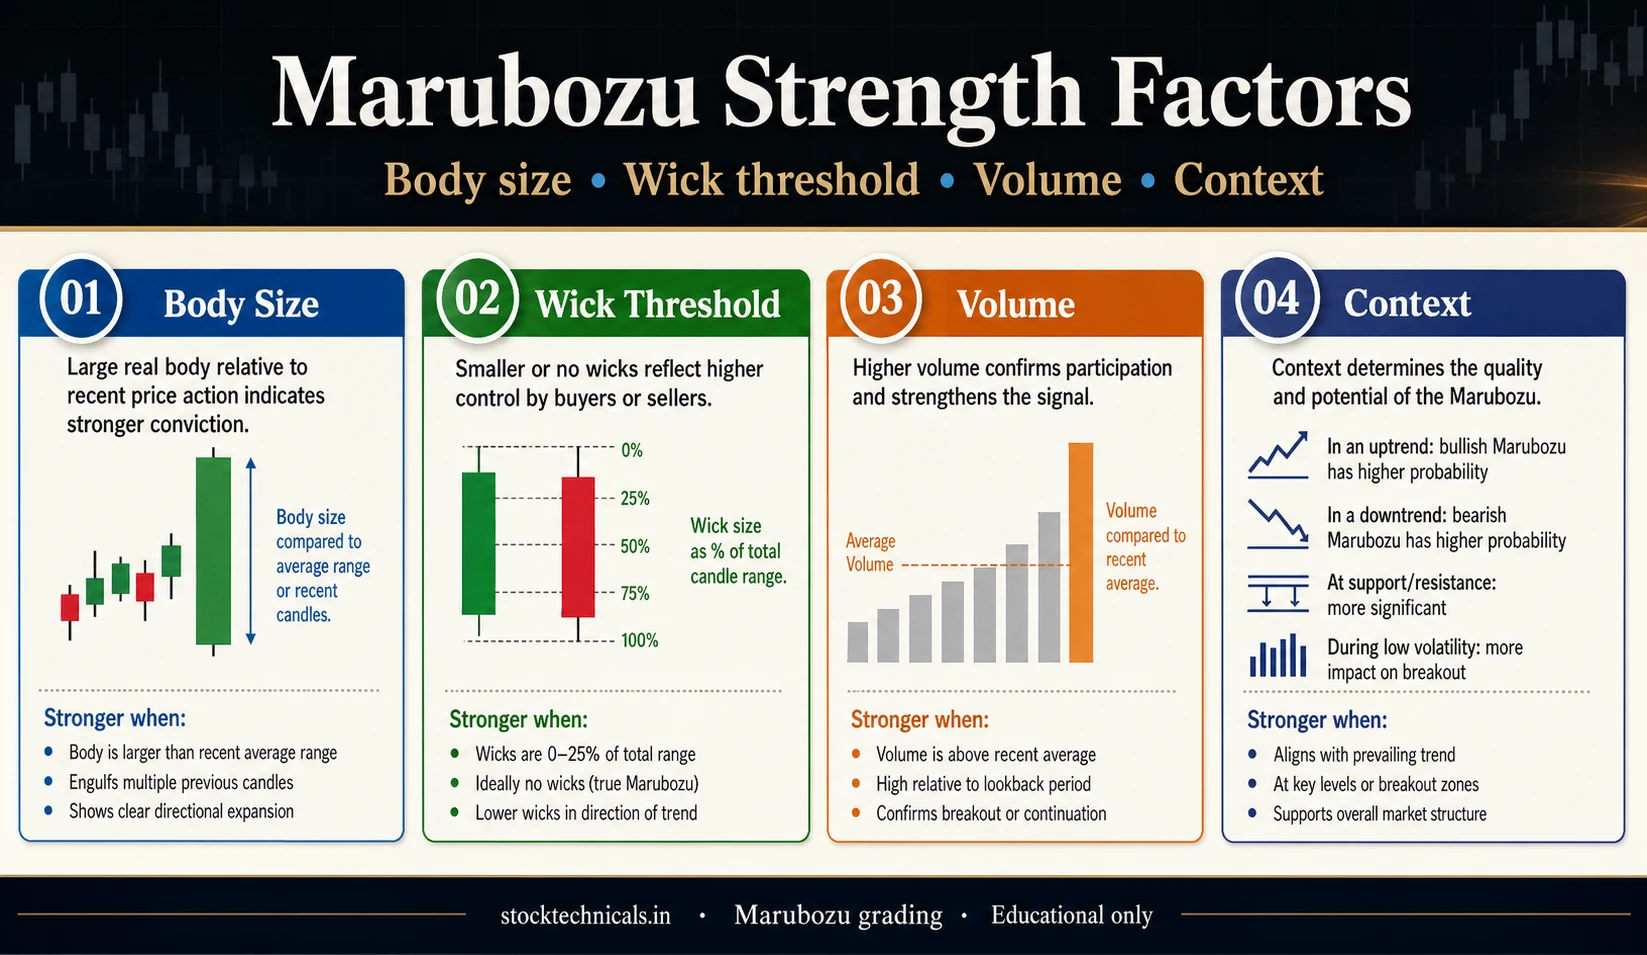
Strength Factors
Body-to-Range Ratio
The body must be at least 90% of the total range. Above 95% is ideal (near-Full Marubozu). Below 90% means it is not a true Marubozu — just a long-body candle.
Volume on the Pattern Day
Above 1.5x the 20-day trailing average is ideal. Heavy volume confirms institutional commitment, not just algorithmic gaps or thin-market anomalies.
Location in the Trend
For continuation: pattern should form WITHIN an established trend, not at the start or end. For reversal: at the 20-day extreme with prior opposing trend.
Body Size vs Average True Range
A Marubozu whose body exceeds 1.5x the 14-day ATR is significantly larger than normal session ranges. This “outlier” behavior adds conviction — it signals regime change, not normal volatility.
Position Sizing and Trading Plan
For Continuation (Add to Existing Trend)
Bullish marubozu in uptrend: ADD to long positions on next-day open. Bearish marubozu in downtrend: ADD to shorts or stay out of long side. Stop at pattern low (bullish) or high (bearish).
For Reversal (Enter New Position)
Bearish marubozu at uptrend top: short next-day open if market confirms direction. Stop above pattern high. Target next support level or 1:2 risk-reward minimum.
F&O Weekly Expiry Context
NSE weekly F&O now expires Tuesday (SEBI rule change September 1, 2025). Bullish marubozu on Tuesday morning expiry sessions often signals short-squeeze as call writers cover. Bearish marubozu on expiry day indicates forced liquidation of over-leveraged long positions.
Common Mistakes
Mistake: Treating Every Long-Body Candle as Marubozu
A long body with a 5-10% wick is NOT a marubozu. The 90% body-to-range rule is strict. Most “marubozu” you see in social media posts do not actually qualify.
Mistake: Treating Marubozu as Reversal by Default
Marubozu is primarily CONTINUATION. In our audit, continuation signals outnumber reversal signals by roughly 9:1 (422 continuations vs 47 reversals). Assuming every marubozu is a reversal will cost you money.
Mistake: Ignoring the Prior Trend
A marubozu in a sideways market is just a big session — not a signal. Always require a clear prior trend (continuation) or prior opposite trend (reversal) before trading.
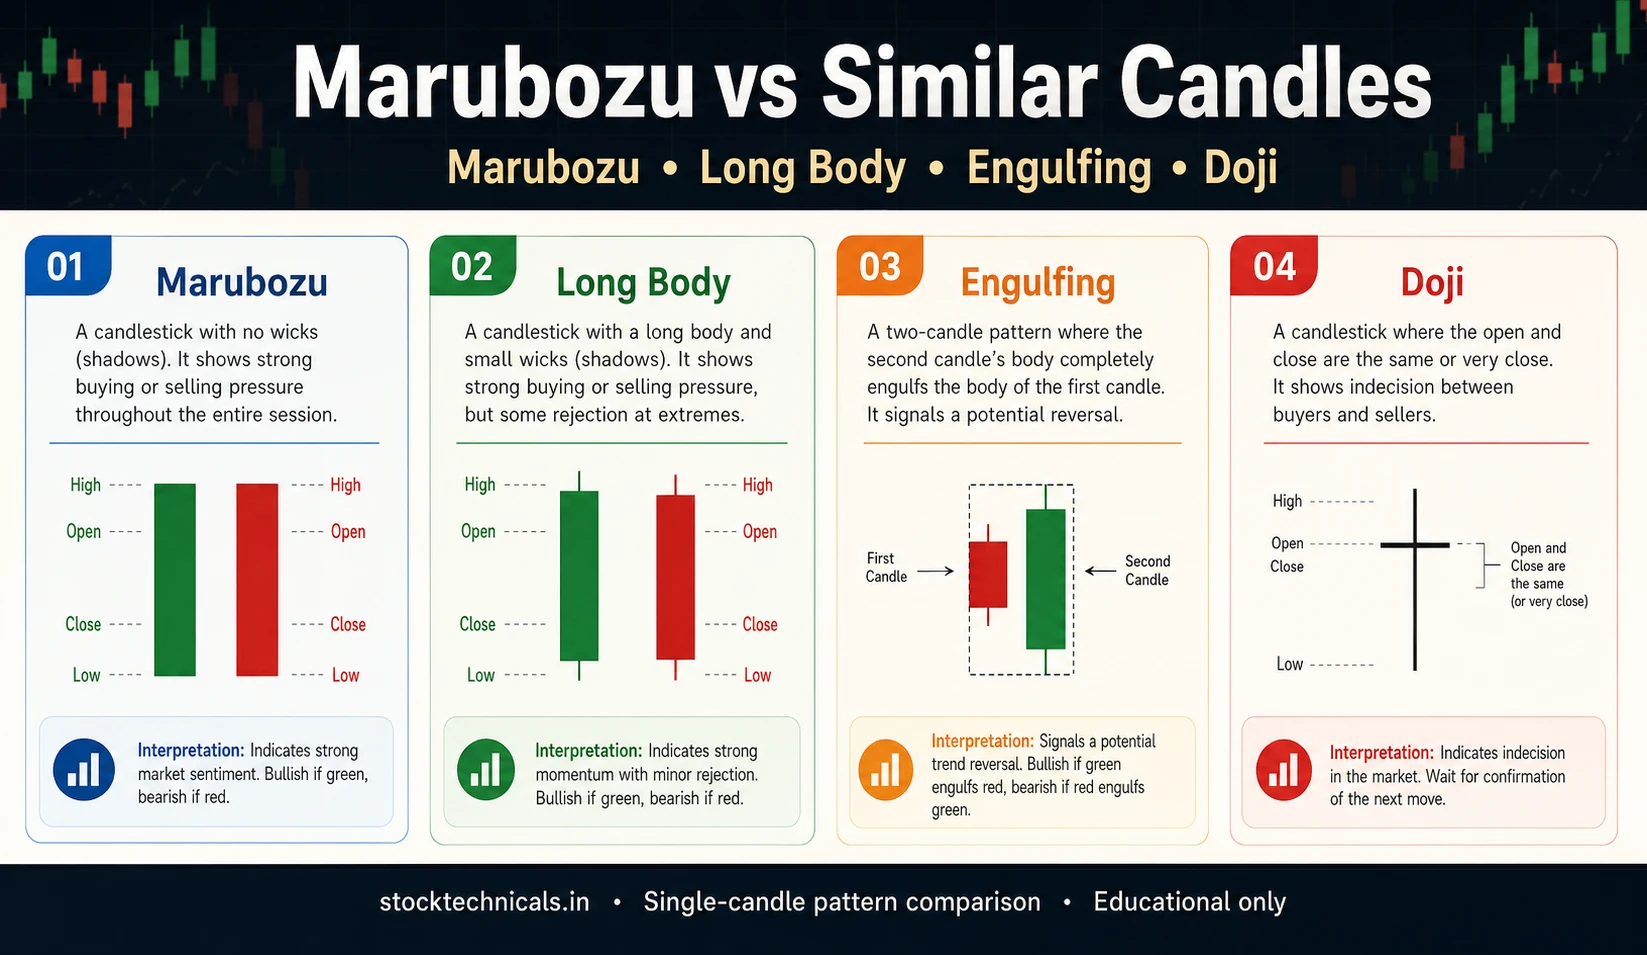
Marubozu vs Similar Candles
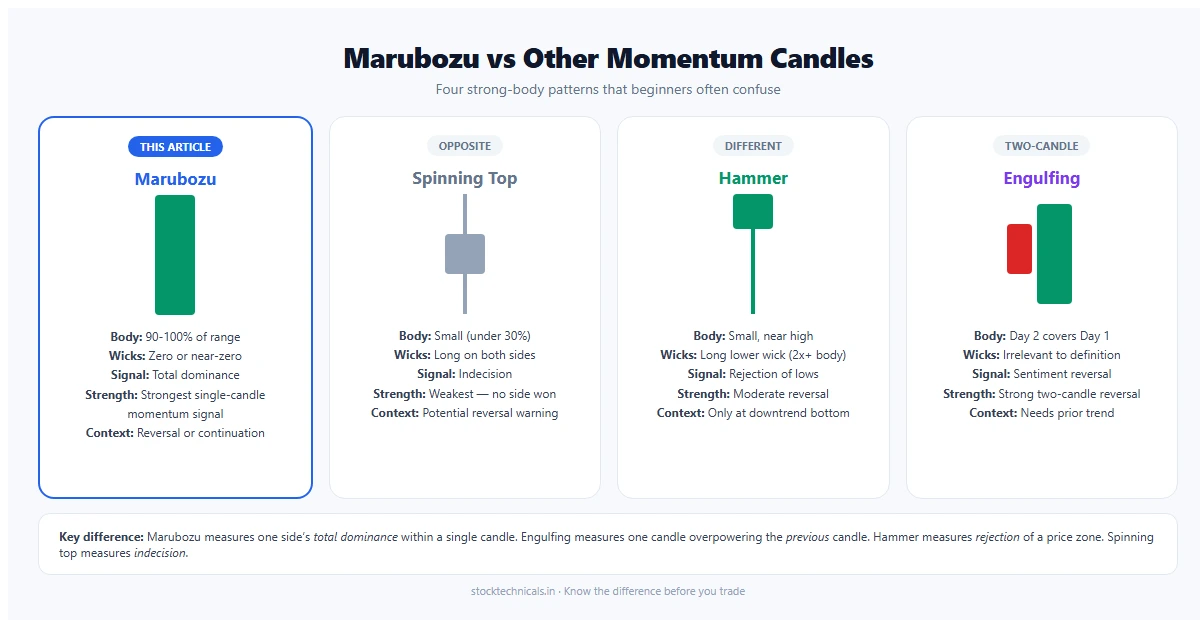
A Long Body candle has body 60-89% of range — strong but not marubozu. A Long-Legged Doji has tiny body and long wicks on both sides — the opposite of marubozu. A Bullish Engulfing may contain a marubozu on Day 2 — the two patterns can overlap.
Interactive Tool
Marubozu Checker
Enter Open, High, Low, Close to check if your candle qualifies as a marubozu
Q1: What defines a marubozu candle?
Q2: In a bullish marubozu, what is true?
Q3: What is an opening marubozu?
Q4: A bearish marubozu with 1.95x the 20-day average volume suggests:
Q5: A candle has O=500, H=500, L=485, C=486.50. Body-to-range ratio is 90%. Is this a marubozu?
Educational only. Not investment advice. Not SEBI registered. Past patterns do not guarantee future results. Always define stop losses before trading.
The Bottom Line About Marubozu
Marubozu is the candlestick that most traders misinterpret. It is NOT a reversal signal by default — it is a momentum continuation signal 9 times out of 10. The 10% of cases where it signals reversal require strict validation: prior opposite trend, pattern at 20-day extreme, and post-pattern follow-through.
Our NSE audit confirms this: 422 continuations pass the 4-criterion test, only 47 reversals. Trade the math, not the mythology. In uptrends, treat bullish marubozu as “add to longs.” In downtrends, treat bearish marubozu as “stay short.” Only at trend extremes with proper validation should you treat bearish marubozu as a reversal.
SEBI data shows 91% of individual F&O traders lose money. A large part of that loss comes from misreading continuation signals as reversals — fighting trends instead of riding them. The marubozu is your reminder that momentum usually continues.
Frequently Asked Questions
| Marubozu type | Body colour | Wicks | Signal |
|---|---|---|---|
| Bullish Marubozu | Green | None | Strong buying — continuation |
| Bearish Marubozu | Red | None | Strong selling — continuation |
| Opening Marubozu (Bull) | Green | Tiny upper wick only | Bull strength from open |
| Closing Marubozu (Bear) | Red | Tiny lower wick only | Bear strength into close |
Is the Marubozu a reversal or continuation pattern?
Primarily CONTINUATION. In our NSE audit, 422 marubozu continuations pass the 4-criterion test vs only 47 reversals — roughly 9 to 1 ratio. Only at trend extremes with prior opposing trend and pattern at 20-day high/low does marubozu signal reversal.
What defines a valid Marubozu?
The body (open-to-close range) must cover at least 90 percent of the total candle range (high-to-low). Anything less is a long-body candle, not a true marubozu. Full Marubozu has 100 percent body (no wicks at all).
What are the three types of Marubozu?
Full Marubozu (no wicks), Opening Marubozu (no wick on open side, tiny wick on close side), and Closing Marubozu (no wick on close side). Closing Marubozu is the strongest continuation signal because the session ENDED on the extreme.
How do I size positions on a Marubozu signal?
For continuation in existing trend: add to your position in the trend direction with tight stop at the pattern extreme. For rare reversal setups: enter a new position with stop above pattern high (bearish reversal) or below pattern low (bullish reversal). Size based on volatility and prior trend strength.
Can a weekly Marubozu be more powerful than daily?
Yes. Weekly marubozu is very rare but represents a full week of one-sided dominance. When it happens at a key weekly SMA or index level, it can mark multi-month trend confirmation. Weekly marubozu is the highest-weight candle signal in technical analysis.
What role does volume play in Marubozu confirmation?
Volume above 1.5x the 20-day trailing average confirms institutional commitment. Low-volume marubozu can be algorithmic gaps or thin-market anomalies — less reliable. For F&O expiry day marubozu (Tuesday per SEBI September 1, 2025 rule), volume is typically elevated from position unwinding.
Why do most traders misread Marubozu as a reversal?
Common candlestick education incorrectly emphasizes reversal patterns. Marubozu is a momentum signal — it confirms the trend in progress. Only at trend exhaustion (prior 5 percent plus rally for bearish, prior 5 percent plus decline for bullish) does marubozu become a reversal candidate. Our audit data shows 9 in 10 valid marubozu patterns are continuations.
Continue Learning
For reversal patterns:Engulfing Patterns,Morning Star / Evening Star,Shooting Star vs Inverted Hammer.
For indecision patterns:Spinning Top and High Wave — the opposite of Marubozu.
For trend confirmation:Moving Averages for Trend Confirmation.
For volume analysis:Volume in Trading.
Marubozu is primarily a continuation signal, not reversal. Misreading these patterns is one of the most common sources of losing trades. Markets are unpredictable, capital is finite, and no pattern guarantees profit. Past performance does not predict future results. Always define your stop loss before entering and never risk more than you can afford to lose.