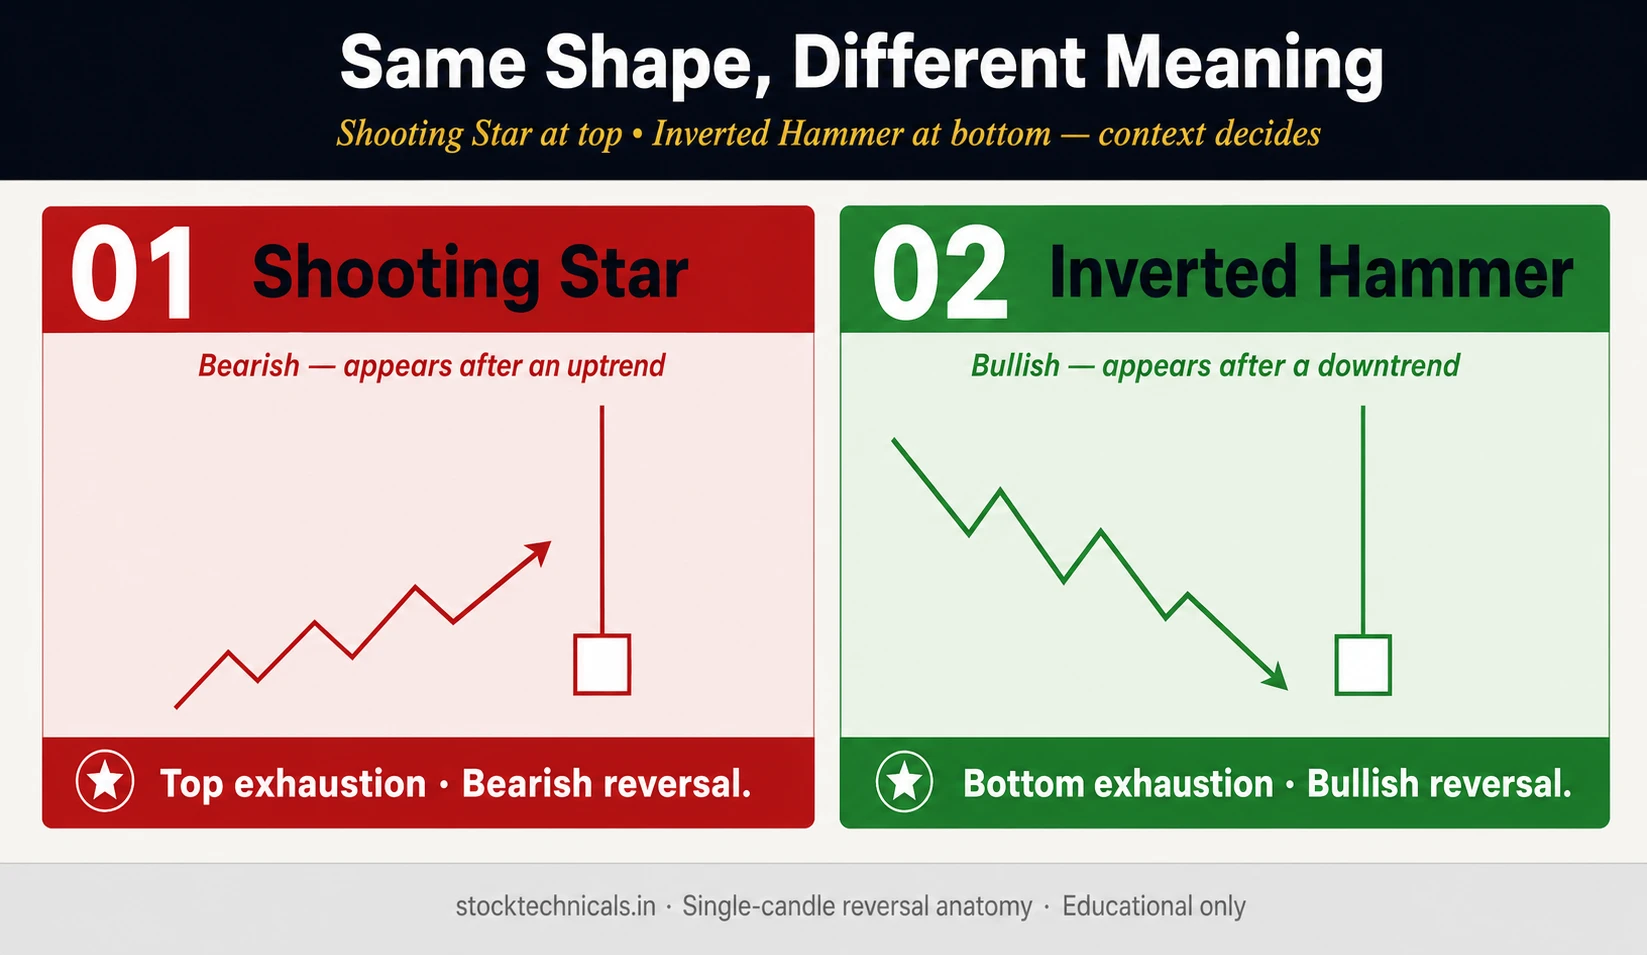
The shooting star and inverted hammer are arguably the most fascinating candlesticks in technical analysis — they have theexact same shape but signalopposite directions based entirely on where they form. At the top of an uptrend, this candle is a shooting star (bearish reversal). At the bottom of a downtrend, the same candle becomes an inverted hammer (bullish reversal).
In our NSE audit, the shooting star at59% reversal success (rank 40/103) and the inverted hammer at65% success. Both are below the 66% “investment grade” threshold, but still useful when combined with proper validation. Our NSE audit found only8 shooting stars pass the 4-criterion test across all 282 stocks — making it genuinely rare. Inverted hammers are more common (305 pass the audit).
Key Takeaways
- Shooting star and inverted hammer are the SAME candle shape. Location determines the signal direction.
- Upper wick must be at least 2x the body length. Lower wick must be minimal (or zero).
- our audit: shooting star 59% success, inverted hammer 65% — below investment grade but useful with confirmation.
- Only 8 shooting stars passed our 4-criterion NSE audit across 282 stocks over 5 years. Inverted hammer is more common (305).
- Trend prerequisite is CRITICAL: same candle in a sideways market or continuation context is NOT a reversal signal.
Anatomy: Same Shape, Different Meaning
Both patterns share three geometric requirements:
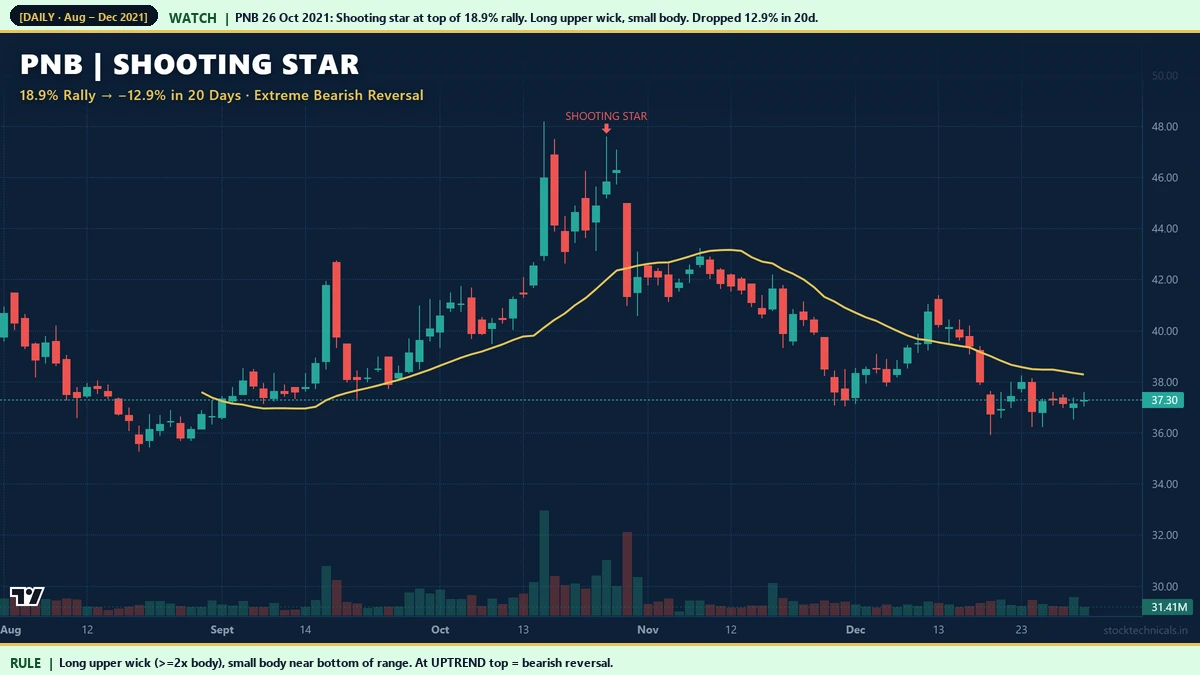
A textbook example: Wipro (NSE: WIPRO) printed a shooting star on October 14, 2021, marking the IT sector’s cyclical top before a 7% decline over the following weeks.
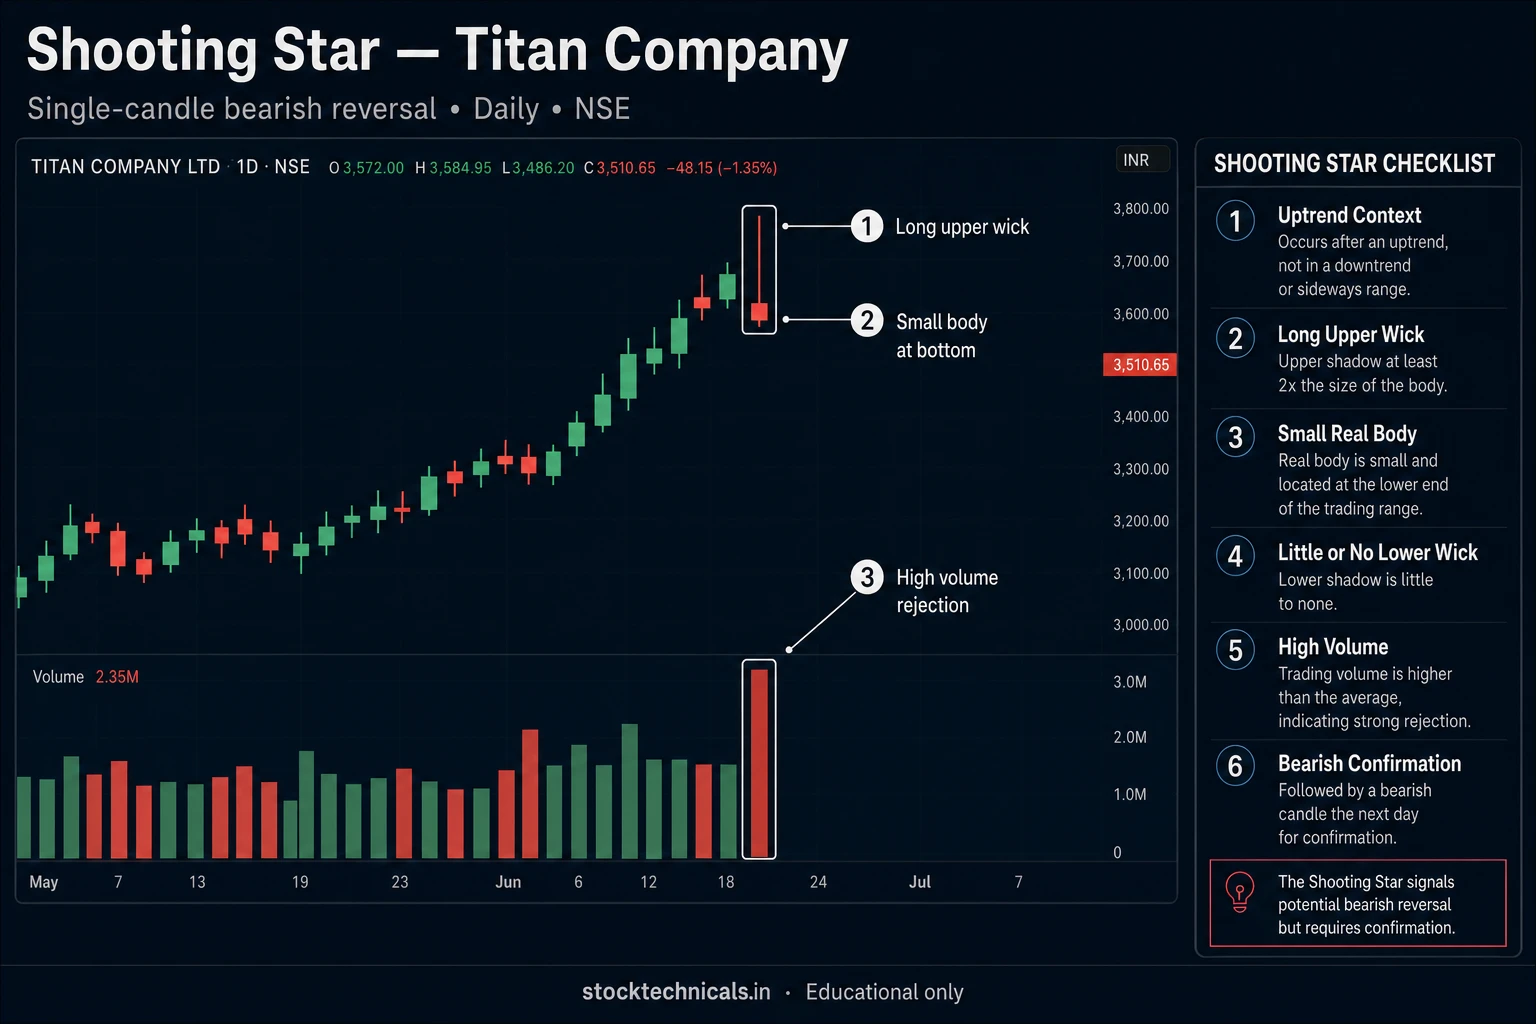
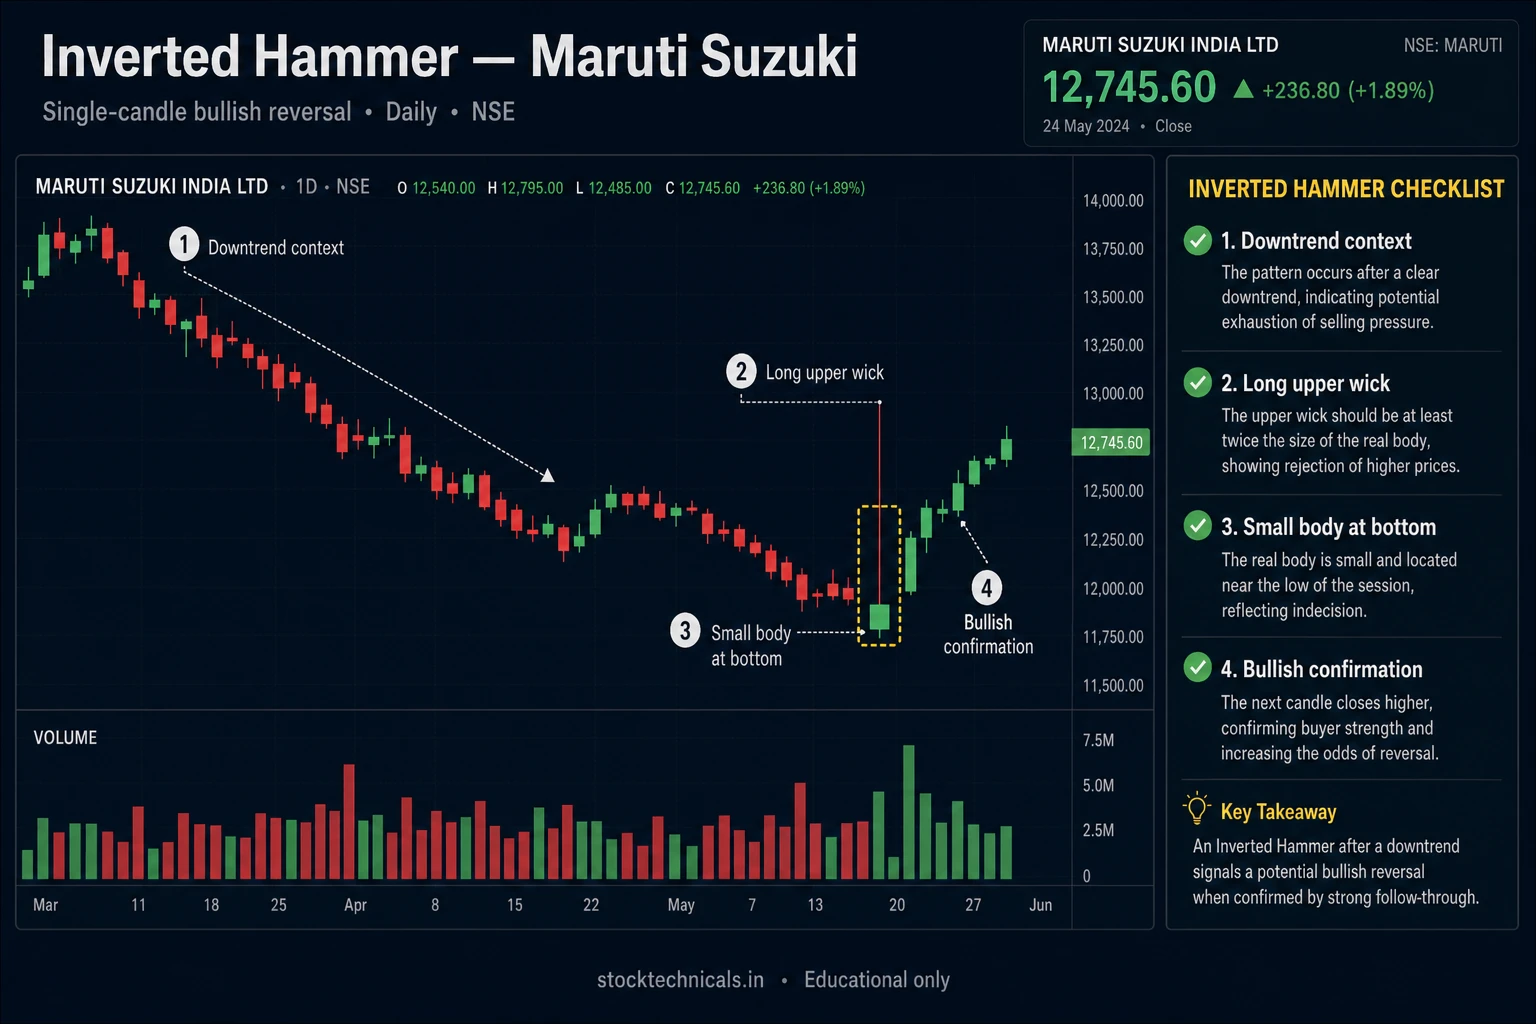
Requirement 1: Upper wick ≥ 2x body length. The long upper wick shows that buyers pushed price higher during the session but could not hold those levels. The market rejected the higher prices by the close.
Requirement 2: Small real body. The body (open-to-close range) should be less than 30% of the total candle range. Colour of the body is irrelevant — though red is slightly more bearish for shooting star and green slightly more bullish for inverted hammer.
Requirement 3: Tiny or absent lower wick. The lower wick should be less than 10% of the total range. If there is a significant lower wick, you have a different pattern (spinning top, long-legged doji).
Verified Shooting Star Examples
Verified Inverted Hammer Examples
CAMS on November 2, 2023 showed a textbook inverted hammer after a 14.6% decline. +23.4% rally in 20 sessions. Fintech sector was recovering after broader IT correction.
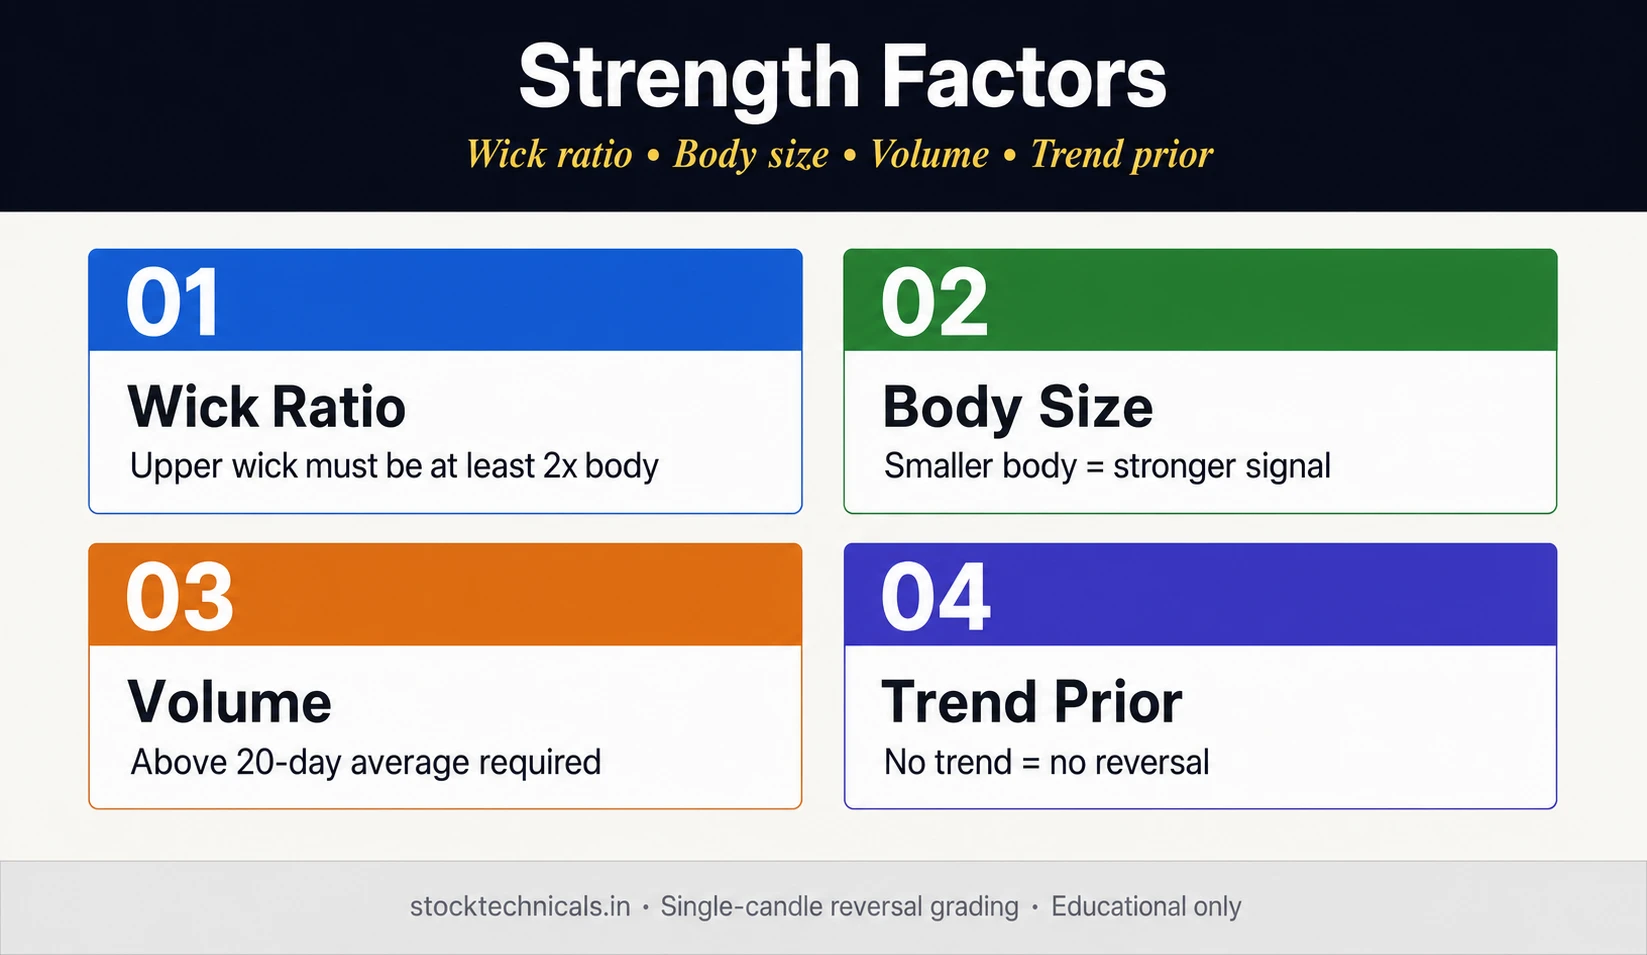
Pattern Strength Factors
Upper Wick Size
The ratio of upper wick to body is the single most important factor. Minimum 2x is required. Above 2.5x is ideal. Above 3x is extreme — showing major rejection at higher levels.
Volume on the Pattern Day
Volume on the shooting star / inverted hammer day should exceed 1.5x the 20-day trailing average (excluding the pattern day). High volume on rejection adds conviction — institutions are either distributing (shooting star) or accumulating (inverted hammer).
Prior Trend Strength
Stronger prior trends produce stronger reversals. TECHM’s 16.6% prior rally led to a 21.6% decline. NTPC’s 8.4% rally led to only 11.5% decline. The magnitude of reversal correlates with the magnitude of prior trend.
Support/Resistance Confluence
A shooting star at a known resistance level is much stronger than one in open space. An inverted hammer at known support is similarly stronger. UseS/R levels to filter signals.
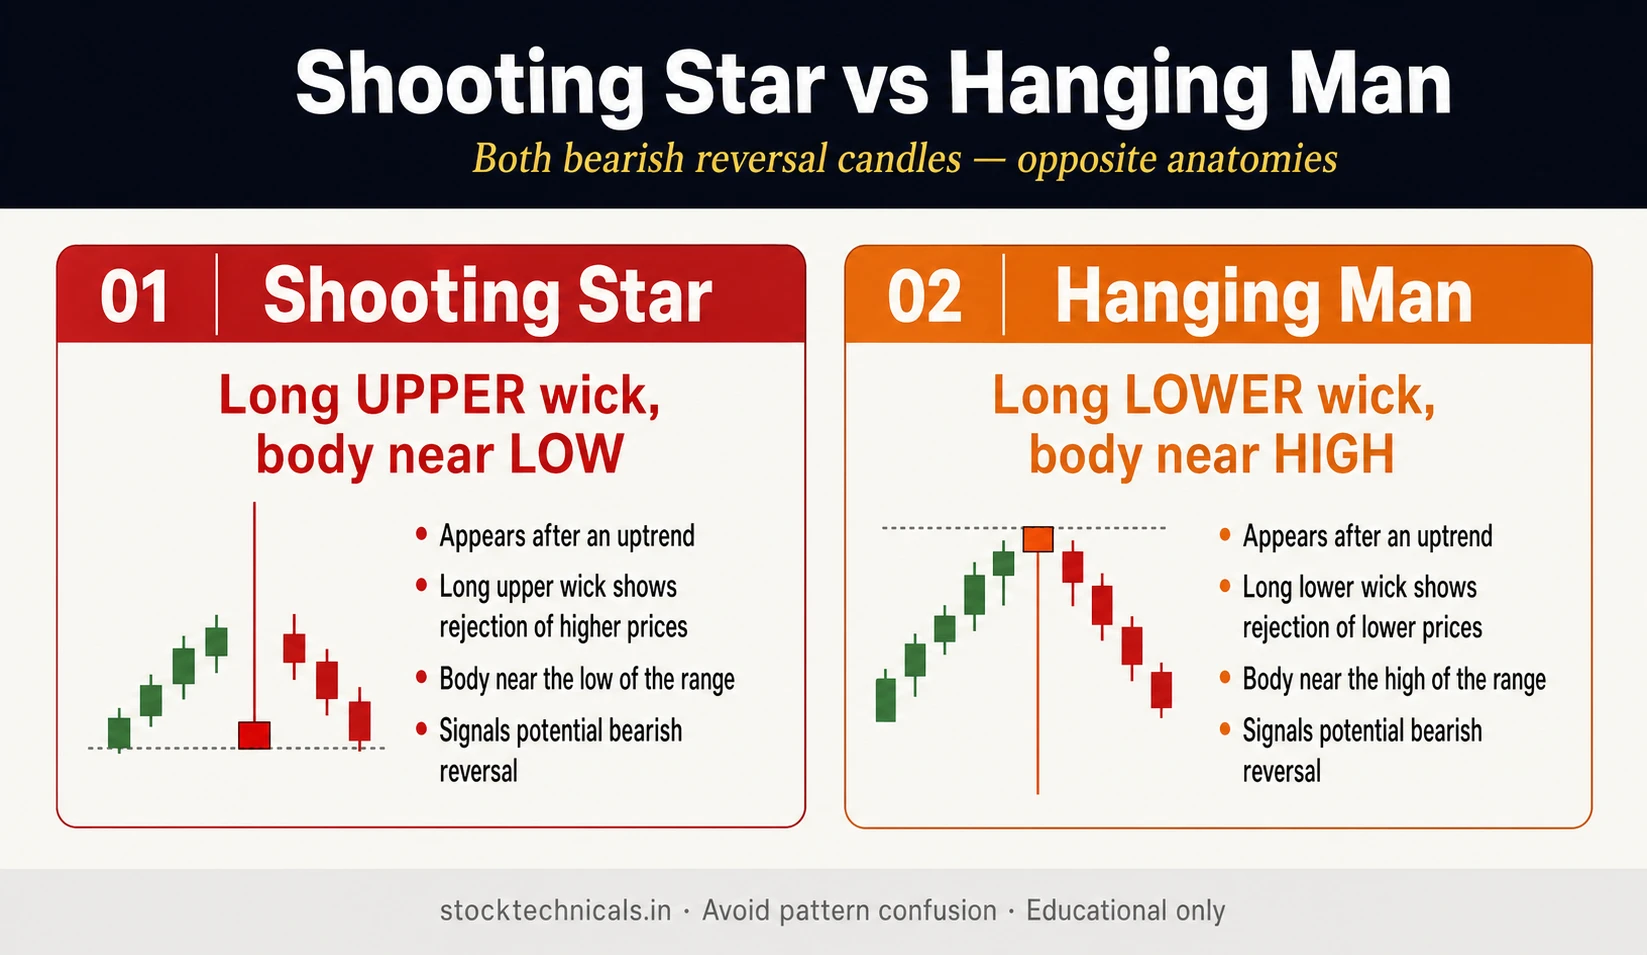
Shooting Star vs Hanging Man: Do Not Confuse
The shooting star has a LONG UPPER WICK (body near bottom of range). The hanging man has a LONG LOWER WICK (body near top of range). Both appear at uptrend tops and both are bearish. But they are different patterns with different geometries. Reading charts requires distinguishing these visually — a common beginner confusion.
Timeframe Considerations
Daily (Swing Trader Sweet Spot)
All examples use daily charts. Daily is the standard for our audit shows statistics. Expected hold period 5-20 trading days for the reversal to play out.
Weekly (Most Powerful)
Weekly shooting stars and inverted hammers are rare but carry significant weight. A weekly pattern represents a full week of market rejection — far more meaningful than one day. Combined with weekly 10-week / 40-week SMA confluence, these can mark multi-month trend changes.
Intraday F&O Application
On 15-minute charts, shooting stars at VWAP or at the day’s high are a common short setup. For NSE F&O expiry day (Tuesday per SEBI rule change September 1, 2025), shooting stars in the first hour can trigger intraday position unwinding that amplifies the reversal.
Complete Trading Plan
Entry (Shooting Star — Short)
Enter short on next-day open if the open is below the shooting star close. Conservative: wait for next-day close below shooting star close. Stop loss above the shooting star’s high (the wick tip).
Entry (Inverted Hammer — Long)
Enter long on next-day open if the open is above the inverted hammer close. Conservative: wait for next-day close above inverted hammer high. Stop loss below the inverted hammer’s low.
Position Sizing by Upper Wick Ratio
Full size (1% risk): Upper wick >2.5x body + prior trend >10% + volume >1.5x + at S/R.
Half size (0.5% risk): Upper wick 2-2.5x body + weaker trend + average volume.
Skip: Upper wick <2x body, or no clear prior trend, or below-average volume.
Common Mistakes
Mistake: Calling Any Long-Wick Candle a Shooting Star
A candle with a long upper wick AND long lower wick is a spinning top or long-legged doji, not a shooting star. Shooting star requires tiny lower wick. Similarly, inverted hammer requires tiny lower wick — not long lower wick.
Mistake: Ignoring Trend Context
The biggest error: trading this shape without checking location. In a sideways market, this candle is just intraday volatility — not a reversal signal. The trend prerequisite is non-negotiable.
Mistake: Immediate Entry Without Confirmation
our audit shows 59-65% success means 35-41% of valid setups still fail. Wait for next-day confirmation (open in expected direction) before entering.
Interactive Tool
Shooting Star / Inverted Hammer Identifier
Enter your candle details to check if it qualifies as a valid shooting star or inverted hammer
Q1: A candle has a long upper wick (85%), tiny body (5%), and almost no lower wick. It appears at the TOP of a 10-day rally. What is this pattern?
Q2: The SAME candle shape (long upper wick, small body at bottom) appears at the BOTTOM of a downtrend. Now what is it?
Q3: NTPC prints a shooting star with 1.70x volume after a +9.3% rally. What makes this high-probability?
Q4: Tech Mahindra prints a textbook shooting star (94% upper wick, 2.65x volume) but the stock rallied +3.58% in the next 5 days. Why?
Q5: What is the KEY difference between a Shooting Star and a Hanging Man?
Educational tool only. Not investment advice. Not SEBI registered. Always verify patterns against your own analysis and risk management rules before trading. Past patterns do not guarantee future results.
The Bottom Line About Shooting Star and Inverted Hammer
These are the most visually striking candlestick patterns — long wicks telling a clear story of rejection. But at 59-65% success rates, they are BELOW our audit shows investment-grade threshold. They work, but less reliably than morning/evening stars (78%/72%) or engulfings (63%).
The pattern alone is never enough. Always combine with (1) prior trend of at least 5-10 days, (2) location at a known support/resistance level, (3) volume confirmation above 1.5x the 20-day average, and (4) next-day confirmation of direction. Size positions smaller than you would for morning/evening star setups. Keep stops tight at the wick extreme.
With 91% of individual F&O traders losing money per SEBI data, the edge does not come from picking patterns — it comes from DISQUALIFYING bad setups. Most long-upper-wick candles are not shooting stars. Most long-upper-wick candles at bottoms are not inverted hammers either. Strict filtering is the edge.
Frequently Asked Questions
| Pattern | Trend before | Wick position | Signal direction |
|---|---|---|---|
| Shooting Star | Uptrend | Long upper wick, small body at bottom | Bearish reversal |
| Inverted Hammer | Downtrend | Long upper wick, small body at bottom | Bullish reversal |
What is the difference between a shooting star and an inverted hammer?
They have the exact same candle shape — long upper wick, small body, tiny lower wick. The difference is location. At the top of an UPTREND, this candle is a shooting star (bearish reversal). At the bottom of a DOWNTREND, it is an inverted hammer (bullish reversal). Location determines the signal.
How long should the upper wick be?
Minimum 2x the body length. Above 2.5x is ideal — showing major rejection of higher prices. Above 3x is extreme but uncommon. If the upper wick is less than 2x the body, the pattern is not qualifying.
What is the actual success rate of these patterns?
Both are below the 66% investment-grade threshold. They are useful patterns but require strict confirmation — prior trend, location, volume, and next-day follow-through.
Why are shooting stars so rare in NSE data?
Our audit of 282 NSE stocks over 5 years found only 8 shooting stars pass the 4-criterion reversal test — requiring prior uptrend of at least 5%, pattern at 20-day high, no new highs for 20 days after, and 20-day close at least 3% lower. Inverted hammers are much more common (305 pass) because downtrend bottoms are more numerous in Indian data than clear uptrend tops.
Can these patterns work on intraday charts?
Yes, especially 15-minute and 1-hour charts. Shooting stars at VWAP or at the day high are a common intraday short setup. For F&O expiry days (Tuesday per SEBI rule of September 1, 2025), these patterns in the first hour can trigger position unwinding that amplifies the reversal.
How is a shooting star different from a hanging man?
Shooting star has long UPPER wick (body near bottom of range). Hanging man has long LOWER wick (body near top of range). Both appear at uptrend tops and both are bearish — but the geometry is different. Do not confuse them.
Where should I place my stop loss?
For shooting star short: stop above the wick tip (the pattern high). For inverted hammer long: stop below the pattern low. If price breaches these levels, the rejection has failed and the pattern is invalid.
Continue Learning
For three-candle reversals:Morning Star and Evening Star — 78% and 72% success, higher reliability than single-candle patterns.
For two-candle reversals:Engulfing Patterns — 63% success, similar reliability to inverted hammer.
For hammer family:Hammer and Hanging Man — long LOWER wick equivalents of these patterns.
For support/resistance:Support and Resistance — the framework for identifying where these patterns are most reliable.
Shooting star 59% and inverted hammer 65% mean 35-41% of valid setups fail. Markets are unpredictable, capital is finite, and no pattern guarantees profit. Past performance does not predict future results. Always define your stop loss before entering, never risk more than you can afford to lose, and verify every setup against your own analysis.