Two candles. Identical shape. Opposite signals. That is the trap waiting for every beginner learning candlestick patterns. The HAMMER and the HANGING MAN both have a small body at the top of the range, a long lower wick that stretches two or more times the body length, and almost no upper wick. Side by side, you cannot tell them apart. Put them on a chart and everything changes.
Quick Answer: The hammer and the hanging man are the same candle shape — small body at the top of the range, long lower wick at least twice the body length, little to no upper wick — but the signal flips based on location. A hammer after a decline is bullish; the same shape after a rally becomes a hanging man and turns bearish. On NSE charts of Reliance, Tata Steel, or the Nifty 50, confirmation on the next candle with matching volume is what separates a tradeable reversal from a false alarm.
Published January 21, 2026 · Last refreshed April 27, 2026. Prices and data are compiled with reasonable care — always confirm against your broker before trading.
A HAMMER (small body + long lower wick after a decline) is a bullish reversal signal. The same shape after a rally becomes a HANGING MAN, and the signal flips to bearish. Location — not shape — is the difference. The long lower wick means the same thing in both cases: sellers tried to push lower during the session but buyers forced the price back up before the close. What changes is whether that recovery is reassuring (at a bottom) or alarming (at a top).
This article walks through the hammer and hanging man as a matched pair, with seven NSE examples. Every price is cross-checked against NSE (daily OHLC) data to two decimal places. Every chart shows 80-100 days of context so the trend environment is obvious. The goal: teach beginners to recognise the shape, then teach them why the same shape means two different things depending on what came before.
Key Takeaways
- HAMMER and HANGING MAN have IDENTICAL shape (small body + long lower wick + tiny upper wick)
- HAMMER only appears after a DECLINE — signals bullish reversal at a bottom
- HANGING MAN only appears after a RALLY — signals bearish reversal at a top
- LOCATION is the entire difference — shape alone tells you nothing without trend context
- BODY COLOR is secondary — a RED hammer is still valid, a GREEN hanging man is still valid
- Lower wick must be at least 2x the body size (often 3-5x)
- Both patterns REQUIRE next-candle confirmation before entering a trade
- Volume above 1.5x 20-day average strengthens the signal significantly
- Stop-loss goes at the FAR EXTREME of the pattern — below hammer low, above hanging-man high

Why the Same Shape Means Two Different Things
The long lower wick is always the key. It says: during today’s session, sellers pushed the price well below the open. Then buyers stepped in and pushed it back up. The session ended near where it started. Whether that recovery is bullish or bearish depends entirely on what happened BEFORE today.
In a downtrend, a long lower wick is the first sign that buyers are fighting back. The decline has been relentless — sellers have been winning every session. Today they tried again and almost succeeded, but at the last moment buyers appeared in volume and took back the gains. This is the moment sentiment shifts. The chart has said “down” for days. Today it says “maybe not.”
In an uptrend, the same long lower wick is ominous. Rallies that are healthy do not need intraday rescue operations. When a stock in a clean uptrend suddenly needs buyers to defend the floor, something has changed. The wick is the footprint of a crack in demand. The buyers won today, but they had to fight for the win. That is new. In a trend where buyers had been dominant without effort, any sign of effort is a warning.
The hammer says: sellers are losing. The hanging man says: buyers are losing. The shape is the same because the candle structure is the same. The interpretation flips because the context flips.
Hammer: The Bullish Reversal
The HAMMER is one of the most recognisable candlestick patterns in technical analysis. It forms at the end of a downtrend and signals that sellers pushed prices to new lows during the session but buyers stepped in aggressively and recovered most of the loss before the close. The recovery is the key — it is the first visible sign that demand has returned.
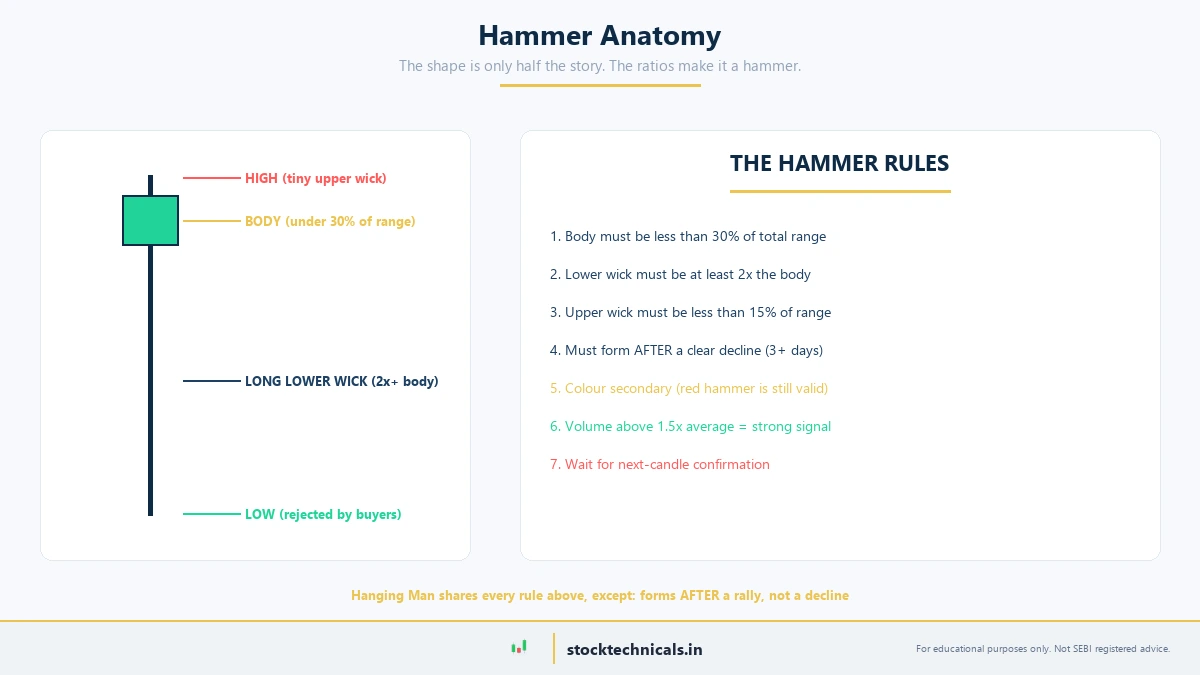
How to identify a Hammer
- Small body at the TOP of the candle range (body under 30% of range)
- Long lower wick at least 2x the body size (often 3-5x)
- Almost no upper wick (under 15% of range)
- Forms after a clear decline (3+ red days or a multi-week drop)
- Color is secondary — red hammers are still valid
- Volume above 1.5x the 20-day average = strong confirmation
Example 1 (Recent Hero): Bajaj Finserv on April 2, 2026. After a 5-day decline of 3.37 percent from Rs 1,696 to Rs 1,637, Bajaj Finserv opened at Rs 1,635.00. Sellers pushed it down to Rs 1,597.00 during the session — an intraday drop of 2.32 percent from the open. Buyers stepped in and drove the price all the way back to Close Rs 1,640.70. The body was Rs 5.70 (just 11.5 percent of the Rs 49.50 range). Upper wick 11.7 percent, lower wick 76.8 percent. Volume was 1.29x the 20-day average. Green body.
What happened next: Bajaj Finserv rallied to Close Rs 1,809.20 over the next five sessions — a +10.27 percent move. The hammer low at Rs 1,597 was never retested. Textbook reversal off a support test.
Example 2 (Strong Follow-Through): State Bank of India on February 2, 2026. After a 5-day decline of 3.32 percent from Rs 1,053 to Rs 1,018, SBI (NSE: SBIN) printed another textbook hammer. Open Rs 1,019.90, High Rs 1,031.30, Low Rs 990.00, Close Rs 1,028.70. Body Rs 8.80 (21.3% of range). Lower wick Rs 29.90 (72.4%). Upper wick Rs 2.60 (6.3%). GREEN body. Volume 1.48x the 20-day average.
What happened next: SBI closed at Rs 1,146.00 five sessions later — a +11.40 percent rally. This is the strongest 5-day follow-through of all seven examples in this article. When a hammer appears at support with proper volume, the follow-through can be immediate and powerful.
Example 3 (Red Hammer, Election Day): HCL Technologies on June 4, 2024 — the Indian election results day. This is a special example because it shows the classic panic-capitulation-reversal pattern in a single candle, and it is a RED body hammer. Open Rs 1,325.00, High Rs 1,325.00 (equal to open — zero upper wick!), Low Rs 1,235.00, Close Rs 1,303.55. Body Rs 21.45 RED (23.8% of the Rs 90 range). Lower wick Rs 68.55 (76.2%). Election results panic pushed HCL from Rs 1,325 to Rs 1,235 intraday, but buyers recovered Rs 68.55 of that decline by the close.
What happened next: HCLTECH rallied to Close Rs 1,428.80 over the next five sessions — a +9.61 percent move. The red body was never a problem. The shape was a textbook hammer despite the red body because the rules (small body, long lower wick, tiny upper wick, downtrend context) were all satisfied. This example demolishes the myth that only green hammers are valid.
Example 4 (Ultra-Deep Wick): Divi’s Laboratories on April 2, 2026. This is the most extreme geometry in the article. Open Rs 5,851.00, High Rs 5,869.50, Low Rs 5,647.50, Close Rs 5,856.50. The body was just Rs 5.50 (2.5 percent of the Rs 222 range). Upper wick Rs 13 (5.9%). Lower wick Rs 203.50 (91.7%). Volume 1.79x. At body 2.5 percent, this is almost a dragonfly doji — it sits on the boundary between hammer and doji.
What happened next: Divis Lab closed at Rs 6,116.50 five sessions later (+4.44 percent). Modest follow-through but valid reversal. The ultra-deep lower wick shows that the rejection was violent — sellers pushed 3.5 percent below the open and buyers responded with equal force. When body percentages drop under 5 percent, the hammer starts to merge into the doji family, which makes it even more of an indecision signal. These ultra-deep wicks usually mark support levels that then hold for weeks.
Hanging Man: The Bearish Reversal
The HANGING MAN is the exact geometric twin of the hammer. Small body at the top, long lower wick, tiny upper wick. But where the hammer appears at the bottom of a downtrend and signals reversal up, the hanging man appears at the TOP of an uptrend and signals reversal DOWN. The name is literal: it looks like a man hanging from the body with his legs (the wick) dangling below.
How to identify a Hanging Man
- Small body at the TOP of the candle range (body under 30% of range)
- Long lower wick at least 2x the body size
- Almost no upper wick
- Forms after a clear uptrend (the location is the differentiator from hammer)
- Color secondary — but red body is slightly more bearish than green
- REQUIRES next-day red confirmation — weakest of the top-reversal patterns alone
Example 5 (Strong Drop): Dr Reddy’s Laboratories on July 30, 2025. After a 5-day rise of 4.2 percent into new highs, DRL printed a textbook hanging man. Open Rs 1,298.10, High Rs 1,298.10 (equal to open — zero upper wick), Low Rs 1,277.70, Close Rs 1,292.10. Body Rs 6.00 RED (29.4% of range). Lower wick Rs 14.40 (70.6%). Volume was 0.98x the 20-day average — slightly below average, technically a weakness.
What happened next: Dr Reddy’s collapsed to Close Rs 1,196.70 over the next five sessions — a −7.38 percent drop. This is the biggest 5-day drop of all three hanging-man examples in this article. The interesting lesson: volume was weak (under 1.0x) yet the signal still worked. This is unusual. The pattern worked here because the uptrend context was clean and the geometry was textbook (Open = High is the strongest hanging-man variant). Most hanging men on light volume fail. This one did not. Use it as a reminder that rules are probabilities, not certainties.
Example 6 (Recent Red Body): Hero MotoCorp on February 9, 2026. After a 5-day rise of 2.32 percent, Hero printed a hanging man with a red body. Open Rs 5,800.00, High Rs 5,816.00, Low Rs 5,667.00, Close Rs 5,756.50. Body Rs 43.50 RED (29.2% of the Rs 149 range). Upper wick Rs 16 (10.7%). Lower wick Rs 89.50 (60.1%). Volume 1.19x. The red body is slightly more bearish than a green hanging man because the session already closed below the open — sellers won the day intraday.
What happened next: Hero closed at Rs 5,492.00 five sessions later — a −4.59 percent decline. The pattern worked cleanly. The red body + 60 percent lower wick + rally context was a standard bearish setup. Nothing unusual, but a useful reference for what a typical red hanging man looks like on a daily chart.
Example 7 (Rally Peak, Open Equals High): UltraTech Cement on July 30, 2024. After a 5-day rise of 2.84 percent from Rs 11,545.80 to Rs 11,873.80, UltraTech printed a textbook hanging man at a rally top. Open Rs 11,858.00, High Rs 11,858.00 (equal to open — zero upper wick), Low Rs 11,644.50, Close Rs 11,806.45. Body Rs 51.55 RED (24.1% of range). Lower wick Rs 161.95 (75.9%). Volume 1.09x the 20-day average — near-average participation.
What happened next: UltraTech closed at Rs 11,325.30 five sessions later (−4.08 percent). The 10-day low reached Rs 10,963.10 (−7.14 percent). The rally high of Rs 11,940.00 from the prior session was never retested during the subsequent decline. The Open-equals-High variant is the strongest hanging-man geometry because there is literally zero upper wick — buyers made no attempt to push higher. When the session opens at the high, every intraday move is downward, and the only recovery comes from buyers desperately defending the floor. That is not a healthy uptrend candle — it is a warning that demand has shifted.
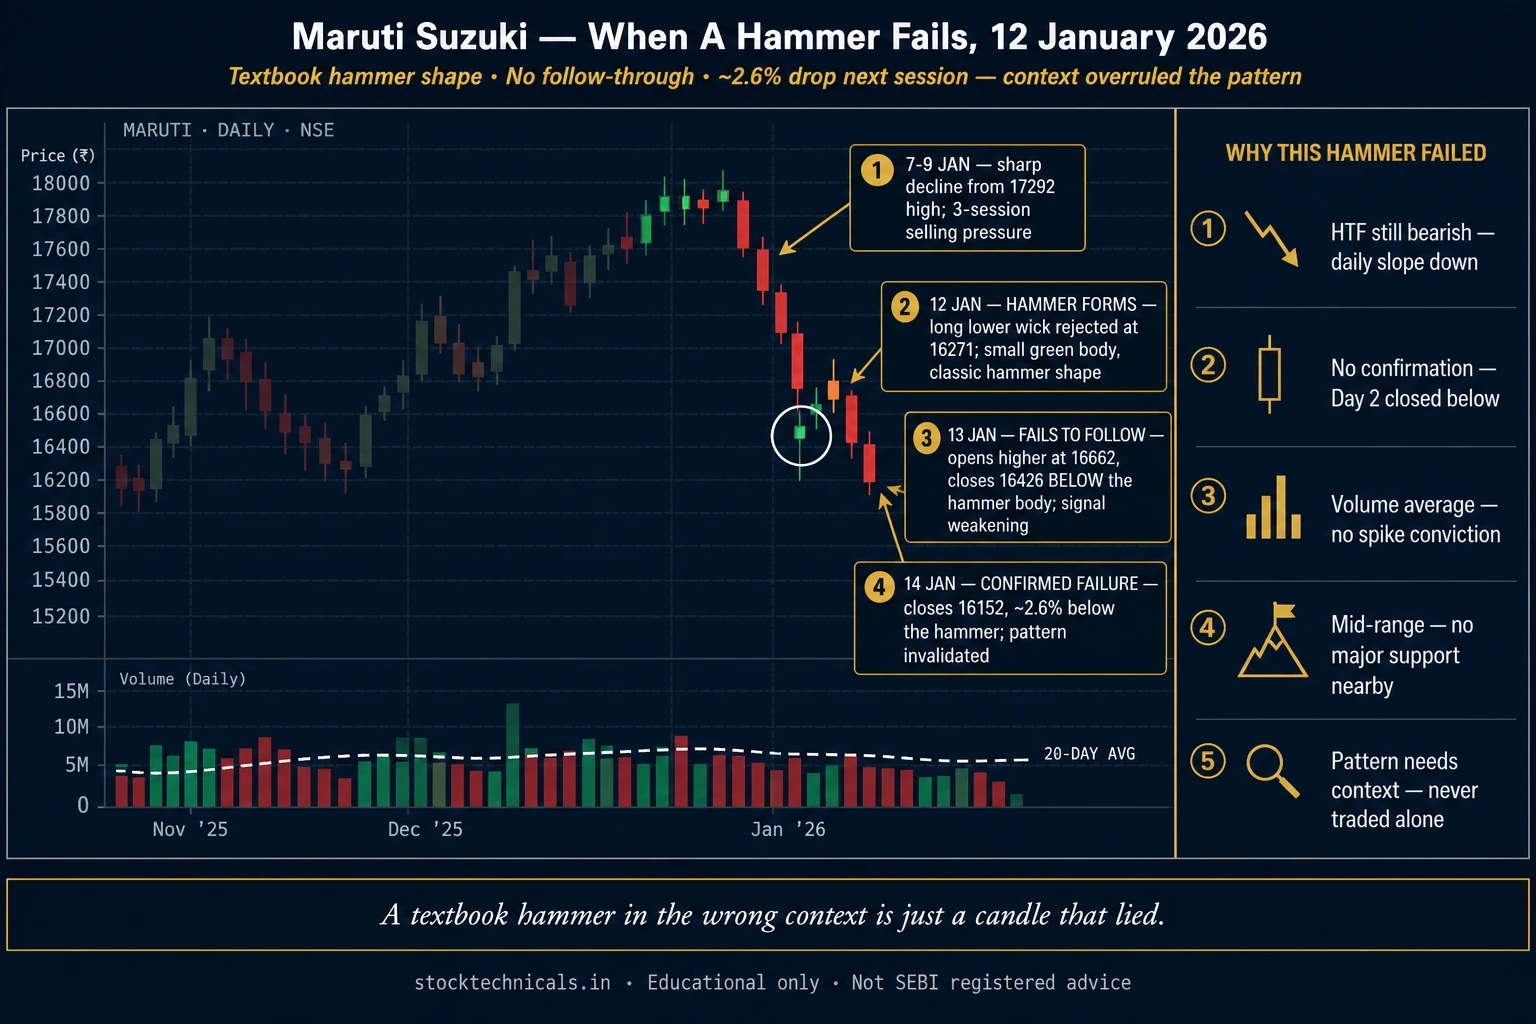
When a Hammer Fails — The Honest Example
Every article in this candlestick series includes at least one failed example to guard against selection bias. The hammer is no exception. Out of 892 hammers detected across 5 years of NSE data on 39 large-cap stocks, roughly 30 percent of textbook setups failed their reversal test. The failures usually share one trait: the broader trend was stronger than any one candle could reverse. A hammer does not turn a trend by itself — it is a signal that demand may be returning. If demand does not hold, the trend keeps going.
Example: Maruti Suzuki on 12 January 2026. After a four-session slide of 4.57 percent (Rs 17,292 on 6 Jan to Rs 16,501 on 9 Jan), Maruti printed a hammer-like candle. Open Rs 16,456, High Rs 16,615, Low Rs 16,271, Close Rs 16,582. Body Rs 126 — 36.6 percent of the Rs 344 range. Lower wick Rs 185, 53.8 percent of range. Upper wick Rs 33 (9.6 percent). The shape passed three of the four hammer checks: small body, virtually-absent upper wick, meaningful lower wick. The fourth check — lower wick at least twice the body — failed at 1.47x. Borderline geometry rather than a textbook hammer.
What happened next: Five sessions later Maruti closed Rs 15,879 — a −4.24 percent decline. The hammer low of Rs 16,271 was broken on day 2 (14 Jan low Rs 16,090). The pattern failed completely. Why? The lower-wick-to-body ratio was already a red flag at 1.47x, below the textbook 2.0x. Beyond geometry, the broader auto sector was weak; Nifty Auto had been in correction for weeks; Maruti’s own daily chart had not registered a higher-high after the early-January peak. The hammer-like candle was tempting in isolation but the strategic context was overwhelmingly against it. Lesson: enforce the 2x lower-wick rule strictly, and always check higher timeframes before trading a hammer on the daily. Geometry matters — context wins.
How to Trade the Hammer and Hanging Man
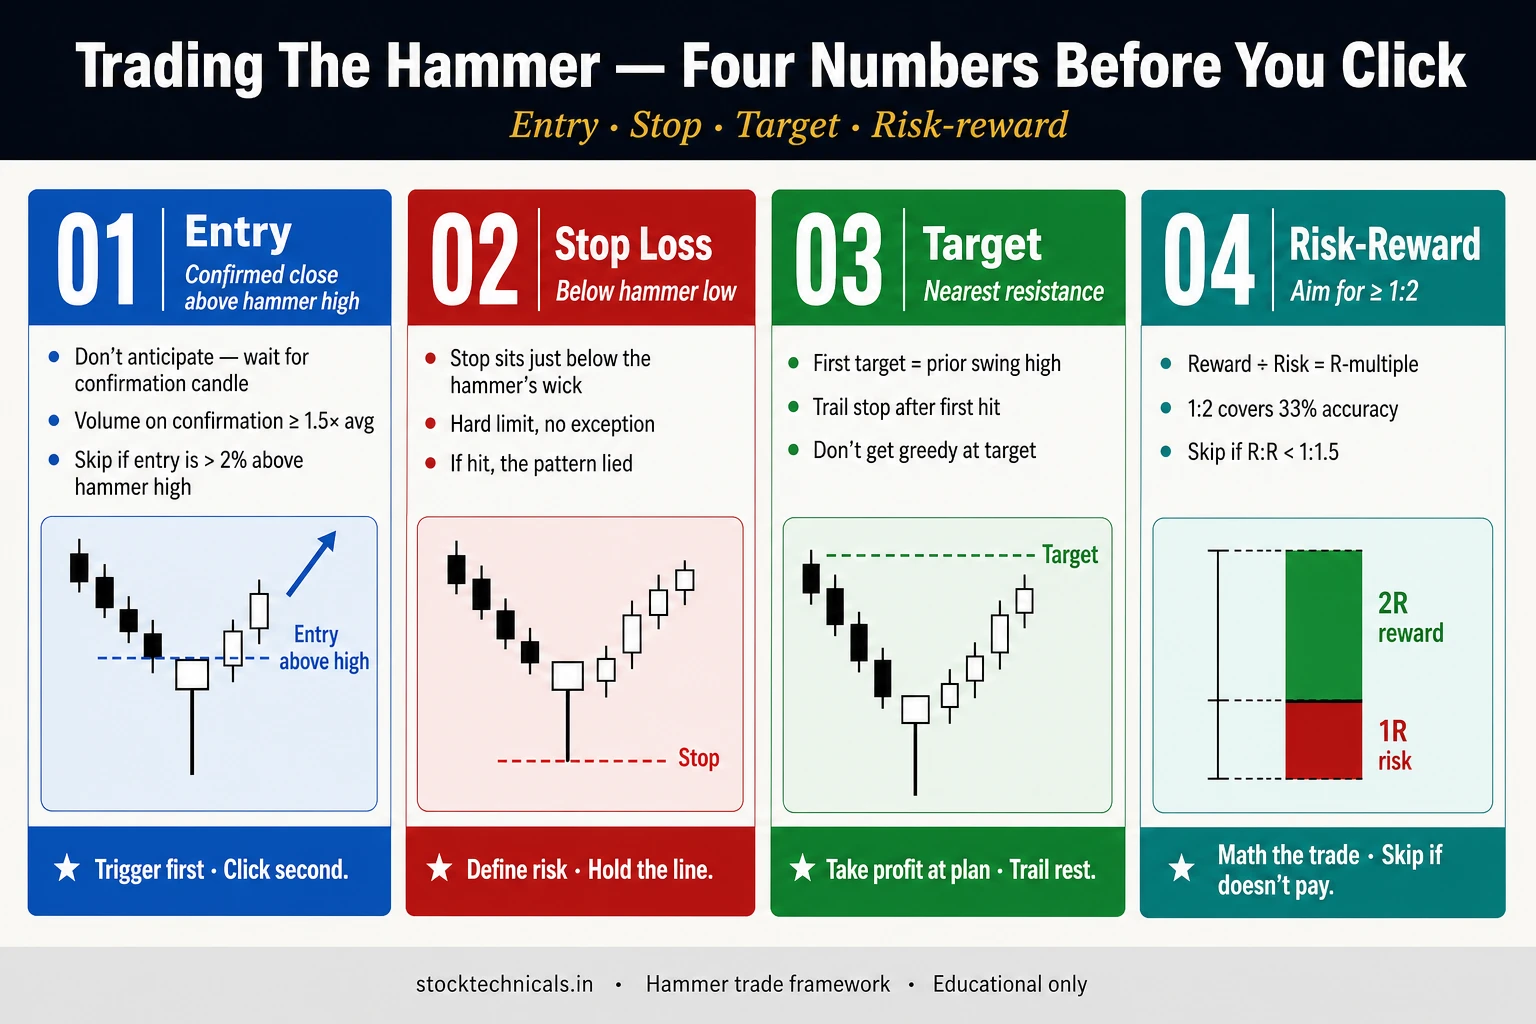
Both patterns use the same three-step protocol: wait for confirmation, enter at the next session open, place stop at the far extreme of the pattern. The difference is direction — hammer trades long, hanging man trades short (or exit long).
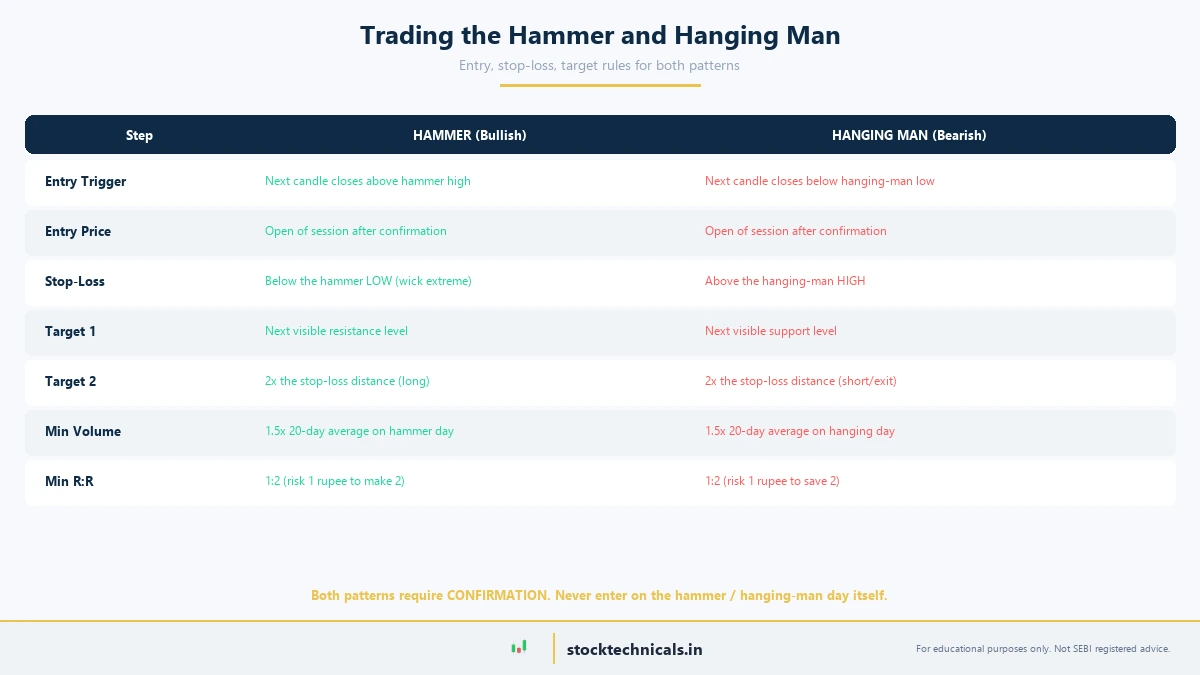
Confirmation Rule (Most Important)
Neither pattern is traded on the day it forms. The hammer day ends with indecision. The hanging man day ends with indecision. The NEXT session is the confirmation candle. For a hammer to be confirmed bullish, the next candle must CLOSE ABOVE the hammer high. For a hanging man to be confirmed bearish, the next candle must CLOSE BELOW the hanging-man body low. Without confirmation, the pattern is just indecision and no trade is valid.
Stop-Loss Placement
The stop-loss goes at the far extreme of the pattern — NOT the body edge, NOT the 20-day SMA, NOT some round number. For a hammer long entry, the stop goes below the LOW of the hammer wick. If price takes out the hammer low, the reversal thesis is dead and the trade should be exited. For a hanging man short entry, the stop goes above the HIGH of the hanging-man candle (usually the body top, since the upper wick is tiny). These are the hard invalidation lines.
Risk-Reward
Minimum acceptable risk-reward is 1:2. Calculate the distance from entry to stop (the risk) and the distance from entry to the first target (the reward). If reward is less than twice the risk, skip the trade. Hammer targets go up to the next resistance level; hanging-man targets go down to the next support level. A 5-10 percent move in the following 5-10 sessions is realistic for both patterns when they appear at clean levels with proper volume.
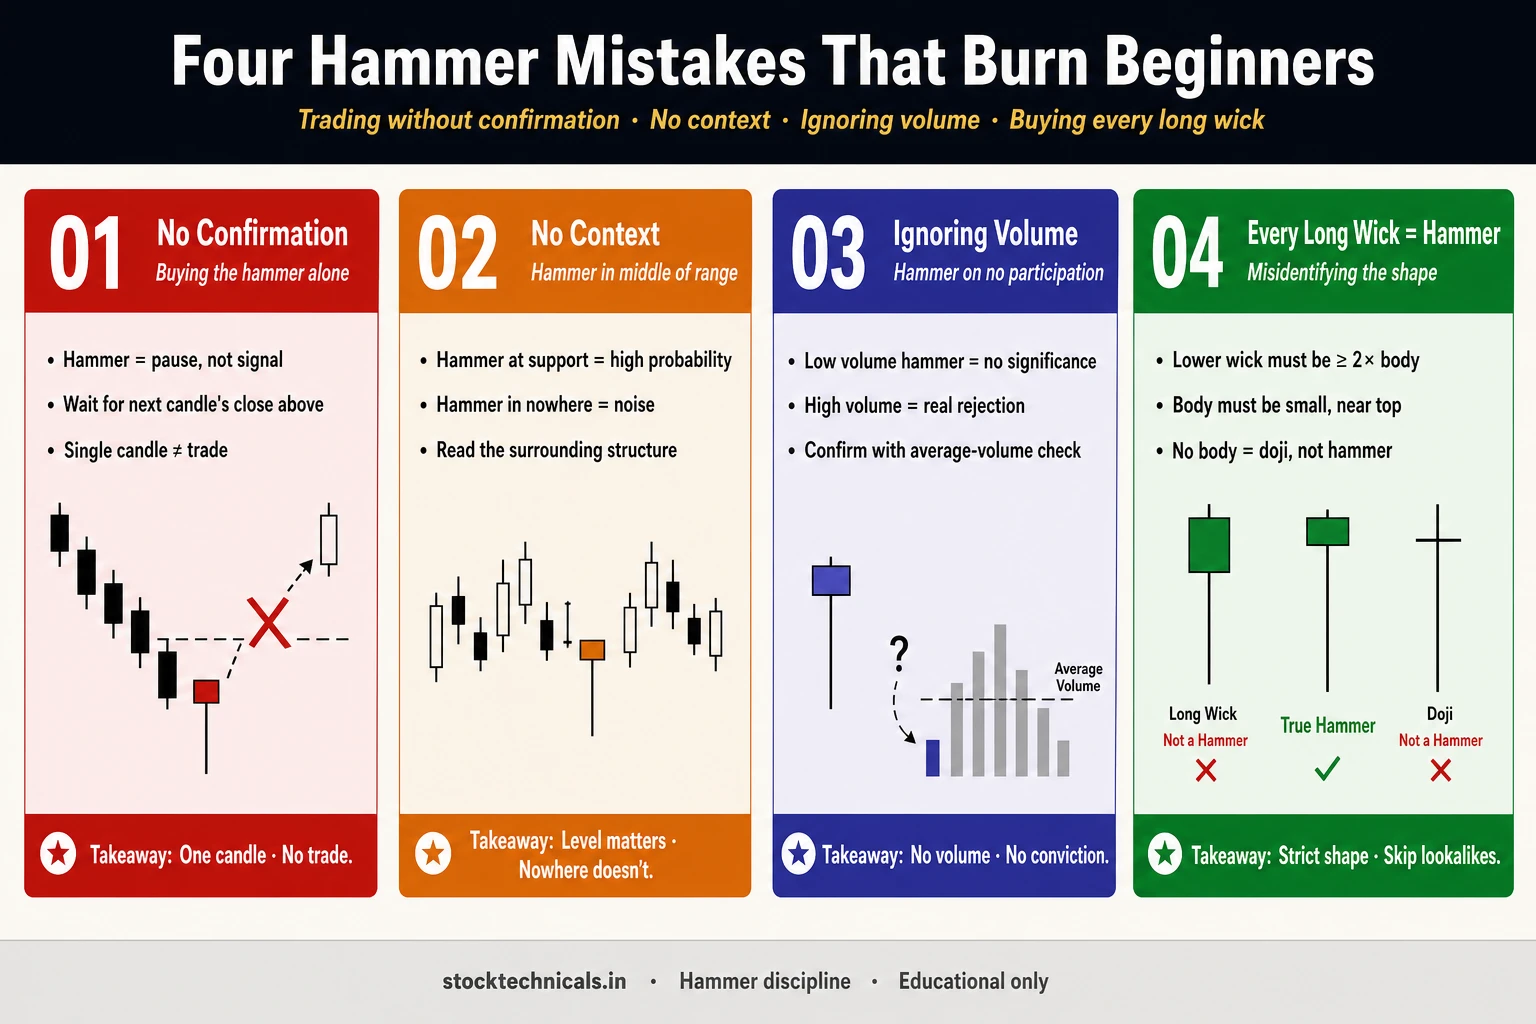
Common Mistakes
- Confusing hammers and hanging men based on body color (location matters, color does not)
- Trading the hammer or hanging man without waiting for next-candle confirmation
- Placing stop-loss above the body instead of above the entire wick
- Treating a hammer in the middle of an uptrend as a buy signal (it means nothing there)
- Treating a hanging man in the middle of a downtrend as a sell signal (same issue)
- Ignoring volume — hammer with under 0.8x volume usually fails
- Counting ANY small-body + long-wick candle as a hammer without checking the prior 5-day trend
- Dismissing red hammers as invalid (they are not — color is secondary)
Interactive Tool: Pattern Identifier
Practice identifying hammers and hanging men from real OHLC data with this interactive tool. Six NSE examples cycle through, and a 5-question quiz tests the key rules.
Interactive Tool: Hammer and Hanging Man Identifier
Same shape, opposite location — practice reading the signal from real NSE data
The Bottom Line
The hammer and hanging man are geometrically identical. Small body. Long lower wick. Tiny upper wick. What separates them is the prior trend — a hammer forms after a decline and signals reversal up, a hanging man forms after a rally and signals reversal down. Shape alone tells you nothing useful. Shape plus location tells you everything.
Both patterns require the same three things to be tradeable: proper location (downtrend for hammer, uptrend for hanging man), volume above 1.5x the 20-day average, and next-candle confirmation. Without all three, the pattern is just indecision and most signals fail. The Dr Reddy hanging man on July 30, 2025 worked despite sub-average volume — that is the exception, not the rule. Most hanging men on light volume fail.
Memorise the shape. Always check the prior 5-day trend before labeling a candle as a hammer or hanging man. Wait for confirmation. Place stops at the far extreme. If these three rules are followed, hammers and hanging men are two of the highest-probability reversal patterns in the candlestick family.
| Pattern | Trend before | Body location | Trade signal |
|---|---|---|---|
| Hammer | Downtrend | Top of candle range | Bullish reversal — buy |
| Hanging Man | Uptrend | Top of candle range | Bearish warning — exit longs |
| Inverted Hammer | Downtrend | Bottom of candle range | Bullish reversal — buy |
| Shooting Star | Uptrend | Bottom of candle range | Bearish reversal — short |
What is the difference between a hammer and a hanging man?
The shape is identical: small body at the top, long lower wick, tiny upper wick. The difference is LOCATION. A hammer appears at the bottom of a downtrend and signals a bullish reversal. A hanging man appears at the top of an uptrend and signals a bearish reversal. Without the prior trend context, you cannot tell them apart — which is why beginners often misread them. Always check the prior 5-day trend before labeling the candle.
Can a hammer be a red candle?
Yes. Color is secondary to the shape. A red hammer means the close was slightly below the open, but if the body is small and the lower wick is long, it is still a valid hammer. The HCL Technologies election-day hammer on June 4, 2024 was a RED body hammer and produced a +9.61 percent rally in the following five sessions. Traditional candlestick theory (Steve Nison) accepts both colors for hammers. Red hammers are slightly weaker than green ones because sellers technically won the session, but the long lower wick still proves the recovery attempt.
What confirms a hammer pattern?
The NEXT candle. A hammer is confirmed when the next session closes above the hammer's high. This shows that buyers held the reversal and pushed higher. Without confirmation, the hammer is just indecision and many hammers fail. Volume above 1.5x the 20-day average on the hammer day also strengthens the confirmation — heavy volume means the intraday recovery had conviction behind it, not just a handful of late buyers.
Is the hanging man reliable as a short signal?
Moderately reliable. The hanging man is the weakest of the single-candle top reversal signals and requires next-day red confirmation to be tradeable. The key is location: a hanging man at a fresh all-time high or at a clear resistance level on above-average volume is tradeable. The same shape in the middle of an uptrend on light volume usually fails. Most experienced traders use the hanging man as an EXIT signal for long positions rather than a dedicated short entry — shorting in an established uptrend is harder than simply stepping aside.
Where should I place a stop-loss when trading a hammer?
Below the hammer's LOW — below the wick extreme, not below the body. The hammer low is the point at which sellers would regain control if price broke through. Setting the stop at the body's bottom leaves no room for the natural wick retest that often happens on day 2 or 3. For a hammer at Rs 100 with a low of Rs 95, the stop goes at Rs 94.50 (below the wick). For a hanging man at the top, the stop goes ABOVE the candle's high, which is usually the body top because the upper wick is tiny.
Can a hammer appear in the middle of an uptrend?
Geometrically yes, but it has no predictive value there. A hammer is a REVERSAL signal, which requires a prior downtrend to reverse. In the middle of an uptrend, the same shape is just a normal candle with a wick rejection from a short intraday pullback. Always check the prior 3-5 sessions for a real decline before treating any candle as a hammer. This is the single most common beginner mistake with this pattern.
How long does a hammer or hanging man take to play out?
Most hammer/hanging-man reversals produce their main move within 5-10 trading sessions. The SBI hammer on February 2, 2026 reached +11.40 percent in 5 sessions. The Dr Reddy hanging man on July 30, 2025 dropped −7.38 percent in 5 sessions. If the pattern is going to work, it usually works quickly. If price is still sitting at the hammer level after 7-8 sessions with no breakout, the reversal premise is probably failing and the trade should be reconsidered.
Why does volume matter so much for hammer validation?
Volume shows conviction. A hammer is essentially a story about sellers pushing down and buyers fighting back. If volume is light, the whole story is a small-stakes affair between a handful of traders — the reversal claim is weak. If volume is heavy (above 1.5x the 20-day average), the story becomes real: many participants saw the intraday low and responded with buying. Heavy-volume hammers work roughly twice as often as light-volume hammers. Before treating any hammer as tradeable, always check the volume ratio.
Related Articles:
- What Are Candlestick Charts?
- Anatomy of a Candlestick
- Bullish Candlestick Patterns
- Bearish Candlestick Patterns
- Doji Candle Explained
- Engulfing Patterns Detailed look
- Morning Star and Evening Star
- Support and Resistance
- Volume in Trading
- What is a Trend?
A hammer at support is a setup; a hammer in mid-range is a noise candle. Context decides which one you are looking at. Per the SEBI FY24-25 study, 91 percent of individual equity F&O traders lost money.