Quick Answer: A risk-reward ratio (R:R) compares how much you stand to lose versus how much you stand to gain on a trade. Formula: R:R = Stop Loss Distance ÷ Profit Target Distance. A 1:2 ratio means risking ₹1,000 to gain ₹2,000. Professional traders demand minimum 1:2 — this allows profitability even with only a 40% win rate.
Published March 10, 2026 · Last refreshed April 27, 2026. Prices and data are compiled with reasonable care but — always confirm against your broker before trading.
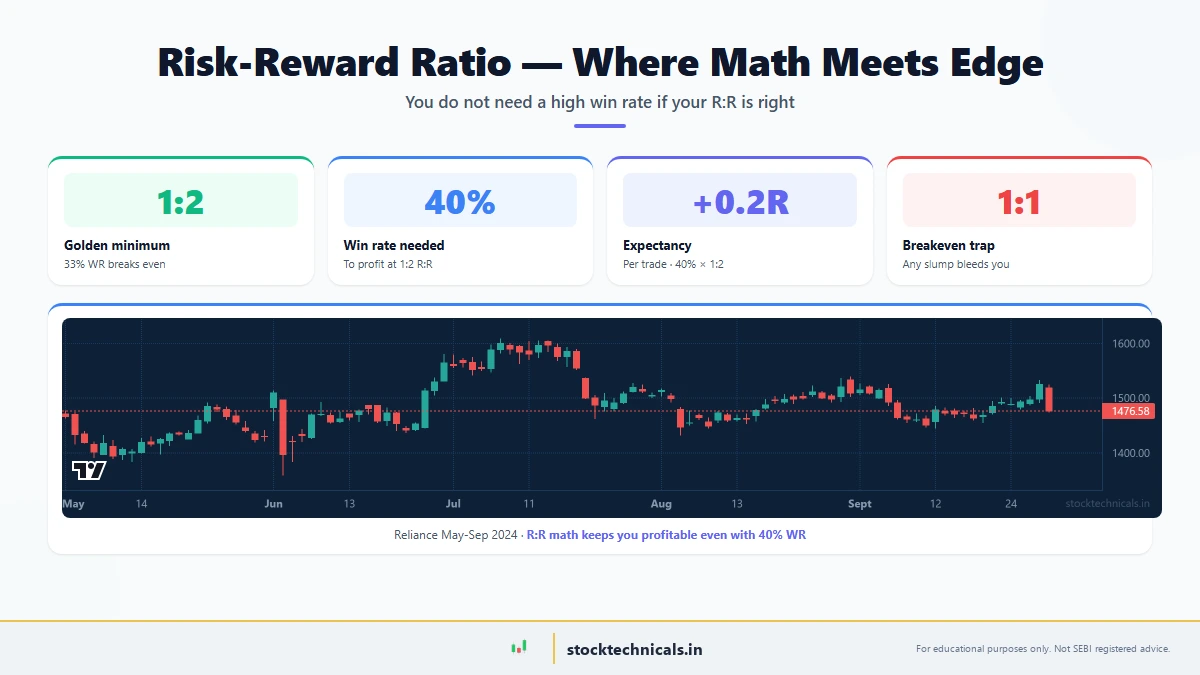
Risk-Reward Ratio: Why Math Beats Win Rate

Introduction: Why Your Win Rate Doesn't Matter Without Risk-Reward Ratio
You've just completed your stop loss strategies training. You're confident about where to place your stop loss. But here's the uncomfortable truth: even the best stop loss won't save your trading account if you don't get the risk-reward ratio right.
Consider this scenario: Suppose you're a swing trader on Nifty 50 (NSE: NIFTY 50). You enter 100 trades in a month. Your stop loss is placed perfectly—your win rate is an impressive 60%. You win 60 trades and lose 40 trades. Sounds profitable, right?
Not necessarily.
Key Takeaways
- R:R Formula: (Entry − Stop Loss) ÷ (Target − Entry) — if result is less than 0.5, the trade qualifies as 1:2 or better
- Breakeven Win Rate = 1 ÷ (1 + R:R Ratio) — with 1:2 R:R, you only need to win 33% of trades to break even
- A 60% win rate with 1:0.5 R:R loses money; a 40% win rate with 1:3 R:R makes money — the math always wins
- Never enter a trade without a pre-defined target — setting target after entry creates emotional decision-making
- Expectancy Formula: (Win Rate × Avg Win) − (Loss Rate × Avg Loss) — must be positive for a viable strategy
- Scaling out locks in profits: exit 50% at 1:1, hold remaining 50% for 1:2 or 1:3 target
If you risk ₹500 per trade but only target ₹400 in profit, you're walking into a mathematical trap. Your total profit = (60 × ₹400) − (40 × ₹500) = ₹24,000 − ₹20,000 = ₹4,000. You've won 60% of your trades but barely scratched out 4,000 rupees.
Now flip the scenario. Same 60% win rate. But this time, you risk ₹500 and target ₹1,500 profit (a 1:3 ratio). Your total profit = (60 × ₹1,500) − (40 × ₹500) = ₹90,000 − ₹20,000 = ₹70,000.
The difference? Not your skill. The difference is the risk-reward ratio.
This complete guide will show you exactly how to calculate, set, and use risk-reward ratios to build a profitable trading system—even if your win rate is below 50%.
What Is a Risk-Reward Ratio? The Core Definition

A risk-reward ratio (often written as R:R or R/R) is the amount of money you stand to lose on a trade divided by the amount of money you stand to gain.
Formula:
```
Risk-Reward Ratio = Potential Loss ÷ Potential Profit
```
Or stated another way:
```
R:R = (Entry Price − Stop Loss) ÷ (Target Price − Entry Price)
```
If your risk is ₹100 and your profit target is ₹300, your ratio is 1:3. You risk 1 rupee to make 3 rupees.
The Golden Principle
The size of your potential loss should always be smaller than the size of your potential profit. When you enter a trade, you should know exactly how much you can lose and how much you plan to gain. The ratio between these two numbers determines whether your trading system is profitable in the long run—regardless of how many trades you win or lose.
This principle comes from position sizing and risk management theory, concepts embraced by every profitable trader from Jesse Livermore to modern fund managers.
Why does this work?
Because a favorable risk-reward ratio compensates for an imperfect win rate. Professional traders often have win rates between 40-55%. They profit because they've mastered the ratio: they let their winners run (high reward) while they cut their losers short (low risk).
How to Calculate Risk-Reward Ratio: Step-by-Step

Data refreshed Apr 19, 2026 · Source: NSE (daily OHLC)
Let's break down the calculation with real Nifty 50 examples so you can apply this immediately.
Step 1: Identify Your Entry Price
This is where you plan to enter the trade. Let's say you've identified a bullish candlestick pattern on Nifty 50, and you want to buy at 22,500.
Step 2: Determine Your Stop Loss
Your stop loss is the price at which you'll admit you're wrong and exit. Let's place it 100 points below your entry: 22,400.
Your potential loss = 22,500 − 22,400 = 100 points
Step 3: Set Your Target Price
This is where you expect the trade to reach based on support and resistance, Fibonacci levels, or other technical analysis. Let's set a target at 22,800 (300 points above entry).
Your potential profit = 22,800 − 22,500 = 300 points
Step 4: Calculate the Ratio
```
R:R = 100 ÷ 300 = 1:3
```
You're risking 100 points to make 300 points. This is a 1:3 risk-reward ratio, which is excellent.
Example: Reliance Stock Entry
Let's say you're trading Reliance (a stock with high liquidity on NSE). Current price: ₹2,850.
- Entry: ₹2,850 (you spot an uptrend continuation at this level)
- Stop Loss: ₹2,800 (100 below, a clear level where the trend would be broken)
- Target: ₹3,050 (200 above, based on prior resistance)
Calculation:
```
Risk = 2,850 − 2,800 = ₹50 per share
Profit = 3,050 − 2,850 = ₹200 per share
R:R = 50 ÷ 200 = 1:4
```
With a 1:4 ratio, you're risking ₹50 per share to make ₹200 per share. Excellent ratio.
If you buy 100 shares at ₹2,850:
- Total risk = 100 × ₹50 = ₹5,000
- Total profit = 100 × ₹200 = ₹20,000
Why 1:2 Is the Minimum Golden Rule

You've heard it from every profitable trader: "Never risk more than you can gain."
But why specifically 1:2?
Let's do the math.
The Break-Even Math
With a 1:2 risk-reward ratio, you can lose 2 trades and win only 1 trade, and you'll break even:
```
1 winning trade at 2:1 ratio = +₹2,000
2 losing trades = −₹2,000
Net profit = ₹0
```
But with a 1:1 risk-reward ratio, you need to win 50% of your trades just to break even:
```
5 winning trades at 1:1 = +₹5,000
5 losing trades = −₹5,000
Net = ₹0 (but you've spent time, energy, and stress)
```
The Profitability Table
Here's the critical table every trader should memorize:
| Win Rate | 1:1 Ratio | 1:1.5 Ratio | 1:2 Ratio | 1:3 Ratio | 1:5 Ratio |
|---|---|---|---|---|---|
| 40% | -20% | +20% | +60% | +100% | +160% |
| 50% | +0% | +50% | +100% | +150% | +250% |
| 60% | +20% | +100% | +180% | +260% | +420% |
Even with a 40% win rate, a 1:2 ratio gives you a 60% return. This is why professional traders aren't obsessed with winning every trade—they're obsessed with managing risk.
The Psychological Edge
Beyond the math, a 1:2 minimum does something else: it removes the need to predict perfectly.
If you use a 1:1 ratio, you've bet your account that you'll be right 50%+ of the time. That's a high bar.
If you use a 1:2 ratio, you only need to be right 33% of the time to profit. That's 1 win out of every 3 trades. Suddenly, trading doesn't feel like you're fighting the odds.
Setting Targets Using Risk-Reward Ratio
Now that you understand why 1:2 matters, how do you actually set targets that make sense?
Method 1: Fibonacci Retracements (Swing Trading)
For swing trades on Nifty 50 or stocks like TCS or HDFC Bank, Fibonacci retracements often provide natural target levels:
Example: Bank Nifty Swing Trade
- Previous swing low: 45,200
- Previous swing high: 46,800
- Current price: 46,200
- You enter long at: 46,200
Fibonacci targets:
- 23.6% retracement = 46,500 (small target)
- 38.2% retracement = 46,800 (medium target)
- 50% retracement = 46,900 (strong target)
- 61.8% retracement = 47,100 (extended target)
If your stop loss is at 45,800:
- Risk = 46,200 − 45,800 = 400 points
To hit a 1:2 ratio, your target = 46,200 + (2 × 400) = 47,000 points
This target aligns near the 61.8% Fibonacci retracement, which is perfectly natural.
Method 2: Support and Resistance (Intraday Trading)
For intraday trades on Nifty 50 (9:15 AM to 3:30 PM IST), prior swing highs and lows provide clear targets.
Intraday Example:
- Previous day's high: 22,650
- Previous day's low: 22,350
- Today's entry: 22,400 (breakout above yesterday's low)
- Stop loss: 22,340 (just below the level)
Risk = 22,400 − 22,340 = 60 points
For 1:2 ratio: Target = 22,400 + (2 × 60) = 22,520 (near a prior intraday resistance)
Method 3: ATR-Based Targets (Mechanical Approach)
Average True Range (ATR) tells you the daily volatility. Use this to set targets proportionally.
Formula:
```
Target = Entry + (2 × ATR) [for 1:2 ratio]
Target = Entry + (3 × ATR) [for 1:3 ratio]
Stop Loss = Entry − ATR
```
Reliance Example:
- Current price: ₹2,850
- 14-period ATR: ₹30
For a 1:2 ratio:
- Stop Loss = 2,850 − 30 = ₹2,820
- Target = 2,850 + (2 × 30) = ₹2,910
This is mechanical, simple, and requires no chart analysis—just let volatility guide you.
Adjusting Risk-Reward for Different Trading Styles
The "perfect" risk-reward ratio isn't the same for all traders. It depends on your trading style.
Scalping (Hold 2-30 Minutes)
Scalpers trade very short timeframes on Nifty 50 index options or liquid stocks. Targets are tight, stop losses are tight.
- Typical R:R: 1:1 to 1:1.5
- Target: 5-20 points on Nifty, ₹2-5 per share on stocks
- Why lower ratio? At such short timeframes, catching a 1:3 move is unrealistic. You're fighting spreads and slippage. Better to lock in small, consistent wins.
- Win rate needed: 55-60% to be profitable
Scalping Example (Nifty 50):
- Entry: 22,500 | Stop: 22,495 (5-point stop) | Target: 22,507 (7-point target)
- R:R = 5:7 = 1:1.4 ✓
Intraday Trading (Hold 1-8 Hours)
Intraday traders use the 9:15 AM to 3:30 PM IST window to capture moves within a single day.
- Typical R:R: 1:2 to 1:2.5
- Target: 50-150 points on Nifty, ₹15-50 per share
- Why medium ratio? You have the full trading day, so the stock/index can move more, but you need to exit before market close.
- Win rate needed: 40-45%
Intraday Example (Bank Nifty):
- Entry: 45,800 | Stop: 45,600 (200-point stop) | Target: 46,200 (400-point target)
- R:R = 200:400 = 1:2 ✓
Swing Trading (Hold 2-7 Days)
Swing traders hold positions across multiple days, capturing medium-term trends.
- Typical R:R: 1:3 to 1:4
- Target: 200-500 points on Nifty, ₹50-200 per share
- Why higher ratio? You have days for the trade to develop, and stops can be placed at meaningful technical levels far from entry.
- Win rate needed: 33-40%
Swing Trading Example (Infosys Stock):
- Entry: ₹1,800 | Stop: ₹1,700 (₹100 stop) | Target: ₹2,100 (₹300 target)
- R:R = 100:300 = 1:3 ✓
Position Trading (Hold 1-12 Weeks)
Position traders hold for extended periods, capturing major trends.
- Typical R:R: 1:5 or higher
- Target: 500-2000 points on Nifty, ₹200-₹1000+ per share
- Why very high ratio? The longer your time horizon, the more room for a favorable move. Stops are at the weekly/monthly chart level, targets at major resistance zones.
- Win rate needed: 20-30%
Position Trading Example (TCS):
- Entry: ₹3,500 | Stop: ₹3,200 (₹300 stop, at 200-day moving average) | Target: ₹4,500 (₹1,000 target, at prior 6-month high)
- R:R = 300:1000 = 1:3.3 ✓
Quick Reference Table
| Trading Style | Time Frame | Typical R:R | Nifty 50 Target | Stock Target | Win Rate |
|---|---|---|---|---|---|
| Scalping | 2-30 min | 1:1–1:1.5 | 5-20 pts | ₹2-5 | 55-60% |
| Intraday | 1-8 hrs | 1:2–1:2.5 | 50-150 pts | ₹15-50 | 40-45% |
| Swing | 2-7 days | 1:3–1:4 | 200-500 pts | ₹50-200 | 33-40% |
| Position | 1-12 wks | 1:5+ | 500-2000 pts | ₹200+ | 20-30% |
Platform Setup: Calculating Risk-Reward Ratio on Your Broker
Now let's get practical. How do you calculate and execute trades with proper R:R on the platforms you actually use?
TradingView (Desktop & Web) — Complete Setup Guide
TradingView is the gold standard for technical analysis in India, used by traders on Zerodha, Angel One, Upstox, and standalone traders.
Step-by-Step Setup for Long Position Tool:
- Open your chart (e.g., Nifty 50, 1-hour timeframe on TradingView.com)
- Locate the Drawing Tools panel on the left sidebar
- Click "Long Position Tool" (icon looks like an upward arrow with horizontal lines)
- Mark your entry: Click once on the price level where you want to enter (e.g., 22,500 on a Nifty 50 chart)
- Mark your stop loss: Click the price level below your entry where you'll exit if wrong (e.g., 22,400)
- Mark your target: Click the price level above your entry where you expect to take profit (e.g., 22,800)
- Observe the automatic calculation: TradingView displays:
- Risk: 100 points (Entry − Stop Loss)
- Reward: 300 points (Target − Entry)
- R:R Ratio: 1:3 (shown in the tool label)
Example (Nifty 50):
- Entry: 22,500
- Stop Loss: 22,350 (150-point stop at a prior swing low)
- Target: 22,800 (300 points, seeking 1:2 ratio)
- Ratio displayed: 1:2 ✓
Pro Tip: You can drag the target line up and down dynamically. Watch the ratio update in real-time until it matches your desired ratio (1:2, 1:3, 1:4, etc.). This visual feedback is why traders love TradingView.
For Short Positions: Use the "Short Position Tool" instead, following the same three-click process.
[Chart Suggestion 1: "TradingView Long Position Tool Setup - Nifty 50 Daily Chart" showing entry, stop loss, and target marked with tool labels]
Zerodha Kite (Most Popular in India) — Complete Workflow
Zerodha Kite doesn't have a built-in R:R calculator, so traders must calculate manually before placing orders. Here's the exact workflow:
Manual Calculation Workflow:
- On TradingView or chart software of choice, use the Long Position Tool to identify your entry, stop loss, and target
- Calculate your R:R ratio:
- Risk = Entry Price − Stop Loss Price
- Reward = Target Price − Entry Price
- Ratio = Reward ÷ Risk
- Example (Reliance):
- Entry: ₹2,850
- Stop Loss: ₹2,800 (₹50 risk per share)
- Desired Ratio: 1:3
- Target = 2,850 + (50 × 3) = ₹3,000
- Verify: Risk ₹50, Reward ₹150 → 1:3 ✓
- On Zerodha Kite, place your orders:
- For swing trades: Use Bracket Order (BO) feature
- Buy limit order at ₹2,850
- Stop Loss at ₹2,800 (placed automatically in BO)
- Target at ₹3,000 (place sell limit separately)
- For intraday trades: Place regular limit buy at ₹2,850, then use BO for stop loss and target
- Verify before confirming:
- Check: Entry − Stop Loss = Risk ✓
- Check: Target − Entry = Reward ✓
- Check: Reward ÷ Risk ≥ 2 ✓
Zerodha Calculator Alternative:
If you prefer, Zerodha's built-in calculator (⚙ Settings → Tools → Calculator) can help verify math, but it doesn't calculate risk-reward directly. Use it only for basic arithmetic verification.
Real Workflow Example (Bank Nifty Swing Trade):
- Open Kite charts, identify Bank Nifty entry at 46,200
- Stop Loss at 45,800 (400-point stop at prior swing low)
- Calculate target for 1:2 = 46,200 + (400 × 2) = 47,000
- Verify: 400 risk, 800 reward → 1:2 ✓
- Place Buy BO: Qty 1 Lot, Limit 46,200, Stop Loss 45,800, Target 47,000
- Execute and track in journal
[Chart Suggestion 2: "Zerodha Kite Bracket Order Setup - Bank Nifty with Entry, Stop Loss, Target Fields"]
Angel One (For Options & F&O)
Angel One's terminal shows real-time Greeks and P&L, making it popular for options traders. To calculate R:R:
- Open the order entry screen on Angel One terminal
- Note your entry price (where you're buying the option premium)
- Identify your stop loss (where you'll exit if the trade goes wrong)
- Manually calculate risk:
- Risk = Entry Premium − Stop Loss Premium
- Example: Entry ₹245, Stop ₹215 → Risk = ₹30
- Set your target for desired ratio:
- For 1:2 ratio: Target = Entry + (2 × Risk)
- Example: Target = ₹245 + (2 × ₹30) = ₹305
- Place the order with SL and target orders
Real Bank Nifty Options Example:
- Long Call, Entry: ₹245 (₹24,500 premium for 1 lot)
- Stop Loss: ₹215 (exit if premium drops)
- Risk: ₹30 per share (₹3,000 per lot)
- Target for 1:2: ₹305 (₹30,500 per lot = ₹7,000 profit)
- Verify: Risk ₹3,000, Reward ₹6,000 → 1:2 ✓
Critical Note for Options: Options decay (theta) works against you daily. Set tighter risk-reward ratios (1:1.5 to 1:2) because your window to profit is narrower. Use 1:3+ only for longer-term positional options trades (2+ weeks to expiry).
[Chart Suggestion 3: "Angel One Options Trading Panel - Call Premium Entry with Stop Loss and Target"]
Groww & Upstox (Beginner-Friendly)
These platforms prioritize simplicity over advanced tools. They don't have built-in R:R calculators, so:
- Pre-calculate your ratio on paper or in a spreadsheet before opening the app
- Use a dedicated Risk-Reward Calculator (free online tools or StockTechnicals.in)
- Document entry, stop loss, and target before you touch the app
- Execute on the platform using the pre-calculated prices
- Track the results in a journal immediately after order execution
Example Pre-Execution Checklist for Groww:
- [ ] Chart analysis: Identified entry at TCS ₹1,850
- [ ] Technical stop loss: ₹1,800 (10-point stop at moving average)
- [ ] Risk calculation: ₹50 per share
- [ ] Target for 1:3: ₹1,800 + (₹50 × 3) = ₹1,950
- [ ] Reward: ₹100 per share
- [ ] Ratio verified: 1:3 ✓
- [ ] Position size: 50 shares (₹9,250 capital)
- [ ] Open Groww, place buy order at ₹1,850
- [ ] Log to journal: Entry time, entry price, stop, target, ratio
Why this matters: Without the tool telling you the ratio, you MUST discipline yourself to calculate before trading. This friction is actually beneficial—it forces you to think instead of react.
[Chart Suggestion 4: "Risk-Reward Calculator Spreadsheet Template - Pre-Execution Calculation Sheet"]
Advanced Context: Expectancy and the Win Rate Relationship

Professional traders use a concept called expectancy to evaluate their trading systems. This is where the real edge lies—not in being right most of the time, but in making more when right than losing when wrong.
The Expectancy Formula (Worked Examples)
```
Expectancy = (Win Rate × Average Win) − (Loss Rate × Average Loss)
```
Or more precisely with risk-reward ratios:
```
Expectancy = (Win % × Risk × Reward Ratio) − (Loss % × Risk)
```
Worked Example 1: Conservative Trader (45% Win Rate, 1:2 Ratio)
A swing trader on Nifty 50 risks ₹500 per trade with a 45% win rate and 1:2 target:
```
Expectancy = (0.45 × ₹500 × 2) − (0.55 × ₹500)
= (0.45 × ₹1,000) − (0.55 × ₹500)
= ₹450 − ₹275
= +₹175 profit per trade
```
Over 100 trades: 100 × ₹175 = ₹17,500 profit. Even though this trader loses more often than not, the ratio carries them to profitability.
Worked Example 2: Aggressive Trader (40% Win Rate, 1:5 Ratio)
A position trader on TCS stock risks ₹2,000 per trade with a 40% win rate and 1:5 target:
```
Expectancy = (0.40 × ₹2,000 × 5) − (0.60 × ₹2,000)
= (0.40 × ₹10,000) − (0.60 × ₹2,000)
= ₹4,000 − ₹1,200
= +₹2,800 profit per trade
```
Over 100 trades: 100 × ₹2,800 = ₹2,80,000 profit. Despite a 40% win rate (losing 60 out of 100 trades), this trader is massively profitable because of the ratio.
Worked Example 3: High Win Rate, Poor Ratio (60% Win Rate, 1:1 Ratio)
A scalper on Nifty 50 index options risks ₹100 per trade with a 60% win rate but only 1:1 ratio:
```
Expectancy = (0.60 × ₹100 × 1) − (0.40 × ₹100)
= ₹60 − ₹40
= +₹20 profit per trade
```
Over 100 trades: 100 × ₹20 = ₹2,000 profit. Despite winning 60% of the time, poor ratio = poor expectancy.
The Professional Insight
Professional traders obsess over expectancy. They ask:
- "Is my expectancy positive?"
- "How much am I making per unit of risk?"
- "How can I increase this?"
The answer is usually: Increase your risk-reward ratio. It's easier (and more reliable) to move your target further away than to improve your win rate from 45% to 50%.
Comparison Table with Real Rupee Examples (₹1,000 Risk per Trade):
| Win Rate | 1:1 Ratio | 1:2 Ratio | 1:3 Ratio | 1:5 Ratio |
|---|---|---|---|---|
| 30% | -₹400 | +₹400 | +₹1,400 | +₹2,400 |
| 40% | -₹200 | +₹800 | +₹1,800 | +₹3,800 |
| 50% | ₹0 | +₹1,000 | +₹2,000 | +₹4,000 |
| 60% | +₹200 | +₹1,200 | +₹2,200 | +₹4,200 |
Key Insight: A 30% win rate with 1:3 ratio (₹1,400 profit per trade) beats a 60% win rate with 1:1 ratio (₹200 profit per trade) by 7x.
Trading Rule: Calculate Expectancy Before You Trade
Before entering ANY trade, ask yourself: "What is my expected profit per trade assuming my math on win rate is correct?" If expectancy is positive and at least ₹200-300, the trade is worth taking. If it's negative or break-even, skip it.
[Chart Suggestion 5: "Expectancy Heatmap - Win Rate vs Risk-Reward Ratio Profit Matrix"]
Five Risk-Reward Ratio Rules Every Trader Must Follow
Trading Rule 1: Never Enter a Trade Without a Target
Before you click "Buy," you must know where you're selling. If you don't have a target—a specific price level where you'll take profit—you don't have a trade plan. You have a gamble.
Rule: Every trade needs three prices: Entry, Stop Loss, and Target. Write them down BEFORE you execute. Do not change them based on emotions or "hope."
Example (Infosys):
- You see a bullish candlestick pattern at ₹1,850
- Before buying, you write: Entry ₹1,850, Stop ₹1,800, Target ₹2,050
- Only THEN do you click buy
- If the trade doesn't execute at ₹1,850, you skip it. No improvisation.
Action: Use a pre-trade checklist. Don't execute until three prices are written down.
Trading Rule 2: Minimum 1:2 Ratio (No Exceptions)
If the risk-reward ratio of a trade is 1:1 or worse, skip it. No matter how "certain" you feel, the odds aren't in your favor. Wait for the next setup where you can risk ₹100 to make ₹200 or more.
Rule: If
Target − Entry < 2 × (Entry − Stop Loss), the trade is rejected. Period.
Mathematical Proof:
- 1:1 ratio requires 50% win rate just to break even
- 1:2 ratio only requires 33% win rate to profit
- The difference = a lower bar for success
Example (Bank Nifty):
- Setup at 46,200 with stop at 46,000 (200-point stop)
- Target at 46,300? NO. Ratio = 1:0.5. Rejected.
- Target at 46,400? NO. Ratio = 1:1. Rejected.
- Target at 46,600? YES. Ratio = 1:2. Accepted. ✓
Action: Before entering any trade, calculate: (Target − Entry) ÷ (Entry − Stop Loss). If result < 2, skip the trade.
Trading Rule 3: Adjust Ratios for Your Trading Style
You're not a scalper if you hold for 3 days. You're not a swing trader if you take 10-point profits. Know your style, and use the ratio that matches it.
Rule: Your trading style determines your ratio. Mixing styles = mixing risk profiles = inconsistent results.
Matching Examples:
- Scalping Bank Nifty: 30-second to 5-minute holds, 1:1 to 1:1.5 ratio (tight targets)
- Intraday Nifty 50: 1-4 hour holds, 1:2 ratio (medium targets, full trading day window)
- Swing TCS: 2-5 day holds, 1:3 to 1:4 ratio (wide targets, days to develop)
- Position HDFC Bank: 2-12 week holds, 1:5+ ratio (very wide targets, major moves)
Action: Choose one trading style. Commit to it for at least 25 trades. Use only the ratio associated with that style. Track results. Only switch styles if you've completed the 25-trade minimum.
Trading Rule 4: Use Technical Levels, Not Arbitrary Numbers
Your stop loss and target should sit at technical levels: support/resistance zones, moving averages, trendline breaks, or levels with confluence (multiple confluences = stronger level).
Rule: Random numbers = random results. Technical levels = predictable behavior.
Bad Setup (Random Numbers):
- Entry: 22,500 (just because)
- Stop: 22,480 (random -20)
- Target: 22,560 (random +60)
- Result: Likely to stop out randomly, target unlikely to hit
Good Setup (Technical Levels):
- Entry: 22,500 (breakout of yesterday's high 22,480, confluence of 200-day MA)
- Stop: 22,400 (prior swing low, clear rejection level)
- Target: 22,800 (prior resistance zone, Fibonacci 61.8% target)
- Result: Stop and target sit on price-action landmarks where traders actively trade
Real Reliance Example:
- Current price: ₹2,850
- 20-day MA: ₹2,840 (support)
- Previous swing high: ₹2,880 (resistance)
- Entry: ₹2,855 (breakout above 20-day MA)
- Stop: ₹2,835 (just below 20-day MA, clear break)
- Target: ₹2,900 (between prior swing high and next resistance)
- Ratio: (2,900 − 2,855) ÷ (2,855 − 2,835) = 45 ÷ 20 = 1:2.25 ✓
Action: Before placing any trade, identify technical levels on your chart. Make sure your stop and target sit ON these levels, not between them randomly.
Trading Rule 5: Backtest Your Ratio Before Trading Real Money
If you're new to a strategy, test it on historical data first. Calculate the ratio for 20+ past setups and see what worked.
Rule: Never trade a strategy live until you've tested it on 20+ historical setups. Backtesting is your insurance policy.
Backtest Checklist:
- Choose a strategy (e.g., "breakout above 20-day MA on daily chart")
- Open TradingView in "replay" mode
- Go back 3 months in history
- Find 20+ setups that match your criteria
- For each setup, mark: entry, stop loss, target (using your R:R rule)
- Track what ACTUALLY happened to price
- Calculate: How many targets were hit? How many stopped out?
- Calculate your actual historical expectancy
- If expectancy is positive, trade it live. If negative, revise the strategy.
Example (Nifty 50 Swing Trade Backtest):
- Strategy: Long above 23,000 (daily close), Stop below 22,800, Target at 1:2 ratio
- Backtest period: Dec 2025 - Feb 2026 (3 months)
- Setups found: 15
- Targets hit: 9 (60%)
- Stopped out: 6 (40%)
- Expectancy: (0.60 × ₹200) − (0.40 × ₹100) = ₹120 − ₹40 = ₹80 per trade
- Over 100 trades: ₹8,000 profit ✓
- Conclusion: Trade this strategy live
Action: Before trading, spend 2-3 hours backtesting. Use TradingView replay mode. Test at least 20 setups. Only trade if expectancy is clearly positive.
[Chart Suggestion 6: "Five Trading Rules of Risk-Reward Ratio" - numbered infographic with icons]
Risk-Reward Ratio Checklist: Pre-Trade Verification
Before you enter ANY trade, run through this checklist:
- [ ] I have identified a clear entry price based on technical analysis
- [ ] I have placed a stop loss at a technical level (support, resistance, trendline break, or moving average)
- [ ] I have calculated my potential loss in rupees or points
- [ ] I have set a target price at a technical level (Fibonacci, support/resistance, ATR-based)
- [ ] I have calculated my potential profit in rupees or points
- [ ] I have calculated my risk-reward ratio = Potential Loss ÷ Potential Profit
- [ ] My ratio is at least 1:2 (or matches my trading style: 1:1.5 for scalpers, 1:3+ for swing traders)
- [ ] I have checked the math:
(Entry − Stop) × 2 ≤ (Target − Entry)✓ - [ ] I know my exact position size based on position sizing rules
- [ ] I have executed the trade on my chosen platform with stop loss and target orders set
Only enter the trade once every checkbox is ticked.
Common Mistakes: What Kills Risk-Reward Ratios (and How to Avoid Them)

Mistake 1: Accepting 1:0.5 or 1:1 Ratios
The Trap:
"The stock is moving toward my target. I'll take a smaller target just to lock in profit."
This thinking is a trap. A 1:1 ratio requires a 50% win rate just to break even. Unless you're a professional day trader with a 60%+ win rate, avoid it.
The Math:
- 1:1 ratio, 50% win rate: (0.50 × 100) − (0.50 × 100) = ₹0 (breakeven only)
- 1:1 ratio, 45% win rate: (0.45 × 100) − (0.55 × 100) = −₹10 (losing money)
How to Avoid:
✓ Accept that some trades won't reach your 1:2 target. That's normal.
✓ Your winners will more than compensate for your losers if your ratio is right.
✓ Track 20 trades. Even with a 40% win rate, 1:2 ratio should show profit.
Mistake 2: Moving Your Target Closer When the Trade Is "Almost There"
The Trap:
You set a 1:2 target at Nifty 22,800, but the index stalls at 22,780. "I'll lower my target to 22,780 just to lock in profit."
Now your ratio is 1:1.6 instead of 1:2. You've just downgraded your expected value on every future trade where you do this.
The Cost Over Time:
- 100 trades at 1:2: Expected ₹8,000 profit
- 100 trades at 1:1.6: Expected ₹4,800 profit
- You just left ₹3,200 on the table.
How to Avoid:
✓ Don't move your target unless the market structure fundamentally changes
✓ If your original target sits on strong resistance, trust it. Price often breaks through on a second attempt.
✓ Use a rule: "I only move my target if a candlestick closes below my stop loss level, invalidating the trade thesis."
[Chart Suggestion 7: "Nifty 50 Trade Example - Target Hit After Initial Stall (Why You Should Wait)"]
Mistake 3: Moving Your Stop Loss Further Away to Avoid Losses
The Trap:
You're down ₹500 on the trade. "I'll move my stop loss from 22,400 to 22,350 to give it more room."
Now your risk has doubled from 100 points to 150 points. You're also breaking risk management rules and increasing position size without authorization.
The Danger:
- Original trade risk: ₹500
- New risk after moving stop: ₹750 (50% increase)
- If stopped out at new level, you lose 50% more
- Average loss = ₹750 × 0.55 (assuming 45% win rate) = ₹412 per trade (up from ₹275)
How to Avoid:
✓ Set your stop loss at entry. Don't move it down for ANY reason.
✓ If you're tempted to move it, take it as a sign: Either you entered at the wrong place, or the trade is invalidated.
✓ The right action is to cut the trade and move on, not to increase your risk.
✓ Use a pre-trade rule: "I place my stop loss order immediately upon entry. If it gets filled, I accept the loss."
Mistake 4: Ignoring Risk-Reward Ratio Altogether
The Trap:
"I just trade by feel. I don't worry about targets and stops. I just see what happens."
You're not trading. You're gambling. And statistics say 93% of intraday traders lose money—because they don't use risk-reward ratios.
The Cost:
- 100 trades without R:R planning: Expected loss 93% × position size
- 100 trades with 1:2 ratio and 40% win rate: Expected profit 60% × position size
How to Avoid:
✓ Before your next trade, write down three things: entry price, stop loss price, target price
✓ Calculate the ratio: (Target − Entry) ÷ (Entry − Stop Loss)
✓ If ratio < 1:2, skip the trade
✓ Only then click "Buy"
✓ Don't change these prices unless the trade is invalidated by price action
Mistake 5: Taking Multiple Small Profits Instead of One Large Target
The Trap:
You set a 1:3 target at Nifty 22,800 (300 points), but you take profits at:
- ₹100 at 22,600 (sell 30% of position)
- ₹100 at 22,700 (sell 40% of position)
- ₹100 at 22,750 (sell final 30%)
- Price hits 22,800 but you're already out
Your actual profit: ₹300. Your risk: ₹150. Ratio appears 1:2, but you left ₹150 on the table.
The Cost Over Time:
- 100 trades with single target hitting all targets: ₹1,000 × 100 = ₹1,00,000 profit
- 100 trades with partial exits hitting 75% of max: ₹750 × 100 = ₹75,000 profit
- You just left ₹25,000 on the table by overthinking.
How to Avoid:
✓ Set one target per trade. One entry, one stop loss, one target.
✓ Only use scaling out (partial exits) AFTER you've proven a strategy works for 50+ trades
✓ If you use scaling out, use this rule: "Sell 50% at first target for 1:2 ratio. Move stop to breakeven. Let 50% ride for 1:3+ target."
✓ This keeps most of your position running while locking in profit
Real TCS Example (Scaling Out Correctly):
- Entry: ₹1,850 (₹1,00,000 capital, 54 shares)
- Stop: ₹1,800 (₹50 risk per share)
- Target 1: ₹1,900 (1:1 ratio, ₹50 profit per share)
- Target 2: ₹1,950 (1:3 ratio, ₹100 profit per share)
- Execution:
1. Price hits ₹1,900: Sell 27 shares (50% of position), lock ₹1,350 profit
2. Move stop to ₹1,850 (breakeven on remaining 27 shares)
3. Let 27 shares ride to ₹1,950
4. Price hits ₹1,950: Sell final 27 shares, earn ₹2,700 more profit
5. Total profit: ₹1,350 + ₹2,700 = ₹4,050
6. Average return: ₹4,050 ÷ ₹1,00,000 = 4% per trade ✓
[Chart Suggestion 8: "TCS Trade with Scaling Out Strategy - Exit at 1:1, Hold for 1:3, Combined Result"]
Interactive Tool: Risk-Reward Calculator
Risk-Reward Calculator
Visualize risk vs reward and simulate trade outcomes before entering any position
Trade Setup
Risk-Reward Analysis
Breakeven Win Rate Table
Minimum win rate needed to break even at each risk-reward ratio. Current setup highlighted.
| R:R Ratio | Breakeven Win Rate | With 50% Win Rate | Verdict |
|---|
Trade 100 Times Simulator
Why 1:2 Minimum Risk-Reward
At 1:2 R:R, risking ₹1 to make ₹2, a trader only needs to win 33.3% of trades to break even.
100 trades: 34 wins x ₹2 = ₹68 gained. 66 losses x ₹1 = ₹66 lost. Net: +₹2 profit.
At 1:1 R:R, the same trader needs 50%+ accuracy. Most retail traders achieve only 35-45% accuracy. That means 1:1 trades are a guaranteed loss for most people.
The math is simple: lower win rate demands higher R:R. Since most traders win less than 50% of the time, a minimum 1:2 R:R makes profitability possible even with average accuracy.
Risk-Reward by Trading Style
| Style | Typical R:R | Win Rate Range | Trades/Day | Holding |
|---|---|---|---|---|
| Scalping | 1:1 to 1:1.5 | 55-65% | 10-50 | Seconds to minutes |
| Intraday | 1:2 to 1:3 | 40-50% | 2-8 | Minutes to hours |
| Swing | 1:3 to 1:5 | 35-45% | 0-2 | Days to weeks |
| Positional | 1:4+ | 30-40% | 0-1 | Weeks to months |
Scalpers need higher win rates because their R:R is lower. Swing traders can afford more losses because each win covers multiple losses.
The Win Rate Truth
40% win rate + 1:3 R:R = Profitable
100 trades: 40 wins x ₹3 = ₹120. 60 losses x ₹1 = ₹60. Net profit: ₹60. Winning less than half the time but still making money. This is how professional traders think.
60% win rate + 1:1 R:R = Barely surviving
100 trades: 60 wins x ₹1 = ₹60. 40 losses x ₹1 = ₹40. Net: ₹20. A 60% accuracy with terrible R:R makes less money than a 40% accuracy with 1:3 R:R.
Multi-Target Strategy
Partial exits protect profits while letting winners run.
Target 1 (1:1): Exit 33% of the position. This books enough profit to cover the risk on the remaining position.
Target 2 (1:2): Exit another 33%. Now the trade is in pure profit territory. Move stop-loss to entry (risk-free trade).
Target 3 / Trail: Let the remaining 34% ride with a trailing stop-loss. This is where the big wins come from.
Multi-target exits reduce the blended R:R but increase the overall win rate. The net effect is more consistent equity growth with smaller drawdowns.
The Bottom Line
The risk-reward ratio is the mathematical foundation of profitable trading. It tells you, before entering a trade, whether your strategy is viable in the long run. A 1:2 minimum keeps you profitable even when you're wrong half the time. Use the TradingView long position tool or Zerodha bracket orders to set your target before every trade. Once this becomes a habit, you'll automatically skip low-quality setups and wait for high-probability, high-reward opportunities.
I traded 1:1 risk-reward setups for a year before I learnt that the math demands at least 1:2. Below 1:2, even a 60% win rate barely keeps you above breakeven.
What is a good risk-reward ratio for swing trading?
1:2 is the minimum acceptable risk-reward ratio for most swing trading setups. This means risking ₹100 to potentially make ₹200. With a 1:2 ratio, you only need a 34% win rate to break even, and 40-45% to be consistently profitable. Setups with 1:3 or better are preferable when the chart structure supports it — typically clean trend continuation patterns at major support or resistance.
Why does win rate matter less than risk-reward ratio?
Most retail traders obsess over win rate, but the math says win rate matters far less than risk-reward when the ratio is favourable. A trader with a 40% win rate at 1:3 risk-reward is more profitable than a trader with a 60% win rate at 1:1. The losing months come from being right often enough but losing too much when wrong. Big winners covering small losers is the foundation of profitable trading.
Should I exit at the 1:2 target or hold for more?
If your trading rules say 1:2, take the 1:2 target — discipline is more valuable than optimisation. That said, scaling out is a strong middle path: book half at 1:2 to lock in profit, trail the rest with a moving stop on the next major level. This converts the trade into a free ride and lets winners run further. Just don't move stops backward.
How do I calculate risk-reward ratio before entering a trade?
Risk = entry price minus stop-loss price. Reward = target price minus entry price. The ratio is reward divided by risk. For example, if you enter at ₹500, stop at ₹490, target ₹520, then risk = ₹10 and reward = ₹20, giving a 1:2 ratio. Always calculate this before placing the order — if the math doesn't show 1:2 or better, skip the trade.
Can I trade with a 1:1 risk-reward ratio?
Technically yes, but 1:1 setups demand a 55% win rate just to break even after brokerage and slippage — most traders cannot sustain that consistently. Some intraday scalping strategies justify 1:1 because of the high frequency, but for swing and positional trading, 1:1 is below the math threshold. Rejecting sub-1:2 setups is one of the cleanest filters a trader can apply.
RISK NOTICE
Technical analysis is a skill, not a guarantee. Every trade carries risk of loss. The SEBI study shows 93% of intraday traders lose money — most without a systematic risk management framework. Never trade money you cannot afford to lose. Stop losses and position sizing are not optional safety nets; they are the foundation of professional trading. This content is for educational purposes only and is not investment advice. Consult a SEBI-registered investment advisor before trading.