Quick Answer: Position sizing is calculating how many shares or contracts to buy based on your account size, risk tolerance, and stop loss distance. The core formula: Position Size = (Account Value × Risk %) ÷ (Entry Price − Stop Loss Price). Example: ₹2,00,000 account, 1% risk = ₹2,000, stop loss distance ₹40 → buy 50 shares.
Published March 8, 2026 · Last refreshed April 27, 2026. Prices and data are compiled with reasonable care but — always confirm against your broker before trading.
Introduction: The Skill That Separates Winners From Losers
If you’ve read our guide to risk management basics, you already know that protecting your capital is everything. But knowing you should protect your capital and actually protecting it are two different things. The bridge between these two is position sizing.
Here’s the uncomfortable truth: Most traders get position sizing wrong. They buy 500 shares of Reliance on one trade, 100 shares on another, 1,000 on the next. No logic. No plan. Just “feels right” or “can afford it.” This is how traders blow up accounts.
The hardest part of trading isn’t predicting where the market will go. The hardest part is deciding how much to buy or sell on any single trade. Get this wrong, and you can be right 60% of the time and still lose money. Get this right, and you can be right 50% of the time and become profitable.
Key Takeaways
- Position sizing removes emotion from trade entry — it gives you the exact number of shares to buy based on math
- Core Formula: Position Size = (Account × Risk%) ÷ (Entry Price − Stop Loss Price)
- Three methods covered: Fixed Percentage (safest for beginners), ATR-based (adjusts for volatility), Kelly Criterion (advanced)
- Futures sizing uses lot-based calculation: Lots = Risk Amount ÷ (Stop Loss Points × Lot Size)
- Options sizing caps risk at the premium paid — never buy more than 2% of account in options premium
- ATR-based sizing automatically reduces position size in volatile markets and increases it in calm ones
Position sizing is the single most important skill that separates professional traders from gamblers. A professional trader with an average 45% win rate can outperform a lucky trader with 70% win rate simply through better position sizing. This article teaches you exactly how to calculate the right trade size every single time.
Why is this so critical? Because your position size directly controls your risk per trade. And your risk per trade directly controls whether you survive market downturns or get wiped out. You’ll learn three different position sizing methods in this article—each suited to different market conditions and trading styles. By the end, you’ll have a simple formula you can use before entering any trade.
The goal isn’t to get rich on a single trade. The goal is to stay in the game long enough to compound your wins over months and years. Position sizing is how you do that.
What Is Position Sizing? (The Core Definition)
Position sizing is the practice of calculating how many shares, contracts, or lots you should buy or sell in a single trade based on your account size, risk tolerance, and stop loss distance.
Think of it like this: If you’re running a ₹5,00,000 trading account and you’re willing to risk a maximum of ₹5,000 per trade, and your stop loss is 100 pips away, then your position size is dictated by math—not emotion, not “how much you can afford,” not how confident you feel about the trade.
Position sizing removes emotion from trade entry. It’s your autopilot for risk.
Position sizing is not about maximizing profit on a single trade. It’s about maximizing the long-term health of your trading account.
When you understand position sizing, you stop asking “How many shares can I buy?” You start asking “Based on my risk and stop loss, how many shares should I buy?” The second question is what separates traders who last from traders who burn out.
Section 1: The Position Sizing Formula (The Foundation)

The simplest and most powerful formula for position sizing is:
Position Size = Risk Amount ÷ Stop Loss Distance (in rupees)
Let’s break this down:
- Risk Amount: The maximum rupees you’re willing to lose on this trade
- Stop Loss Distance: The rupee distance between your entry price and stop loss price
- Position Size: The number of shares you can buy while respecting both constraints
What Does This Mean?
This formula ensures that regardless of how far your stop loss is, your maximum loss is always the same. If your stop loss is tight (close to entry), you can buy more shares. If your stop loss is wide (far from entry), you can buy fewer shares. The math forces you to size down when the setup is uncertain and size up when the setup is tight.
Step-by-Step Calculation
Step 1: Decide your risk per trade. Most traders use 1-2% of their total account. If your account is ₹5,00,000 and you risk 1%, then your risk amount is ₹5,000.
Step 2: Identify your entry price and stop loss price. Let’s say Reliance is trading at ₹2,850 and you’ll exit if it drops to ₹2,800. That’s a stop loss distance of ₹50.
Step 3: Divide risk amount by stop loss distance:
- Position Size = ₹5,000 ÷ ₹50 = 100 shares
Step 4: Check if this position size is feasible. Is 100 shares reasonable given your account size and liquidity? Yes. (Some stocks have minimum lot sizes, especially futures, which we’ll cover later.)
Example: Reliance Trade
Let’s say you have a ₹5,00,000 account:
- Entry Price: ₹2,850
- Stop Loss: ₹2,800 (risk ₹50 per share)
- Risk Amount: ₹5,000 (1% of account)
- Calculation: ₹5,000 ÷ ₹50 = 100 shares
- Capital Required: 100 × ₹2,850 = ₹2,85,000 (57% of account)
- Maximum Loss: ₹5,000 (exactly what you planned)
What This Tells You
This single calculation tells you three things:
- How many shares to buy: 100 shares (not 50, not 200—exactly 100)
- How much capital you’re deploying: ₹2,85,000 (57% of your account)
- Your maximum loss if stopped out: ₹5,000 (the exact amount you decided to risk)
There’s no guesswork. No emotion. Just math.
Trading Rule
Position Size = Risk Amount ÷ Stop Loss Distance. Use this formula before every trade. If the math doesn’t work, don’t take the trade.
Section 2: The 1% Rule and Fixed Percentage Model

Data refreshed Apr 19, 2026 · Source: NSE (daily OHLC)
The 1% rule is the most popular way to set your risk amount. It says: Never risk more than 1% of your total account on a single trade.
Why 1%? Because if you lose 1% on 10 consecutive losses, your account only drops 10% total. You can survive long losing streaks. But if you risk 5% per trade and lose 5 trades in a row, you’re down 25%. That’s much harder to recover from.
The Math Behind 1% Rule
- Account Size: ₹5,00,000
- Risk Per Trade: 1% = ₹5,000
- Loss Limit: You can take 20 consecutive losses before your account hits ₹4,00,000 (80% of original)
Compare this to a 5% rule:
- Risk Per Trade: 5% = ₹25,000
- Loss Limit: You can take only 4 consecutive losses before your account drops significantly
The 1% rule is conservative, but it’s conservative for a reason: it lets you stay in the game.
Example 1: TCS at ₹3,600
Let’s work through a detailed TCS trade on a ₹5,00,000 account:
Setup:
- Account Size: ₹5,00,000
- Risk Per Trade: 1% = ₹5,000 (max loss you’ll accept)
- Entry Price: ₹3,600
- Stop Loss Price: ₹3,550
- Risk Per Share: ₹3,600 − ₹3,550 = ₹50
Calculation:
- Position Size = ₹5,000 ÷ ₹50 = 100 shares
- Capital Deployed: 100 × ₹3,600 = ₹3,60,000
- Percent of Account Used: ₹3,60,000 ÷ ₹5,00,000 = 72%
- Maximum Loss If Stopped: 100 × ₹50 = ₹5,000 ✓ (exactly 1%)
Profit Scenarios (if you exit without stop loss):
- If TCS rises to ₹3,700: Profit = 100 × (₹3,700 − ₹3,600) = ₹10,000 (2% gain)
- If TCS rises to ₹3,750: Profit = 100 × (₹3,750 − ₹3,600) = ₹15,000 (3% gain)
- If TCS rises to ₹3,850: Profit = 100 × (₹3,850 − ₹3,600) = ₹25,000 (5% gain)
What This Tells You
From this single trade, you learn:
- You’re risking exactly ₹5,000 — no more, no less
- Your potential profit could be ₹10,000-₹25,000 — but you don’t know until it happens
- Your reward-to-risk ratio is 2:1 to 5:1 — much better than even money
- 72% of capital is deployed — leaving 28% for other trades or emergencies
Example 2: HDFC Bank at ₹1,720
Same account, different stock. Notice how position size adjusts:
Setup:
- Account Size: ₹5,00,000 (same)
- Risk Per Trade: 1% = ₹5,000 (always the same)
- Entry Price: ₹1,720
- Stop Loss Price: ₹1,620
- Risk Per Share: ₹1,720 − ₹1,620 = ₹100
Calculation:
- Position Size = ₹5,000 ÷ ₹100 = 50 shares (half of TCS trade!)
- Capital Deployed: 50 × ₹1,720 = ₹86,000
- Percent of Account Used: ₹86,000 ÷ ₹5,00,000 = 17.2%
- Maximum Loss If Stopped: 50 × ₹100 = ₹5,000 ✓ (same 1%)
Why Fewer Shares? The stop loss is ₹100 away (vs. ₹50 on TCS), so you can afford fewer shares to keep total risk at ₹5,000.
What This Tells You
Compare these two trades side-by-side:
| Metric | TCS Trade | HDFC Trade |
|---|---|---|
| Entry Price | ₹3,600 | ₹1,720 |
| Shares Bought | 100 | 50 |
| Capital Deployed | ₹3,60,000 | ₹86,000 |
| Stop Loss Distance | ₹50 | ₹100 |
| Maximum Loss | ₹5,000 | ₹5,000 |
| Percent of Account | 72% | 17% |
The big lesson: Position size is NOT about how many shares you buy. It’s about how much risk you’re taking. The formula keeps your risk constant, not your share count.
Example 3: Reliance on a Smaller Account
What if you only have ₹2,00,000 to start? Let’s see how position sizing scales:
Setup:
- Account Size: ₹2,00,000 (small account)
- Risk Per Trade: 1% = ₹2,000 (smaller risk amount)
- Entry Price: ₹2,850
- Stop Loss Price: ₹2,800
- Risk Per Share: ₹50
Calculation:
- Position Size = ₹2,000 ÷ ₹50 = 40 shares
- Capital Deployed: 40 × ₹2,850 = ₹1,14,000
- Percent of Account Used: ₹1,14,000 ÷ ₹2,00,000 = 57%
- Maximum Loss: 40 × ₹50 = ₹2,000 ✓
With a smaller account, you still maintain 1% risk, but you trade fewer shares. This is honest position sizing — you’re not pretending to be a bigger trader than you are.
Trading Rule
Risk 1% of your account per trade. If you can’t maintain 1%, you’re either overleveraging or trading with money you can’t afford to lose.
Section 3: Fixed Ratio and Volatility-Based Sizing (Using ATR)

The 1% rule works, but it’s static. It doesn’t account for market volatility. Some stocks are calm and predictable. Others are wild and unpredictable. Shouldn’t you size differently?
Volatility-based sizing adjusts your position size based on how much the stock moves. The most popular tool is the Average True Range (ATR).
Read our full ATR guide for details, but here’s the quick version: ATR measures how much a stock typically moves per candle. High ATR = volatile stock. Low ATR = calm stock.
The ATR-Based Approach
Instead of a fixed stop loss distance, you set your stop loss based on ATR:
Stop Loss Distance = 1.5 × ATR (or 2 × ATR for more aggressive sizing)
Then use the same position sizing formula. This way, your stop loss adapts to how volatile the market is on that day.
Example 1: Reliance in Calm Market (ATR = ₹30)
Let’s say Reliance has:
- Current Price: ₹2,850
- ATR (20-period): ₹30 (stock moves ₹30 per candle on average—calm)
Setup 1: Conservative (2 × ATR)
- Stop Loss Distance: 2 × ₹30 = ₹60
- Risk Amount: ₹5,000 (1% of ₹5,00,000 account)
- Position Size: ₹5,000 ÷ ₹60 = 83 shares
- Capital Deployed: 83 × ₹2,850 = ₹2,36,550
- Actual Risk Taken: 83 × ₹60 = ₹4,980 ≈ 1% ✓
Setup 2: Aggressive (1.5 × ATR)
- Stop Loss Distance: 1.5 × ₹30 = ₹45
- Risk Amount: ₹5,000
- Position Size: ₹5,000 ÷ ₹45 = 111 shares
- Capital Deployed: 111 × ₹2,850 = ₹3,16,350
- Actual Risk Taken: 111 × ₹45 = ₹4,995 ≈ 1% ✓
Example 2: Reliance During Volatile Market (ATR = ₹80)
Same account, same stock, but market is volatile:
- Current Price: ₹2,850
- ATR (20-period): ₹80 (stock moves ₹80 per candle—chaotic)
Setup 1: Conservative (2 × ATR)
- Stop Loss Distance: 2 × ₹80 = ₹160
- Risk Amount: ₹5,000
- Position Size: ₹5,000 ÷ ₹160 = 31 shares (much smaller!)
- Capital Deployed: 31 × ₹2,850 = ₹88,350
Compare to calm market: You buy 83 shares in calm market, but only 31 shares in volatile market. Same risk, different position sizes.
Why? In volatile markets, your stop loss gets hit by random noise, not by actual trend reversals. Smaller positions protect you.
Example 3: Bank Nifty (Futures) With ATR
Let’s apply ATR-based sizing to Bank Nifty futures:
Setup:
- Current Price: ₹47,500
- ATR (20-period): ₹500 (futures move big!)
- Account: ₹5,00,000
Conservative Sizing (2 × ATR):
- Stop Loss Distance: 2 × ₹500 = ₹1,000
- Risk Amount: ₹5,000
- Contracts Needed: ₹5,000 ÷ ₹1,000 = 5 contracts
- Bank Nifty Lot Size: 30 contracts (can’t trade 5)
- Decision: Reduce risk to ₹7,500 or skip the trade
Aggressive Sizing (1.5 × ATR):
- Stop Loss Distance: 1.5 × ₹500 = ₹750
- Risk Amount: ₹5,000
- Contracts Needed: ₹5,000 ÷ ₹750 = 6.67 contracts
- Decision: Round to 0 lots or adjust risk
This is where lot sizes create complexity. ATR-based sizing is great for stocks, but futures trading requires careful lot size alignment.
What This Tells You
Volatility-based sizing teaches three critical lessons:
- Calm markets allow tighter stops: When ATR is low (₹30), you can place stops ₹60 away
- Volatile markets require wider stops: When ATR is high (₹80), you must place stops ₹160 away
- Your position size automatically shrinks in chaos: Same 1% risk, but fewer shares = safety
This is advanced position sizing for traders who’ve been trading at least 3-6 months and understand ATR calculation.
Trading Rule
In high volatility, increase stop loss distance and decrease position size. In low volatility, decrease stop loss distance and increase position size. Always match your position to market conditions.
Section 4: Position Sizing for Futures & Options (NSE Lot Sizes)

Stock trading is straightforward: position size = number of shares. But futures and options have mandatory lot sizes, which changes the calculation.
NSE Lot Sizes (As of 2026)
- Nifty 50 Futures: 1 lot = 25 contracts
- Bank Nifty Futures: 1 lot = 15 contracts
- Reliance Futures: 1 lot = 1 contract (but margin requirements apply)
- Nifty Options: 1 lot = 25 contracts
You can’t buy 10 Nifty contracts. You can only buy 1 lot (65 contracts) or multiples of 25. This is what makes futures position sizing tricky.
Example 1: Nifty 50 Futures (Lot Size Mismatch)
Let’s say you have a ₹5,00,000 account and want to trade Nifty:
Given:
- Nifty Price: ₹22,500
- Entry Price: ₹22,500
- Stop Loss: ₹22,000 (₹500 risk per contract)
- Risk Amount: ₹5,000 (1% of account)
Calculation:
- Number of contracts needed: ₹5,000 ÷ ₹500 = 10 contracts
- But Nifty lot size = 65 contracts (you can’t trade 10!)
- Option 1: Buy 1 lot (65 contracts) → Actual Risk = 25 × ₹500 = ₹12,500 (2.5% of account—too high!)
- Option 2: Reduce risk amount to fit exactly: ₹5,000 ÷ 25 contracts = ₹200 per contract (new stop loss = ₹22,300)
- Option 3: Skip this trade and wait for a setup with a tighter stop loss
Most professionals choose Option 2 — adjust the risk amount to match lot sizes exactly, maintaining 1% discipline.
Better Calculation (Reverse Method):
- Account: ₹5,00,000
- Risk: 1% = ₹5,000
- Nifty Lot Size: 25 contracts (fixed)
- Risk per Contract: ₹5,000 ÷ 25 = ₹200
- Entry: ₹22,500
- Allowable Stop Loss: ₹22,500 − ₹200 = ₹22,300
What This Tells You
Futures trading forces you to think differently:
- Lot size is non-negotiable — you can’t buy 10 contracts; you buy 0 or 25
- Work backward from lot size — decide position size first, then calculate acceptable stop loss
- Accept tighter stops on small accounts — a ₹5,00,000 account risking 1% on Nifty must accept ₹200 per contract risk
- Larger accounts have more flexibility — a ₹50,00,000 account risks ₹50,000, allowing ₹2,000 per contract (wider stops)
Example 2: Bank Nifty Futures (Lot Size 15)
Same account, different index:
Given:
- Bank Nifty Price: ₹47,500
- Entry Price: ₹47,500
- Stop Loss: ₹47,000 (₹500 risk per contract)
- Risk Amount: ₹5,000 (1%)
- Bank Nifty Lot Size: 30 contracts
Calculation:
- Contracts needed: ₹5,000 ÷ ₹500 = 10 contracts
- But Bank Nifty lot = 30, so you must trade 15 or 0
- Risk per contract for 15 contracts: ₹5,000 ÷ 15 = ₹333
- New stop loss: ₹47,500 − ₹333 = ₹47,167
Example 3: Options — Buying Nifty Call Options
Options are different because you’re buying/selling premiums, not direct contracts. Let’s buy Nifty calls:
Given:
- Nifty Call Strike: ₹23,000
- Premium (current): ₹150 per contract
- Risk Amount: ₹5,000 (entire premium you’ll lose)
- Nifty Lot Size: 25 contracts
Calculation:
- Contracts: ₹5,000 ÷ ₹150 = 33.3 contracts
- But Nifty lot = 65, so round down to 1 lot
- Actual Position: 1 lot = 25 contracts
- Actual Cost: 25 × ₹150 = ₹3,750 (less than budgeted ₹5,000)
- Maximum Loss: ₹3,750 (if option expires worthless)
This is better—you spend less than planned, keeping risk below 1%.
Alternative (2 Lots):
- Position: 2 lots = 50 contracts
- Actual Cost: 50 × ₹150 = ₹7,500 (exceeds budget!)
- Maximum Loss: ₹7,500 (1.5% of account—too high)
- Decision: Only buy 1 lot to stay disciplined
Example 4: Options — Selling Iron Condor
Selling options is trickier because your loss is not the premium received, but potential loss if the market moves against you:
Given:
- Account: ₹5,00,000
- Iron Condor (1 lot = 25 contracts)
- Risk Amount: ₹5,000 (1%)
- Max Loss Per Lot: ₹500 (width of spread × contracts)
Calculation:
- Number of lots: ₹5,000 ÷ ₹500 = 10 lots
- Position: 10 lots = 250 contracts
- Maximum Loss: 10 × ₹500 = ₹5,000 ✓
This requires discipline and margin capital, but the math is clear.
What This Tells You
Options position sizing depends on whether you’re buying or selling:
- Buying: Risk = premium paid (usually less than budget)
- Selling: Risk = max loss of spread (often equals budget exactly)
- Lot sizes still apply: Nifty = 65, Bank Nifty = 30
Trading Rule
For futures, calculate backward from lot size: Risk ÷ Lot Size = Risk Per Contract. For options, choose between buying (limited risk) and selling (defined max loss). Always ensure actual position size matches NSE lot size rules.
Section 5: Platform Setup and Tools (Zerodha, TradingView, Angel One)

The math is simple, but using tools speeds up the process. Here’s how to set up position sizing on popular platforms:
Zerodha Kite (Step-by-Step)
Zerodha Kite doesn’t have a built-in position sizing calculator, but here’s the fastest workflow:
Method 1: Using Basket Orders (Pre-calculation)
- Open Zerodha Kite → Click “Basket” in the top menu
- Add order → Select stock (e.g., Reliance)
- Enter Entry Price: ₹2,850
- Enter Stop Loss: ₹2,800
- Open your calculator (phone calculator or spreadsheet)
- Calculate: ₹5,000 (risk) ÷ ₹50 (stop distance) = 100 shares
- Back to Kite, enter Quantity: 100
- Save this order in basket
- Place the order when ready
Method 2: Using GTT (Good Till Triggered)
- Go to your Holdings → Find the stock you want to buy
- Click “Set Alert” → “GTT”
- Set trigger price (where you want to buy): ₹2,850
- Under “Order,” set:
– Quantity: 100
– Order Type: Limit
– Price: ₹2,850
– Stop Loss: ₹2,800
- GTT will automatically place this order when triggered
Method 3: Using Google Sheets (Best for Active Traders)
- Create a Google Sheet with columns:
– Account Size
– Risk %
– Risk Amount (= Account Size × Risk %)
– Entry Price
– Stop Loss Price
– Risk per Share (= Entry − Stop Loss)
– Position Size (= Risk Amount ÷ Risk per Share)
- Fill in Entry and Stop Loss before each trade
- Position Size calculates automatically
- Copy your calculated position size into Kite
- Keep this sheet open during trading hours
TradingView (Step-by-Step)
TradingView has the easiest position size calculator for technical traders:
Step 1: Open a Chart
- Go to TradingView.com
- Search for a stock (e.g., “NSE:RELIANCE”)
- Open the 1D or 4H chart
Step 2: Access Position Size Calculator
- Click the “📊 Indicators” button (or press Ctrl+I)
- Search for “Position Size Calculator”
- Click “Add to Chart”
Step 3: Configure Settings
- The calculator appears on your chart (usually top-right)
- Click on it to open settings
- Fill in:
– Account Size: ₹500000
– Risk %: 1
– Entry Price: 2850 (click on chart to auto-fill)
– Stop Loss Price: 2800 (click on chart to auto-fill)
- TradingView displays:
– Contracts to buy
– Position size in rupees
– Maximum loss
– Risk-reward ratio
Step 4: Copy to Your Broker
- Note the position size (e.g., 100 shares)
- Switch to Zerodha Kite
- Enter the same position size
- Execute trade
This is the fastest method for swing traders who spend time analyzing charts.
Angel One (Step-by-Step)
Angel One (Broking) has a built-in position sizing calculator in their app:
Step 1: Open the Calculator
- Open Angel One app
- Tap the “Tools” menu (usually at bottom)
- Look for “Position Size Calculator” or “Risk Calculator”
- Tap to open
Step 2: Enter Trade Details
- Select Stock: Search “Reliance” and select
- Enter Entry Price: ₹2,850
- Enter Stop Loss: ₹2,800
- Risk Amount (₹): ₹5,000
- Tap “Calculate”
Step 3: Review Results
Angel One displays:
- Number of shares to buy
- Total capital required
- Maximum loss if stopped
- Expected profit at different targets
Step 4: Execute Trade
- Go back to trading screen
- Buy the exact quantity calculator suggested
- Set stop loss immediately using “GTT” or “Bracket Order”
DIY Google Sheets Template (Most Flexible)
For traders who want maximum control and want to track all trades, build a simple spreadsheet:
Setup:
- Create a new Google Sheet
- Add these columns: Date | Stock | Account Size | Risk % | Risk Amount | Entry | Stop Loss | Risk/Share | Position Size | Capital Used | Max Loss
Formulas:
- Risk Amount:
=C2 * D2(Account Size × Risk %) - Risk/Share:
=E2 - F2(Entry − Stop Loss) - Position Size:
=C2 / G2(Risk Amount ÷ Risk per Share) - Capital Used:
=E2 * H2(Entry × Position Size) - Max Loss:
=H2 * G2(Position Size × Risk per Share)
Example Row:
| Date | Stock | Account | Risk % | Risk ₹ | Entry | Stop | Risk/Share | Position | Capital | Max Loss |
|---|---|---|---|---|---|---|---|---|---|---|
| 3/7/26 | Reliance | 500000 | 1% | 5000 | 2850 | 2800 | 50 | 100 | 285000 | 5000 |
| 3/7/26 | TCS | 500000 | 1% | 5000 | 3600 | 3550 | 50 | 100 | 360000 | 5000 |
| 3/8/26 | HDFC Bank | 500000 | 1% | 5000 | 1720 | 1620 | 100 | 50 | 86000 | 5000 |
Keep this sheet open in another tab during trading. Before every trade, enter the stock name, entry, and stop loss. Position size calculates automatically.
Groww App (Beginner-Friendly)
Groww’s app has a simple position sizing feature built into their trading module:
Steps:
- Open Groww app
- Tap “Trade”
- Select a stock
- Under “Advanced Options,” find “Position Size”
- Enter your account size and risk %
- Enter entry and stop loss prices
- App calculates shares automatically
- Buy directly from app
This is ideal for beginners who want to avoid external tools.
Section 6: Advanced Context—Kelly Criterion and Scaling
Once you’ve mastered basic position sizing, you might encounter two advanced concepts: Kelly Criterion and scaling in/out.
The Kelly Criterion (Simplified)
The Kelly Criterion is a mathematical formula that calculates the optimal position size based on your win rate and risk-reward ratio:
Kelly % = (Win Rate × Average Win) − (Loss Rate × Average Loss)
This is complex, and most traders don’t use it perfectly. But the principle is valuable: Traders with high win rates can size bigger; traders with low win rates should size smaller.
A trader with 65% win rate might risk 2% per trade. A trader with 40% win rate should stick to 0.5-1%.
Track your actual win rate and adjust accordingly.
Scaling In and Pyramiding
Scaling in means buying more shares as the trade moves in your favor. Instead of buying 100 shares all at once, you buy 30, then 30 more if it hits a certain level, then 40 more.
Rules for Scaling In:
- Never let your total position size exceed the original risk plan
- Add to winners, not losers (add after breakouts, not after losses)
- Each addition should have its own stop loss
Example:
- Trade 1: Buy 30 shares at ₹2,850 (stop at ₹2,800)
- Trade 2: Buy 30 more at ₹2,870 (stop at ₹2,820)
- Trade 3: Buy 40 more at ₹2,900 (stop at ₹2,850)
- Total: 100 shares with average entry ₹2,873
The advantage: You’re buying more only when the trade is working, reducing risk.
Section 7: Five Position Sizing Rules Every Trader Must Follow
- Never Risk More Than 1% Per Trade. This rule protects your account from catastrophic loss. Even if you lose 10 trades in a row, you only lose 10% of capital.
- Position Size = Risk Amount ÷ Stop Loss Distance. Use this formula before every single trade. No exceptions. No gut feelings.
- Account Size Matters. A ₹5,00,000 account and a ₹50,00,000 account need different position sizes. Adjust your risk amount based on your actual capital.
- Adjust for Volatility. Use ATR or other volatility measures. Size down in high volatility, size up in low volatility.
- Futures and Options Have Lot Sizes. You can’t trade 10 Nifty contracts (lot size 25) or 5 Bank Nifty contracts (lot size 15). Adjust your risk amount or skip the trade.
Section 8: Position Sizing Checklist
Before entering any trade, answer these five questions:
- [ ] What is my total account size? (e.g., ₹5,00,000)
- [ ] How much am I risking on this trade? (usually 1% = ₹5,000)
- [ ] What is my entry price and stop loss price? (e.g., entry ₹2,850, stop ₹2,800)
- [ ] What is the risk per share/contract? (₹50)
- [ ] How many shares/contracts should I buy? (₹5,000 ÷ ₹50 = 100 shares)
If you can’t answer all five clearly, don’t take the trade.
Section 9: Five Common Position Sizing Mistakes (And How to Avoid Them)
Mistake 1: Sizing Based on Confidence
The Error: “I’m very confident in this trade, so I’ll buy 500 shares instead of 100.”
Why This Fails: Confidence is not a risk metric. Even your best setups fail sometimes. The market doesn’t care how sure you are.
Here’s the hard truth: Your most confident trades fail. Your uncertain trades sometimes work. Position sizing should be mechanical, not emotional. If you size bigger on confident trades, you’ll eventually take a massive loss on a trade you were “sure about.”
Example: You’re 90% confident Reliance will break above ₹2,900. You buy 200 shares instead of 100. Reliance drops to ₹2,800, and you lose ₹20,000 instead of ₹10,000. And guess what? That ₹10,000 loss would have stung less than the ₹20,000 one.
How to Avoid:
- Use the formula every single time — no exceptions, even when “sure”
- Write down your position size before entering any trade (forces accountability)
- Review past trades where you sized bigger and ask: did confidence correlate with better results? (Spoiler: it doesn’t)
- Remind yourself: Professional traders size the same on high-confidence and low-confidence setups
Mistake 2: Keeping the Same Position Size for All Stocks
The Error: You decide to buy 100 shares of every stock, regardless of price or stop loss.
Some stocks trade at ₹100. Some at ₹5,000. If you mechanically buy 100 shares of both:
- Stock A (₹100): 100 shares = ₹10,000 capital, maybe ₹500 risk
- Stock B (₹5,000): 100 shares = ₹5,00,000 capital, maybe ₹50,000 risk
Why This Fails: You risk 0.5% on one trade and 10% on another—no consistency. This is how you accidentally blow up.
Example: A trader decides “I’ll always buy 100 shares.” With Reliance at ₹2,850 and a ₹50 stop loss, 100 shares = ₹5,000 risk (1%). But with Infosys at ₹6,000 and a ₹200 stop loss, 100 shares = ₹20,000 risk (4%). Same trade size, different risk levels.
How to Avoid:
- Always calculate position size based on stop loss distance, never share count
- Create a pre-trade checklist with these fields:
– Entry Price
– Stop Loss Price
– Risk per Share
– Position Size (calculated)
– Max Loss (verified against 1% rule)
- Never skip the math — even if it’s the same stock you traded last week
Mistake 3: Ignoring Lot Size Rules
The Error: You calculate that you should trade 10 Nifty contracts. But Nifty lot size is 25. So you trade 1 lot (65 contracts) anyway.
Why This Fails:
- Planned position: 10 contracts × ₹500 risk = ₹5,000 (1%)
- Actual position: 25 contracts × ₹500 risk = ₹12,500 (2.5%)
You think you’re risking 1%, but you’re actually risking 2.5% — 2.5X your plan.
Example: A trader on a ₹5,00,000 account plans to risk ₹5,000 on Bank Nifty. They calculate 10 contracts needed. But Bank Nifty lot size = 15. They trade 15 anyway because “close enough.” Now they’re risking ₹7,500 instead of ₹5,000. After just 3 losses, they’ve lost ₹22,500 instead of the planned ₹15,000.
How to Avoid:
- Check lot size BEFORE calculating position size
- Work backward from lot size: Risk Amount ÷ Lot Size = Risk per Contract (not the other way around)
- Three acceptable options if lot size doesn’t fit:
– Adjust risk amount to match exactly
– Reduce position to 0 lots and wait for a better setup
– Skip the trade entirely
- NEVER force a position to fit a lot size
Mistake 4: Not Adjusting for Volatility
The Error: You size the same on a calm market day as on a chaotic earnings announcement day.
Example: Reliance ATR on a calm day = ₹30. Reliance ATR on a volatile day = ₹100. You place stops the same distance on both days.
Why This Fails: On volatile days, your stop gets hit by noise (random price spikes), not by actual trend reversal. You get whipsawed—stopped out by a spike, then the stock moves in your direction. This happens repeatedly, draining your account through small stops that shouldn’t have been hit.
Example: You set a stop loss ₹50 away on Reliance when volatility is high (ATR = ₹100). The stock hits your stop (losing ₹5,000), then immediately bounces back ₹100 higher. You missed a ₹10,000 winner. This happens 3 times in a week. Account is down ₹15,000 due to noise, not bad analysis.
How to Avoid:
- Calculate ATR before entering every trade
- Use ATR-based stops: Stop Loss Distance = 2 × ATR (conservative) or 1.5 × ATR (aggressive)
- Adjust position size accordingly: Higher ATR → wider stop → smaller position
- Keep a volatility checklist:
– Low ATR (<30): Can use tight stops, larger positions
– Medium ATR (30-60): Standard 1% stops, standard positions
– High ATR (>60): Must use wide stops, smaller positions
- Review past losses: Did most come on high-ATR days? If yes, your stops are too tight
Mistake 5: Changing Position Size Mid-Trade
The Error: You enter 100 shares at ₹2,850. After 10 minutes, the stock is up ₹50 (position +₹5,000). You buy 100 MORE shares at ₹2,900. Or after 10 minutes, it’s down ₹20 (position −₹2,000). You sell 50 shares to “reduce loss.”
Why This Fails: This is emotional trading, not position management. You’re adding to winners on impulse and cutting losers on fear. This destroys the discipline you set up pre-trade.
Example:
- You enter 100 Reliance at ₹2,850 (plan to hold for swing trade)
- Trade is up ₹100 after 1 hour
- You get excited: “This is working! I’ll buy 50 more!”
- Now you have 150 shares instead of 100
- Trade reverses and hits your original ₹2,800 stop
- You lose on 150 shares instead of 100
- Total loss: ₹7,500 instead of ₹5,000
How to Avoid:
- Plan scaling BEFORE entry:
– “I’ll scale in ONLY if the stock breaks key resistance”
– “I’ll scale OUT ONLY if I hit my profit target”
- Write down your scaling plan (where you’ll add/reduce, how many shares per scale)
- Don’t change it mid-trade — follow the written plan or do nothing
- Set alerts, not manual checks: Don’t stare at the chart waiting for an excuse to add/subtract
- Scaling rule: Never let total position size exceed what you calculated pre-trade
Section 10: Comparing Position Sizing Methods
| Method | Best For | Pros | Cons |
|---|---|---|---|
| 1% Fixed Rule | Beginners | Simple, safe, consistent | Doesn’t account for volatility |
| Volatility-Based (ATR) | Swing traders | Adapts to market conditions | Requires ATR calculation |
| Kelly Criterion | Professional traders | Mathematically optimal | Complex, needs win rate data |
| Fixed Ratio | Long-term accounts | Grows position with account | Needs careful monitoring |
| Options Greeks | Options traders | Accounts for theta decay | Very complex, requires training |
Our Recommendation for Most Traders: Start with 1% fixed rule for 3 months. Then move to volatility-based sizing.
Section 12: Your Next Step
You now understand position sizing—the foundation of risk management. But position sizing is only step 1. Step 2 is where exactly to place your stop loss.
Read our complete guide to stop loss strategies to learn:
- Exact stop loss placement methods (support/resistance, ATR bands, etc.)
- How to avoid being stopped out by noise
- When to move stops and when to keep them fixed
- examples with NSE stocks
Position sizing + proper stops = the two pillars of survival trading.
Key Takeaways
- Position Sizing Formula: Risk Amount ÷ Stop Loss Distance = Position Size
- Risk 1% per trade to survive long losing streaks
- Volatility-based sizing (ATR) is better than fixed sizing
- Futures and options have lot sizes—adjust accordingly
- Position size is mechanical, not emotional
- Track your win rate and adjust risk percentage accordingly
Position sizing is boring. It’s mechanical. It’s unglamorous. But it’s the difference between becoming a professional trader and blowing up your account.
Start using the position sizing formula on your next 10 trades. Don’t skip it. Don’t shortcut it. Make it mechanical. After 10 trades, it becomes habit. After 50 trades, you’ll be shocked how many times this formula saves you from overleveraging.
That’s the power of position sizing.
Risk Disclaimer
This article is educational content about position sizing principles used in trading. Position sizing is a risk management technique and does not guarantee profits or prevent losses. All trading involves risk of loss. Past performance does not indicate future results.
Always consult with a financial advisor before trading with real capital. The examples and formulas in this article are for educational purposes only. SEBI does not guarantee returns on any investment or trading activity. Trade at your own risk with capital you can afford to lose.
For more information, see our disclaimer page.
I traded full lot sizes for a year before I learnt the math: a 2% account loss per trade survives a long losing streak; 10% per trade does not. Position sizing is the line.
Should I risk more if my win rate is 70%?
Yes, but only after you’ve proven it over 50+ trades, and only gradually. Here’s the timeline: – First 20 trades: Stick to 1% risk. You’re building a track record. – Trades 20-50: If your win rate is genuinely 65%+, increase to 1.25-1.5% risk on your highest-conviction setups only. – Trades 50+: If still 65%+, you can safely move to 1.5-2% on your best setups. Why the caution? Many traders have a 70% win rate on 10 trades just by luck. Then they increase position size, and the next 30 trades are 40% wins. Their larger positions on “bad luck” trades wipe out previous gains. Also, higher win rat
What if I can’t achieve the exact position size due to lot sizes?
You have three options (in order of preference): Option 1 (Best): Adjust your risk amount — Work backward from lot size. – Your calculation: 10 contracts needed – Nifty lot size: 65 – New calculation: ₹5,000 ÷ 25 contracts = ₹200 per contract risk – New stop loss: Entry − ₹200 – Maintain 1% discipline with a tighter stop loss Option 2: Reduce position to 0 lots — Skip the trade entirely if the math doesn’t work. This preserves your 1% rule perfectly. Your best trades will come again. Option 3 (Avoid): Scale up to next lot size — You CAN do this, but only if you consciously accept the higher ri
How do I size for intraday trades vs. swing trades?
Same formula, but stop loss distances differ. Here’s the pattern: Intraday trades (hold 1-4 hours): – Tighter stops: ₹20-50 per share (maybe 1 × ATR) – Larger position sizes as a result – Example: ₹5,000 risk ÷ ₹30 stop = 167 shares Swing trades (hold 3-10 days): – Wider stops: ₹50-150 per share (maybe 2 × ATR) – Smaller position sizes – Example: ₹5,000 risk ÷ ₹100 stop = 50 shares Position Ratio: Intraday position ÷ Swing position often equals 2-3X because the stop distance is 2-3X tighter. This is natural and expected. Key: Don’t use intraday position sizing for swing trades (you’ll get whip
Should position size change based on time of day?
Not mechanically from your formula, but volatility changes dramatically by hour, so your stop loss distances should change. NSE Market Hours Volatility Pattern: – 9:15-10:00 AM IST: Very high volatility (market open). ATR is 1.5-2X normal. – 10:00-11:00 AM: High volatility (orders settling). ATR elevated. – 11:00 AM-1:00 PM: Calmer period. ATR drops 20-30%. – 1:00-2:30 PM: Low volatility (siesta period). ATR at minimum. – 2:30-3:30 PM: Moderate volatility (final hour). ATR rises again. What to do: If trading 9:15-10:00 AM, use 2-2.5 × ATR stops (wider). If trading 1:00-2:00 PM, use 1-1.5 × ATR
What happens if I inherit more capital mid-year?
Recalculate your 1% risk immediately. You now have a larger account, so your risk amount increases. Example: – Started with ₹5,00,000 → 1% = ₹5,000 per trade – Inherited ₹25,00,000 → Now have ₹30,00,000 – New 1% = ₹30,000 per trade (6X larger!) Your position sizes will increase significantly. This is good if you’ve been trading profitably—you’re scaling into a bigger account. But it’s dangerous if you haven’t proven your edge. Many traders blow up larger accounts faster because they lose discipline. Safety Rule: After account growth, stay on the original ₹5,000 risk for your first 10 trades wi
Can I use different position sizes for different strategies?
Yes, absolutely. Different strategies have different risk profiles. Here’s a framework: | Strategy | Risk Per Trade | Why | |———-|—————–|—–| | Breakout above support | 1-1.5% | High probability, tight stops | | Trend reversal at support | 0.5-1% | Lower probability, wider stops | | Intraday scalping | 0.25-0.5% | High frequency, small wins/losses | | Earnings gap play | 2-3% | Directional bias, defined risk | | Options selling | 0.5-1% | Time decay helps, margin required | Principle: Riskier setups = smaller position sizes. Your total portfolio risk per day should never exc
Is there a maximum position size?
Yes—usually 50-70% of account per single trade. Here’s why: 1. Margin requirements: You need cash for stops and slippage 2. Multiple positions: You might want 2-3 positions open simultaneously 3. Psychological: Large positions cause stress and poor decisions 4. Liquidity: Selling a 75% position quickly might move the market against you Example: On a ₹5,00,000 account, even if math allows you to buy ₹4,00,000 worth of stock, cap it at ₹2,50,000-₹3,00,000 (50-60%). This keeps ₹1,50,000-₹2,50,000 free for other trades or emergencies. Professional traders often use: Maximum 30% of account per posi
Interactive Tool: Position Size Calculator
Position Size Calculator
Calculate exactly how many shares or lots to trade on every single trade
Trade Parameters
Position Size
F&O Position Sizing
What-If Scenarios
❌ If Stop-Loss Hits
You lose ₹2,000
✔ If Target Hits
You gain ₹4,000
⚠ After 5 Consecutive Losses
Account: ₹90,000
📈 After 3 Wins, 2 Losses
Account: ₹1,08,000
Why the 2% Rule Matters
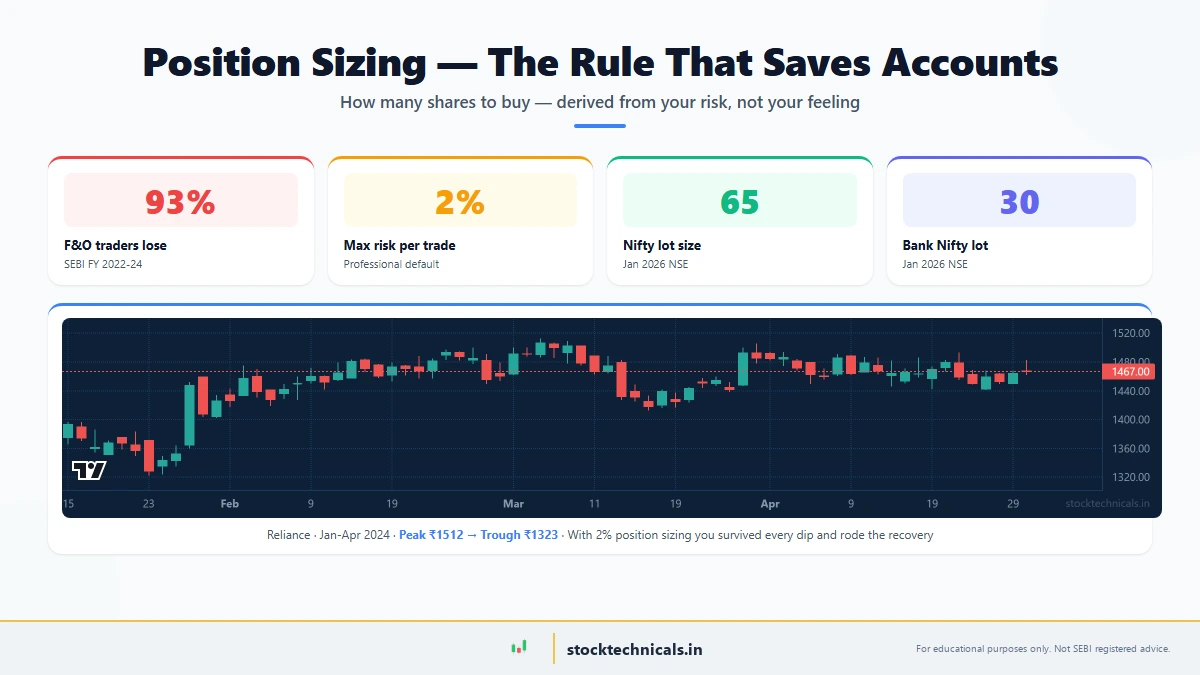
Professional traders never risk more than 1-2% of total capital on any single trade. Here is the math:
With 2% risk per trade, even 10 consecutive losses (rare but possible) reduce the account by only ~18%. The account survives.
With 10% risk per trade, just 5 consecutive losses wipe out ~41% of capital. Recovery becomes nearly impossible.
The 2% rule is not about limiting profits. It is about ensuring survival long enough for an edge to play out over hundreds of trades.
SEBI data: 93% of intraday traders in India lose money. The 7% who survive all practice strict position sizing.
Common Position Sizing Mistakes
CRITICAL Risking too much per trade
Betting 10-20% of capital on one trade feels bold. After 3 losses, the account is down 30-60% and recovery requires 43-150% gains. The math becomes brutal.
COMMON Ignoring STT and charges
Securities Transaction Tax, brokerage, GST, stamp duty, and exchange fees eat into profits. On an intraday trade of 100 shares at ₹2,000, total charges can be ₹50-150.
COMMON Not accounting for slippage
Stop-loss orders often execute 0.1-0.3% worse than the set price, especially in volatile stocks. Factor slippage into position size calculations.
F&O Position size vs lot size confusion
In F&O, position size must be in multiples of the lot size. A calculator saying “buy 37 shares” is useless when Nifty lot size is 25. Always round DOWN to the nearest lot.
F&O Position Sizing
NSE lot sizes (as of 2026): Nifty 50 = 65 units, Bank Nifty = 30 units, FinNifty = 60 units, Midcap Nifty = 50 units.
For F&O, position size must be rounded down to the nearest lot. If the calculator shows 37 units and the lot size is 25, the trader can buy 1 lot (25 units) only.
Margin requirement: SPAN margin + exposure margin. Options buyers pay the full premium. Options sellers need 3-5x the premium as margin. This calculator shows approximate margin for options buyers (full premium cost).
Exact margin varies by broker. Check the margin calculator on Zerodha, Angel One, or Dhan before placing orders.
The Bottom Line
Position sizing is the bridge between knowing risk management and actually practicing it. The formula doesn’t care how confident you feel about a trade. It doesn’t care if the chart looks perfect. It takes your account size, your risk, and your stop loss — and gives you a number. That number is how many shares you buy. No more, no less. Use it on every single trade and position sizing becomes automatic within 30 days.
RISK NOTICE
Technical analysis is a skill, not a guarantee. Every trade carries risk of loss. The SEBI study shows 93% of intraday traders lose money — most without a systematic risk management framework. Never trade money you cannot afford to lose. Stop losses and position sizing are not optional safety nets; they are the foundation of professional trading. This content is for educational purposes only and is not investment advice. Consult a SEBI-registered investment advisor before trading.