The Head and Shoulders pattern is the most widely recognised reversal pattern in technical analysis. Three price peaks, with a higher peak in the middle and two lower peaks on either side, connected by a neckline drawn through the intervening swing lows. When price breaks below the neckline on volume, the pattern is considered confirmed and a decline typically follows. This article covers seven verified Head and Shoulders tops on NSE stocks from 2021 to 2025, each with documented neckline break and follow-through.

Chart window: Feb 2022 – Mar 2023 · Data refreshed April 17, 2026 · Source: NSE (daily OHLC)
Key Takeaways
- Three-peak reversal pattern. Left shoulder, higher head, right shoulder. Neckline connects the intervening swing lows.
- Confirmation = neckline break on volume. Price closing below the neckline with above-average volume confirms the pattern.
- Measured move target: distance from head to neckline, projected DOWN from the neckline.
- Symmetry under 5% between left and right shoulder prices is the strongest filter for pattern quality.
- Inverse H&S is the bullish mirror: head is lowest point, neckline broken UPWARD, target projected UP.
- Sector-leader H&S patterns often signal sector-wide turning points. Multiple H&S across the same sector in 2-6 weeks is an index-level bearish flag.
Head and Shoulders Anatomy
The classic Head and Shoulders top is built from five consecutive turning points on the chart. First, price advances to a peak (the left shoulder) and pulls back to a swing low. Second, price rallies again to a higher peak (the head) and pulls back to another swing low near the level of the previous one. Third, price attempts a final rally but fails to exceed the head, forming a lower peak (the right shoulder). The line drawn through the two intervening swing lows is the neckline.
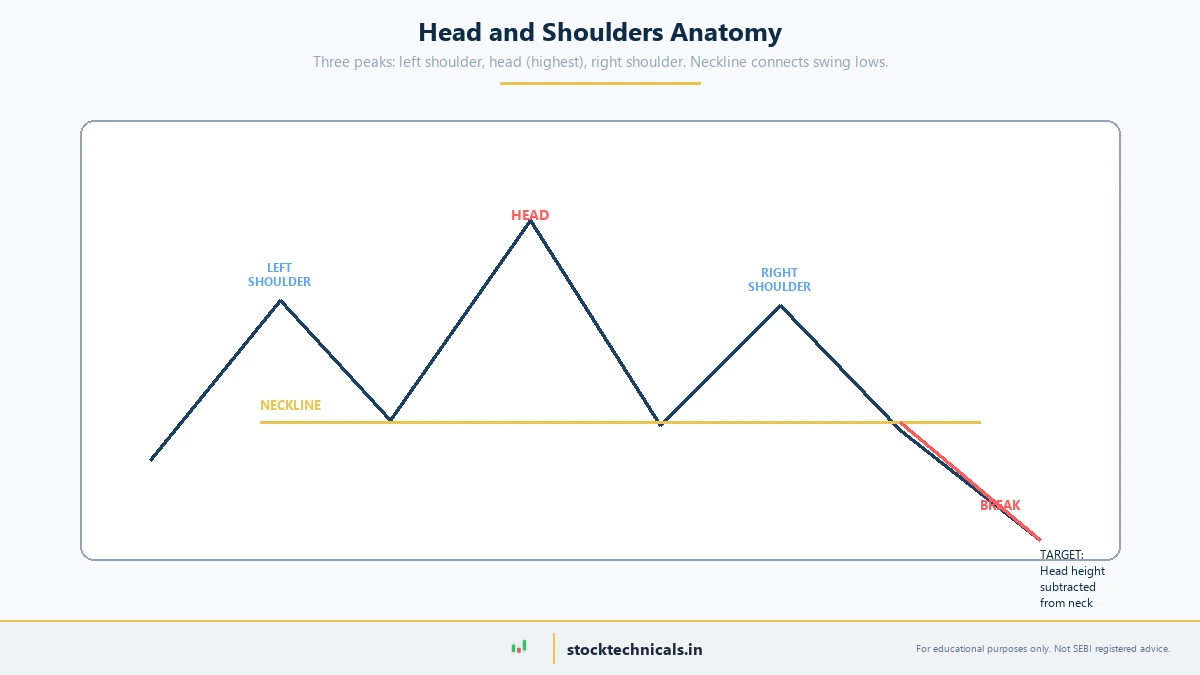
Chart data: Evergreen reference · Last reviewed April 17, 2026
The pattern is only considered complete when price closes below the neckline. Until that break, it remains a forming H&S — a warning, not a signal. The neckline break on volume is what traders act on. Breaking intraday without a confirming daily close is a false break that can trap early shorts.
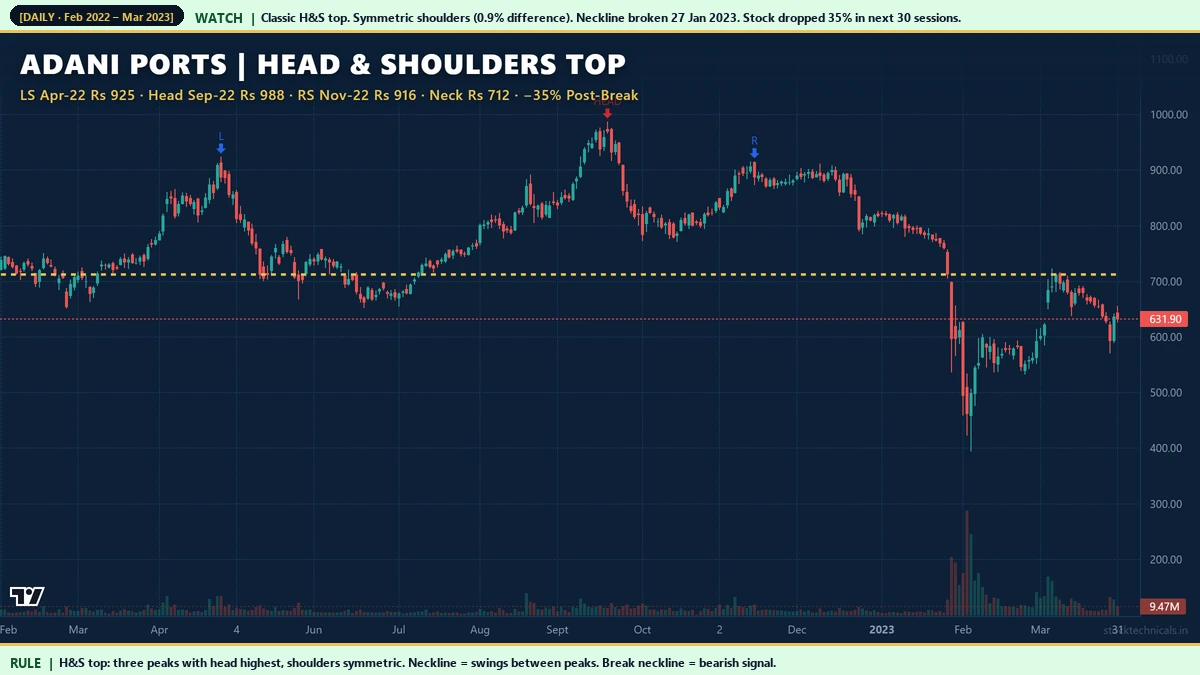
Hero Example: Adani Ports 2022-2023
Three factors made this H&S particularly reliable:
- Near-perfect symmetry: 0.9% shoulder difference is rare. Most H&S patterns have 5-10% shoulder asymmetry.
- Extended formation time: 9 months from left shoulder to neckline break gives plenty of distribution time for institutional selling.
- External catalyst: The Hindenburg report on January 24, 2023 accelerated the breakdown. Most well-formed H&S patterns have some external catalyst that triggers the break.
Tech Mahindra December 2021 H&S

Chart window: Jul 2021 – Jun 2022 · Data refreshed April 17, 2026 · Source: NSE (daily OHLC)
Tech Mahindra’s 2021-2022 H&S formed during the broad exhaustion of the 2020-2021 IT rally. The head was on December 30, 2021 at Rs 1,838. The neckline at Rs 1,345 was broken on April 18, 2022. Over the next 30 sessions the stock declined 21.21%. This pattern appeared on several IT names within weeks of each other — Tech Mahindra, Wipro, HCL Tech, and Infosys (NSE: INFY) all showed some form of topping structure. That kind of sector cluster is a much stronger signal than a single-stock H&S in isolation.
Recent Example: Infosys December 2024

Chart window: May 2024 – Apr 2025 · Data refreshed April 17, 2026 · Source: NSE (daily OHLC)
Infosys printed a clean H&S between July 2024 and February 2025. Left shoulder Rs 1,903, head Rs 2,006, right shoulder Rs 1,924 — just 1.1% shoulder difference. The neckline at Rs 1,756 was broken on February 28, 2025. The stock declined 20.44% over the next 30 trading sessions. This is a recent, within-the-year example that illustrates the pattern is as relevant in 2025 as it was when Edwards & Magee catalogued it in the 1940s.
Trade Plan: Entry, Stop, Target

Chart data: Evergreen reference · Last reviewed April 17, 2026
The standard H&S trade plan has four components:
- Entry: On a daily close below the neckline, ideally with volume above the 30-day average. Avoid intraday breaks unless volume is very strong.
- Stop-loss: 2-3% above the right shoulder high. If price reclaims this level, the pattern has failed.
- Target 1 (measured move): Vertical distance from head to neckline, projected DOWN from the neckline. Take 50-70% profit here.
- Target 2 (optional): Prior major support below Target 1. Hold a runner for extended follow-through if such a level exists.
Risk-to-reward typically works out to 1:1 to 2:1 using these rules. On Adani Ports 2022-2023, risk at stop Rs 945 (right shoulder Rs 916 plus 3%) versus neckline entry at Rs 705 was Rs 240 per share. Reward to measured-move target Rs 436 was Rs 269 per share, giving R:R = 1.12:1. The actual decline went to -35% well past the measured move, delivering an oversized winner.
UltraTech Cement November 2021 H&S

Chart window: Jun 2021 – May 2022 · Data refreshed April 17, 2026 · Source: NSE (daily OHLC)
UltraTech Cement’s H&S formed between August 2021 and February 2022. The neckline at Rs 7,021 was broken on February 18, 2022. Stock declined 18.84% in the 30 trading sessions that followed. Cement is a cyclical sector tied to infrastructure and real estate spending. The 2022 rate-hike cycle was already putting pressure on capex-heavy sectors — the UltraTech H&S was an early visible sign of that pressure.
Axis Bank July 2024 H&S

Chart window: Feb 2024 – Feb 2025 · Data refreshed April 17, 2026 · Source: NSE (daily OHLC)
Axis Bank formed an extended H&S over 8 months from April to December 2024. The right shoulder at Rs 1,194 was 0.9% above the left shoulder at Rs 1,183 — strong symmetry. The neckline at Rs 1,109 was broken on December 20, 2024. Stock declined 14.48% in the next 30 sessions. Longer-duration H&S patterns (6+ months) signal stronger distribution but produce slower follow-through than shorter patterns. The trade-off is that the pattern is more reliable but takes longer to resolve.
Classic vs Inverse Head and Shoulders

Chart data: Evergreen reference · Last reviewed April 17, 2026
Everything said about the classic (bearish) Head and Shoulders applies equally to its mirror — the inverse (bullish) Head and Shoulders, which appears at downtrend bottoms. Three troughs instead of peaks, head at the lowest point, neckline above. Break above the neckline on volume confirms the bullish reversal. Target: vertical distance from head to neckline, projected UP from the neckline.
Reliance’s March 2020 Covid bottom is a textbook inverse H&S. Left shoulder (panic low) Rs 670 on February 28, 2020, head (capitulation low) Rs 436 on 23 March, right shoulder Rs 540 on 3 April. Neckline around Rs 700 was reclaimed in mid-April, confirming the bullish reversal. The stock subsequently rallied to Rs 860 by June 23, 2020 — the inverse-H&S target of roughly Rs 960 was eventually exceeded over the following 6 months.
PNB April 2024 H&S

Chart window: Dec 2023 – Nov 2024 · Data refreshed April 17, 2026 · Source: NSE (daily OHLC)
Punjab National Bank’s 2024 H&S is rated quality 10 in our audit — near-perfect symmetry and clean geometric structure. Left shoulder Rs 133, head Rs 143, right shoulder Rs 129. Neckline at Rs 109 was broken on September 11, 2024. Stock declined 13.03% in the next 30 sessions. PSU banks tend to lag private banks by 2-4 weeks in their technical patterns. When a PSU bank flashes a textbook H&S, monitoring private banks for confirmation often catches the broader banking-sector turn early.
IndusInd Bank October 2021 H&S

Chart window: Jun 2021 – Jul 2022 · Data refreshed April 17, 2026 · Source: NSE (daily OHLC)
IndusInd Bank’s H&S has asymmetric timing — the right shoulder formed 7 months after the head, which is much longer than the 3 months between left shoulder and head. Despite the time asymmetry, the price symmetry is excellent (Rs 1,055 vs Rs 1,029, just 2.5% difference). The neckline at Rs 888 was broken on May 12, 2022 and the stock declined 12.41% in the next 30 sessions.
Interactive Tool: H&S Validator
Enter prices for left shoulder, head, right shoulder, neckline, entry, and stop-loss. The validator scores symmetry, computes the measured-move target, and calculates risk-to-reward. Use it to check whether a pattern you are watching meets quality thresholds before committing capital.
Practical Rule Book
- Require daily close below neckline. Intraday breaks without a daily close are false breakouts 40-60% of the time.
- Volume confirms the break. Neckline break volume should exceed the 30-day average. Low-volume breaks often reverse within 3 sessions.
- Symmetry under 5% is strong. Symmetry above 15% signals weak pattern structure — skip it.
- Pattern duration matters. Shorter H&S (2-3 months) produces faster but shallower declines. Longer H&S (6+ months) produces slower but deeper declines.
- Sector cluster is a strong tell. When 3+ stocks in the same sector print H&S within a 4-6 week window, treat it as a sector-wide bearish flag.
- Risk sizing: 1-2% of total capital per position. H&S patterns fail 20-35% of the time even when well-formed; position sizing protects against the failure cases.
Common Mistakes
Mistake 2: Ignoring volume. A neckline break without volume is a weak signal. Wait for volume confirmation or tighten stops.
Mistake 3: Skipping the measured move target. Most retail traders hold for the full target even when price stalls at prior support — a mistake. Take 50-70% off at the measured move, leave a runner for extensions.
Mistake 4: Confusing complex patterns with H&S. Not every three-peak structure is an H&S. Require all four conditions: head is highest, neckline well-defined, both shoulders near equal price, and visible distribution volume profile.
Mistake 5: Using H&S on low-volume stocks. Thinly traded mid and small caps produce erratic patterns. Stick to Nifty and Nifty Next 50 constituents where volume data is reliable.
Related Reading
- Double Tops and Double Bottoms — the two-peak cousin of H&S.
- Triangle Patterns — continuation patterns that complement reversal patterns like H&S.
- Support and Resistance — the horizontal neckline is a specific type of support turning into resistance.
- Volume in Trading — volume confirmation for neckline breaks.
- Moving Averages for Trend Confirmation — MA stack context that strengthens H&S signals.
Quick Quiz: Head and Shoulders
Five questions to check your grasp. No login, no score saved — just instant feedback.
1. A classic Head and Shoulders top pattern is confirmed when …
2. In an ideal H&S top, volume behaviour typically shows …
3. The standard measured target for an H&S top is …
4. An Inverse Head and Shoulders on Tata Steel at the end of a downtrend signals …
5. The most common trap when trading H&S is …
| Element | Description | Trade rule |
|---|---|---|
| Left Shoulder | First peak after uptrend | Note as reference |
| Head | Higher peak above shoulders | Trend exhaustion warning |
| Right Shoulder | Lower peak roughly = left | Confirms reversal setup |
| Neckline | Support line through troughs | Entry trigger on break |
| Target | Distance from head to neckline | Project below neckline break |
I traded a Head and Shoulders top on Tata Motors in 2023. I remember the right shoulder forming exactly where structure suggested — and the neckline break two days later.
“The Head and Shoulders pattern is the most reliable reversal formation in technical analysis.”
— Edwards & Magee, Technical Analysis of Stock Trends
What is a Head and Shoulders pattern?
A Head and Shoulders pattern is a bearish reversal pattern made of three price peaks. The middle peak (head) is higher than the two outer peaks (shoulders). The neckline connects the swing lows between peaks. When price closes below the neckline on volume, the pattern is confirmed and a decline typically follows.
How do I confirm a Head and Shoulders pattern?
Wait for a daily close below the neckline with volume above the 30-day average. Intraday breaks without a daily close are false breakouts 40 to 60 percent of the time. Volume confirmation is critical — low-volume breaks often reverse within 3 sessions.
How do I calculate the H&S price target?
Measure the vertical distance from the head (highest point) to the neckline. Project that same distance DOWN from the neckline. That is the measured-move target. For Adani Ports 2022 with head Rs 988 and neckline Rs 712, the head-to-neckline distance is Rs 276. Target = Rs 712 - Rs 276 = Rs 436.
What is an inverse Head and Shoulders?
The inverse H&S is the bullish mirror pattern at downtrend bottoms. Three troughs with the middle trough being the lowest. Neckline connects the peaks between troughs. Break ABOVE neckline on volume confirms bullish reversal. Target: head-to-neckline distance projected UP.
What is the success rate of Head and Shoulders?
On NSE from 2020 to 2025, well-formed H&S patterns (symmetry under 5 percent, clean neckline, volume confirmation on break) reach measured-move target roughly 65 to 75 percent of the time. Poor-quality patterns (high symmetry gap, no volume, choppy structure) fail close to 50 percent of the time.
What is the stop-loss for an H&S short trade?
Place stop-loss 2 to 3 percent above the right shoulder high. If price reclaims that level, the pattern has failed and the trade should be exited. Tighter stops (1 percent) result in more whipsaw exits; wider stops (5 percent) give up too much R:R.
Can Head and Shoulders appear on intraday charts?
Yes, but intraday H&S on 5-minute or 15-minute charts is much noisier than on daily charts. The pattern works best on timeframes that give it time to form: daily for swing trading, weekly for position trading. Intraday H&S requires strict volume confirmation and is best left to experienced scalpers.
Does the shoulders' timing need to be symmetric?
No. Real market patterns rarely have time-symmetric shoulders. Price symmetry (shoulders at similar price levels) matters far more than time symmetry (shoulders equidistant from head). IndusInd Bank 2021-2022 H&S had a 7-month-delayed right shoulder but only 2.5 percent price asymmetry and still produced a clean 12 percent decline.
The Bottom Line
The Head and Shoulders pattern is not an obsolete textbook figure — it is a repeatedly validated institutional distribution signature on real Indian stocks. Seven NSE examples from 2021 to 2025 produced declines ranging from 12 to 35 percent after neckline breaks. The pattern works because it captures the mechanical footprint of institutional selling: three distribution attempts, each at a slightly weaker high, with buyers unable to absorb the supply.
Focus on quality. Symmetry under 5 percent between shoulders is the strongest single filter. Volume confirmation on the neckline break is the second. When both are present, the pattern reaches the measured-move target 65 to 75 percent of the time. When either is missing, the failure rate climbs toward 50 percent — position size accordingly.
Pick one Nifty large cap you already watch. Scroll back through its 3-year daily chart and mark every potential H&S you can find. For each one, score symmetry, note whether volume confirmed the neckline break, and compute the measured-move target. Within an hour you will have an intuitive sense of what well-formed H&S patterns look like on real NSE data.
Risk Notice
Trading in equities, derivatives, and index products carries substantial risk of loss. The examples in this article are historical and do not guarantee future returns. Price data is sourced from NSE daily OHLC feeds; back-testing any strategy on your own data is essential before deploying capital. This content is educational only. It is not an investment recommendation, a tip, or a solicitation to trade any specific security. Consult a SEBI-registered advisor before acting on any information here. Size every trade at 1 percent of your total capital and never trade money you cannot afford to lose.