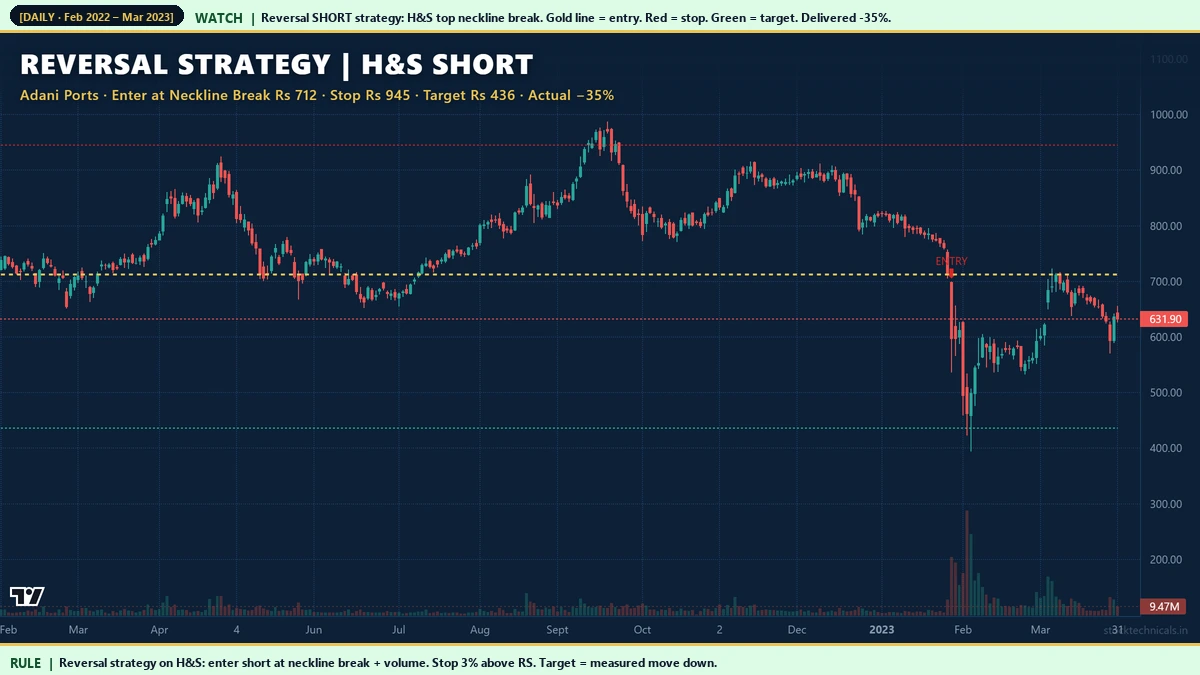
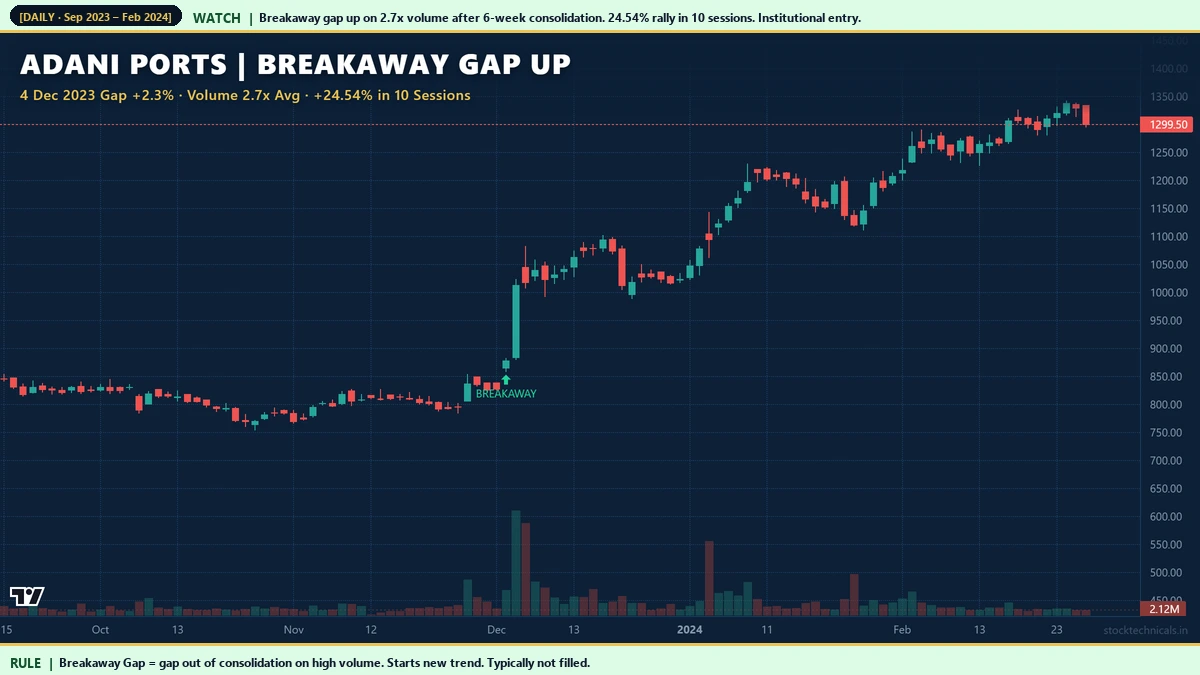
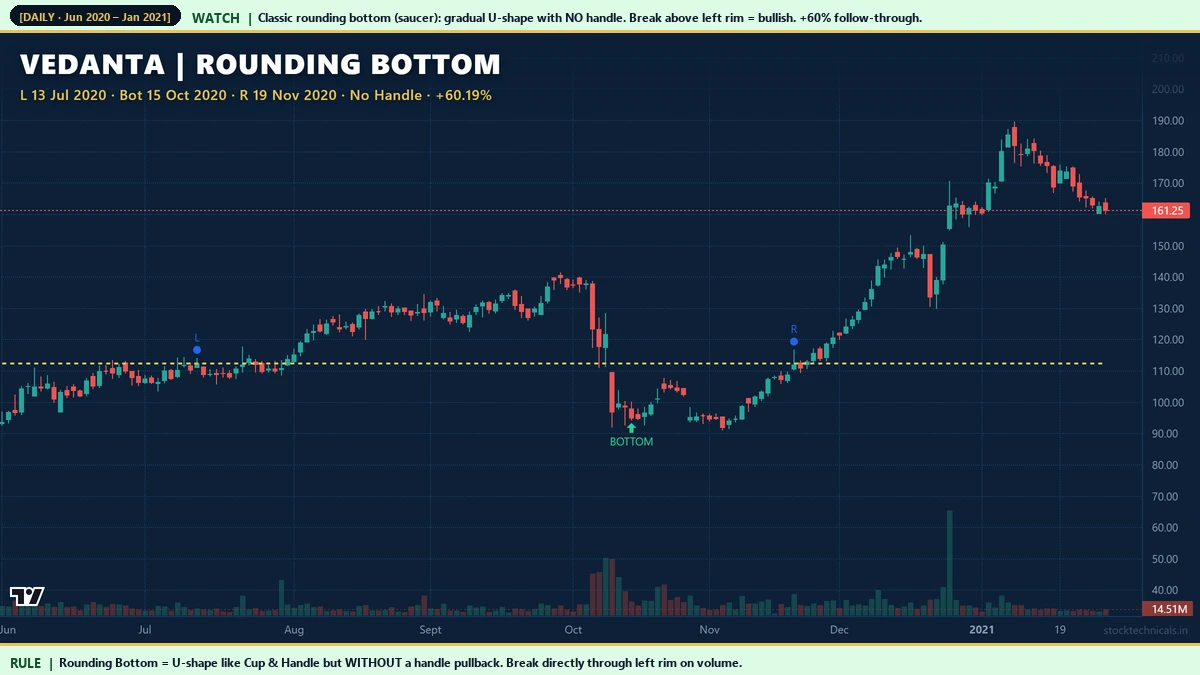
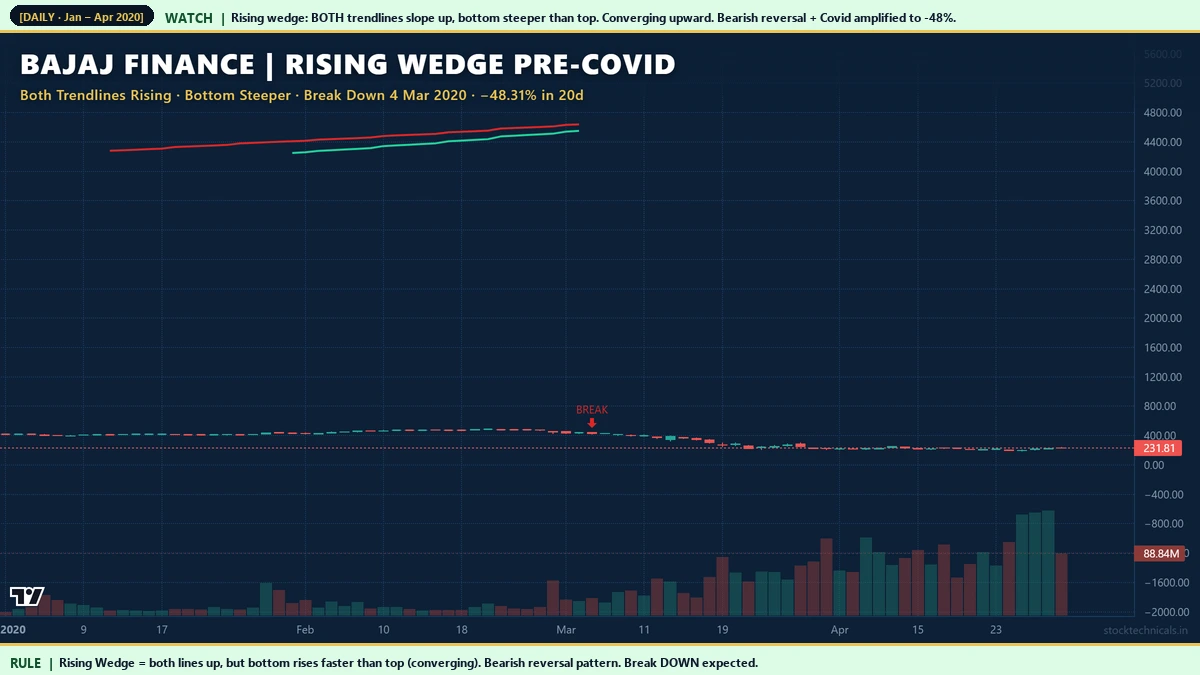
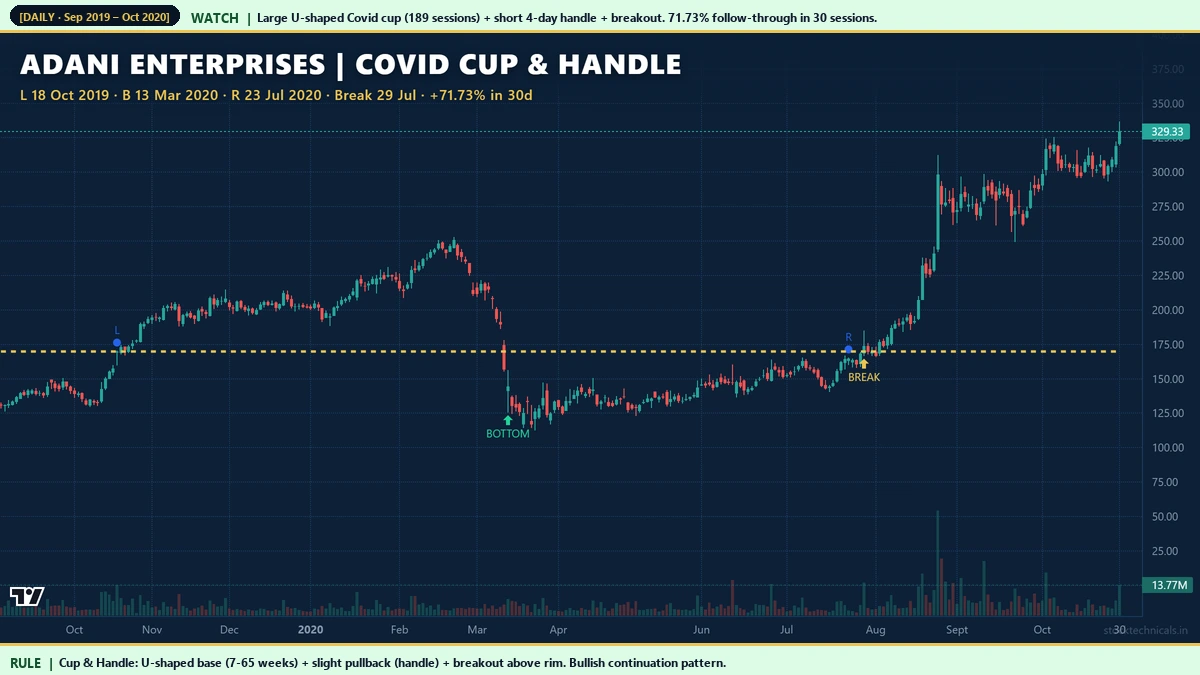
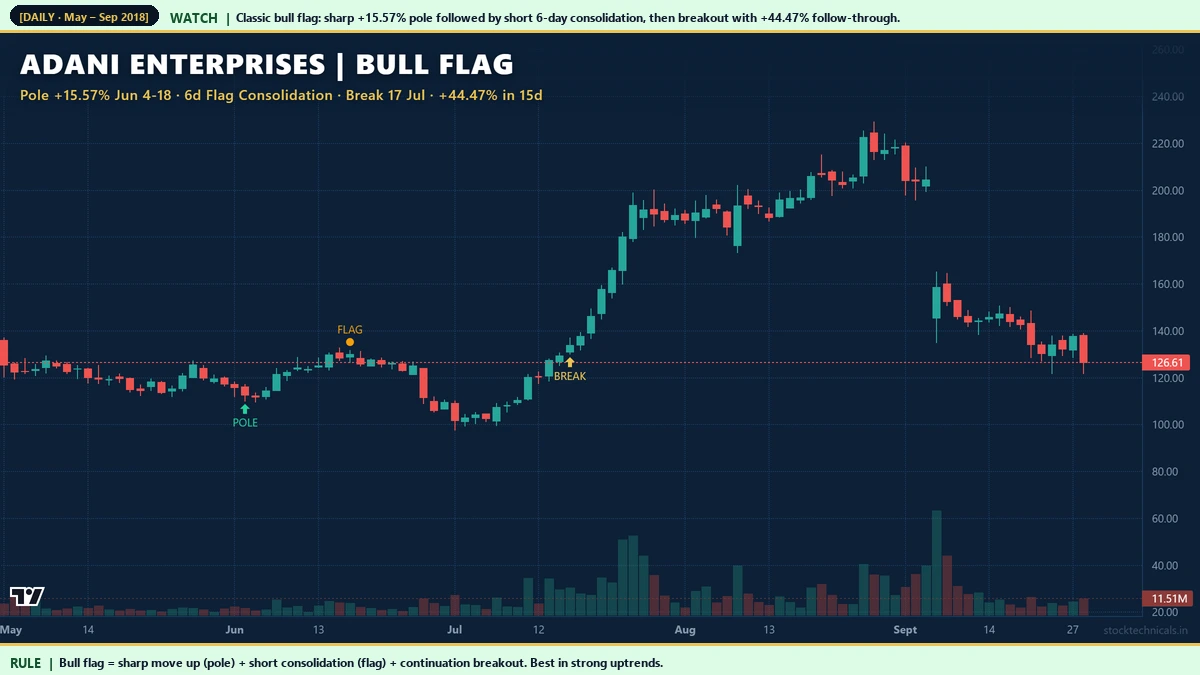
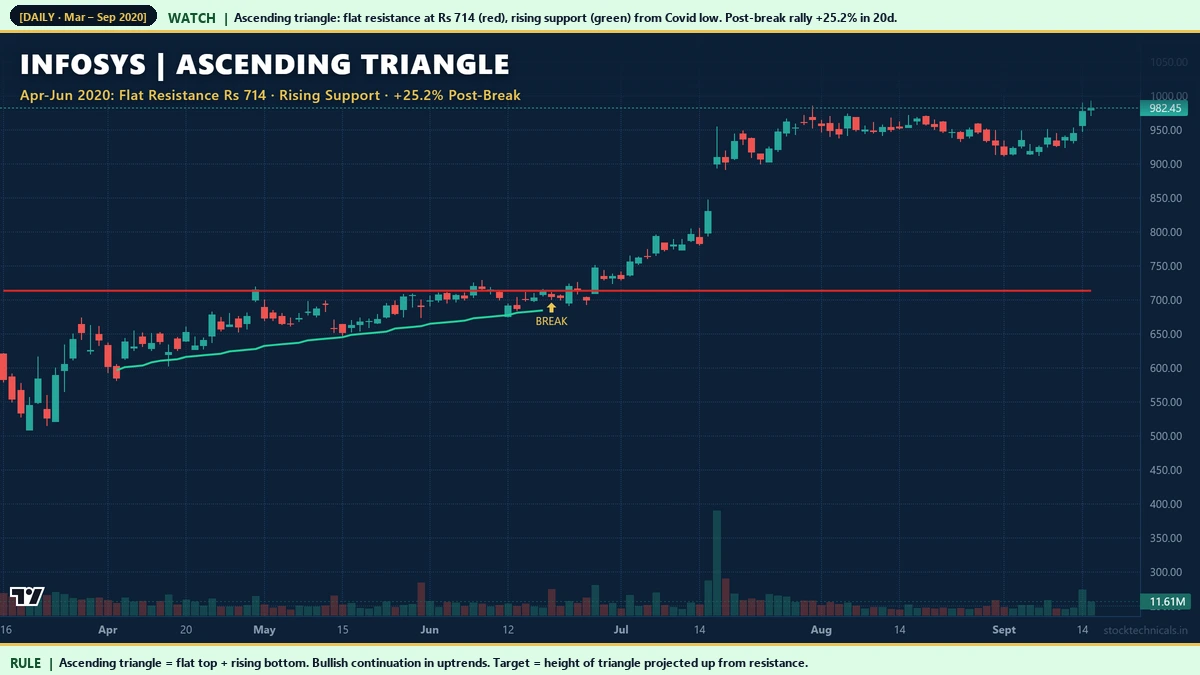
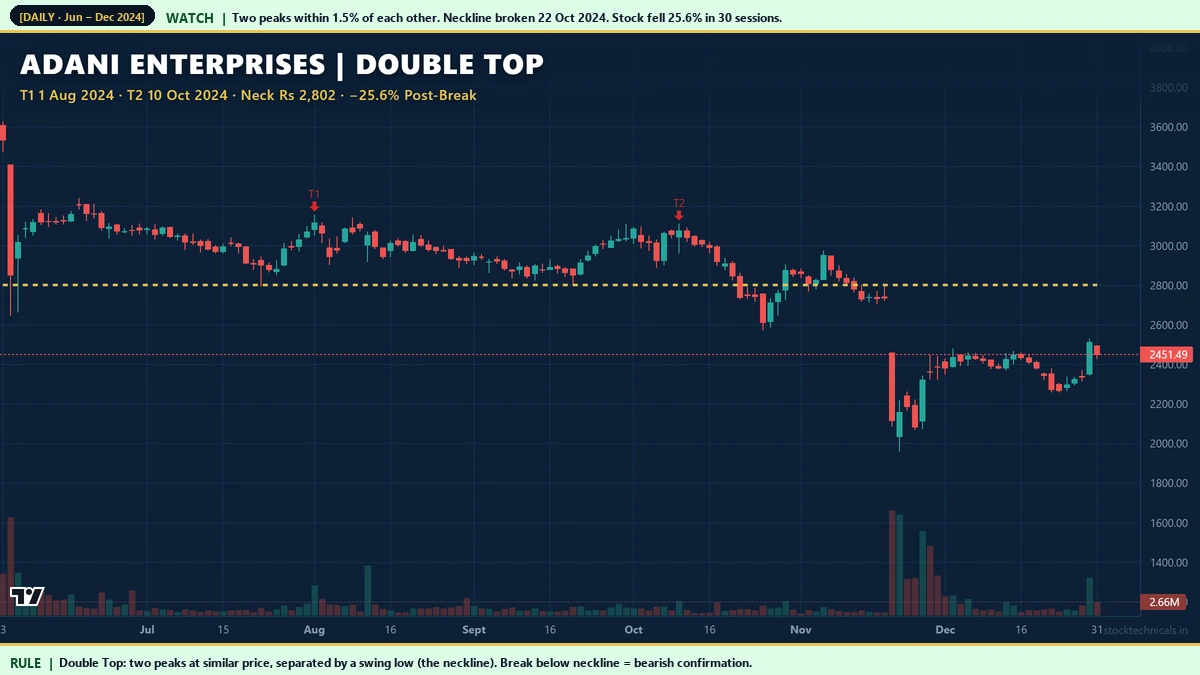
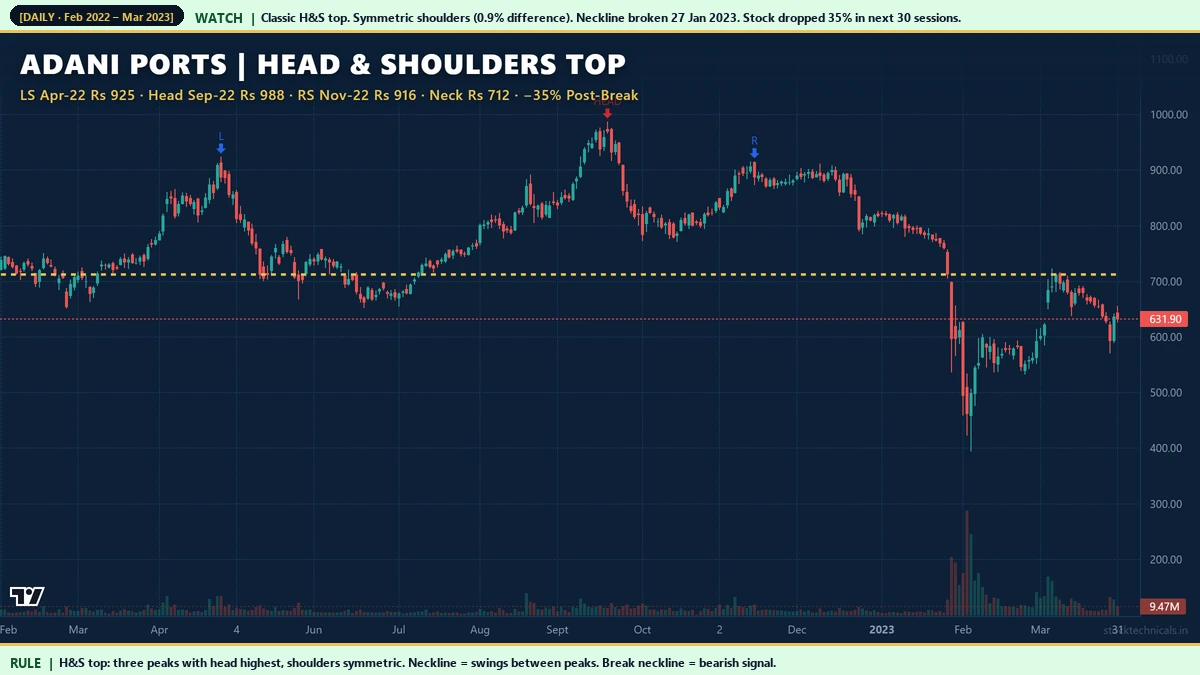
Combine Chart Patterns with Indicators: Confluence Setups with 70%+ Success Rate

Adani Ports head and shoulders plus bearish EMA stack dual confirmation 35 percent decline

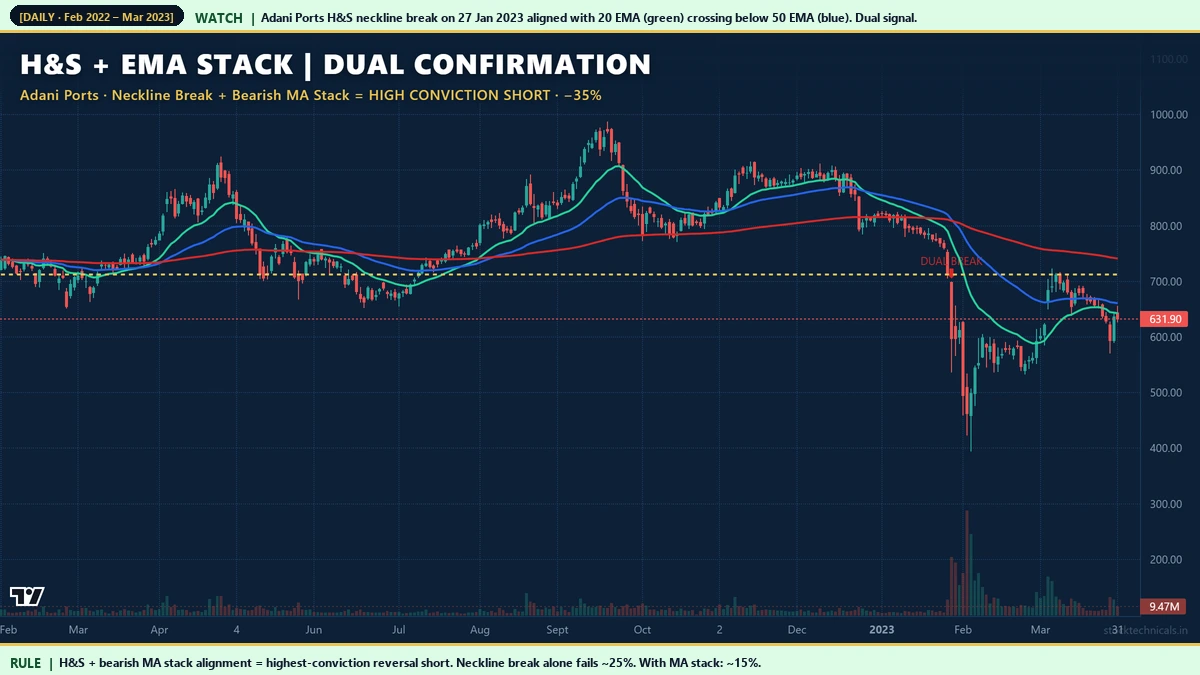
Chart patterns alone have 50-60% success rates on NSE. Indicators alone have similar rates. Combine them intelligently, and the confluence can push success rates to 70-75%. This article covers seven specific pattern+indicator pairings that consistently outperform either signal used alone, along with the confluence scorecard framework to grade every setup you consider. Quick Answer: Combining … Read more

Chart Pattern Trading Strategies: Unified Framework for 12+ Patterns

Adani Ports reversal short strategy head and shoulders entry stop target 35 percent decline

Individual chart patterns are useful. A systematic strategy built around them is transformative. This article synthesizes the eight chart-pattern articles in our technical-analysis series (Head & Shoulders, Double Tops/Bottoms, Triangles, Flags, Wedges, Rounding patterns, Cup & Handle, Gaps) into a unified trading framework. Seven NSE examples show how to classify patterns, match them to market … Read more

Rounding Bottom and Rounding Top: Saucer Reversal Patterns on NSE

Vedanta 2020 rounding bottom saucer pattern 60 percent rally no handle

Rounding patterns are long-duration reversal patterns shaped like saucers. A rounding bottom is a bullish reversal that looks like a gentle U over weeks or months. A rounding top is the bearish mirror — an inverted U showing gradual distribution. Unlike Cup & Handle, rounding patterns have no handle pullback — price breaks directly through … Read more

Wedge Patterns: Rising and Falling Wedges with 7 NSE Examples

Bajaj Finance pre Covid rising wedge 48 percent decline bearish reversal

Wedge patterns are reversal patterns that look superficially like triangles but behave very differently. A rising wedge has both trendlines sloping up, but the bottom line rises faster than the top — creating a converging upward-sloping pattern. A falling wedge has both trendlines sloping down, with the bottom falling faster than the top. Both reverse … Read more

Cup and Handle Pattern: 7 Verified NSE Bullish Continuation Setups

Adani Enterprises Covid cup and handle 2019 2020 71 percent rally after breakout

The Cup and Handle pattern, first popularized by William O’Neil in his CANSLIM investing framework, is one of the most reliable long-duration bullish continuation patterns in technical analysis. A rounded U-shaped base forms over weeks or months, followed by a short pullback (the handle), then a decisive breakout above the cup rim. This article covers … Read more

Flags and Pennants: 7 Verified NSE Continuation Patterns

Adani Enterprises June 2018 bull flag 15.57 percent pole 6 day consolidation 44 percent continuation

Flags and pennants are the fastest continuation patterns in technical analysis. A sharp move (the pole) runs for 8-15 sessions. Price consolidates briefly (the flag or pennant) for 3-15 sessions. Then price breaks in the same direction as the original pole, often with strong follow-through. This article covers seven NSE flag and pennant examples — … Read more

Triangle Patterns: Ascending, Descending, and Symmetrical with NSE Examples

Infosys April June 2020 ascending triangle flat resistance rising support 25 percent breakout

Triangle patterns form when price consolidates with contracting volatility — the range between highs and lows shrinks over time, forming a geometric triangle between trendlines. Three types appear: ascending (flat resistance with rising support), descending (flat support with falling resistance), and symmetrical (both lines converging). This article covers seven NSE triangle examples from 2018 to … Read more

Double Tops and Double Bottoms: 7 Verified NSE Reversal Patterns

Adani Enterprises 2024 double top pattern 25 percent decline after neckline break

Double Top and Double Bottom patterns are the simplest reversal patterns in technical analysis — two price peaks (or troughs) at similar levels, separated by a swing low (or high) called the neckline. Price breaking beyond the neckline confirms the reversal. This article covers seven NSE examples from 2021 to 2024, each with documented neckline … Read more

Head and Shoulders Pattern: 7 Verified NSE Examples with Trade Plans

Adani Ports 2022 2023 head and shoulders top pattern 35 percent decline after neckline break

The Head and Shoulders pattern is the most widely recognised reversal pattern in technical analysis. Three price peaks, with a higher peak in the middle and two lower peaks on either side, connected by a neckline drawn through the intervening swing lows. When price breaks below the neckline on volume, the pattern is considered confirmed … Read more