Wedge patterns are reversal patterns that look superficially like triangles but behave very differently. A rising wedge has both trendlines sloping up, but the bottom line rises faster than the top — creating a converging upward-sloping pattern. A falling wedge has both trendlines sloping down, with the bottom falling faster than the top. Both reverse the prior trend when they break. This article covers seven NSE wedge examples with their breakdowns and follow-through magnitudes.

Chart window: Jan – Apr 2020 · Data refreshed April 18, 2026 · Source: NSE (daily OHLC)
Key Takeaways
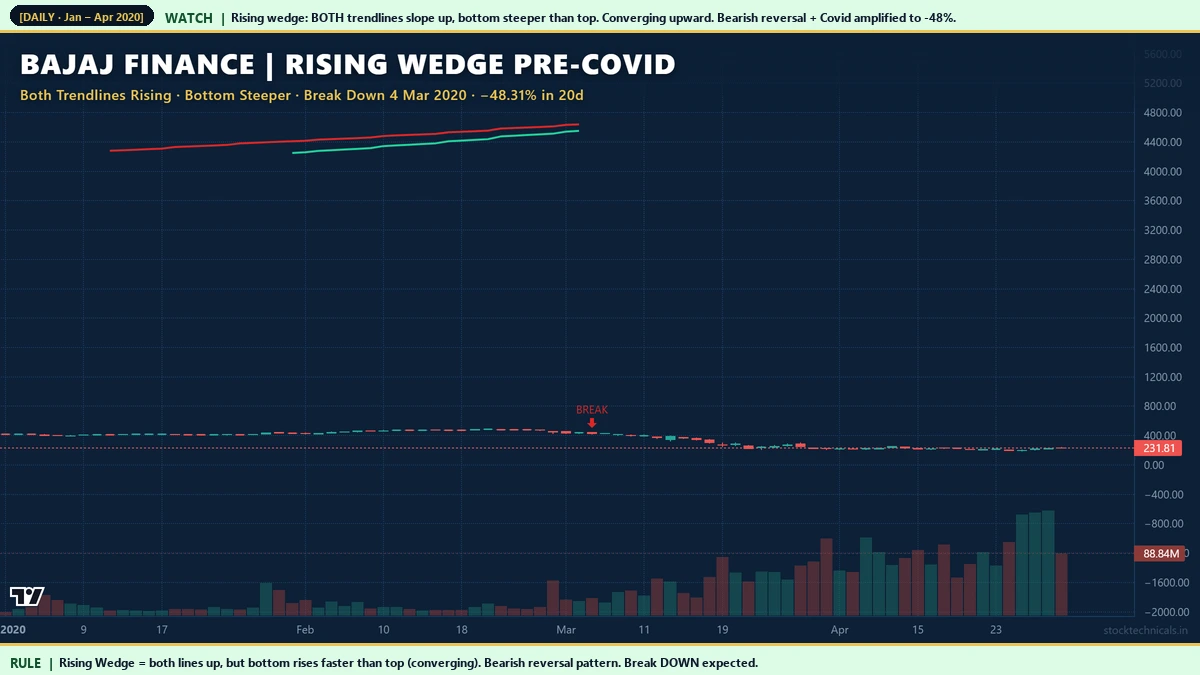
- Rising wedge: both trendlines slope UP but converge. Bottom steeper than top. Bearish reversal — breaks DOWN.
- Falling wedge: both trendlines slope DOWN but converge. Bottom steeper (more negative) than top. Bullish reversal — breaks UP.
- Slope rule (distinguishes from triangles): in a wedge, both lines slope the SAME direction. In a triangle, lines have opposite slopes or one is flat.
- Wedges reverse the prior trend while triangles continue it.
- Target: origin of the wedge (where the pattern began forming) in the break direction.
- 30-40% failure rate: wedges break against expected direction often, especially in strong trends. Always wait for daily close + volume confirmation.
Rising vs Falling Wedge

Chart data: Evergreen reference · Last reviewed April 18, 2026
The wedge pattern has a deceptive geometry. At first glance, a rising wedge looks bullish — price is making higher highs and higher lows. But the converging trendlines reveal that the momentum is weakening: each new high is only marginally above the previous one, while each new low rises aggressively. The pattern visually captures buyers running out of strength even as price technically continues upward.
A falling wedge is the mirror. Price is making lower lows and lower highs, but the lows are falling faster than the highs. Each bounce attempt is weaker than the last. Selling pressure is exhausting itself, setting up a reversal higher.
Hero Example: Bajaj Finance Rising Wedge March 2020
Recent Rising Wedge: IndusInd Bank February 2025

Chart window: Nov 2024 – May 2025 · Data refreshed April 18, 2026 · Source: NSE (daily OHLC)
IndusInd Bank (NSE: INDUSINDBK) printed a rising wedge over 3 months from December 2024 to February 2025. Price was making new highs each week, but the bottom trendline was rising faster than the top — the hallmark of a weakening uptrend. Breakdown on February 28, 2025 produced a 35.66% decline over the next 20 sessions. Banking-sector wedges often coincide with cyclical tops in rate-sensitive phases.
Metals Rising Wedge: Vedanta April 2022

Chart window: Jan – Jul 2022 · Data refreshed April 18, 2026 · Source: NSE (daily OHLC)
Vedanta’s April 2022 rising wedge formed at the peak of the 2022 commodity-cycle high. The breakdown coincided with the global metals correction that played out through H2 2022. Cyclical-sector rising wedges often mark macro inflection points; treat them as sector-wide warnings, not just single-stock signals.
IT Sector Rising Wedge: Infosys February 2020

Chart window: Dec 2019 – Apr 2020 · Data refreshed April 18, 2026 · Source: NSE (daily OHLC)
Infosys flashed a rising wedge in December 2019 to February 2020 — the same window that produced bearish signals on ITC, L&T, and Axis Bank. Multi-stock rising wedges clustered within 2-6 weeks across sector leaders form an index-level bearish flag. The February 2020 cluster preceded the Covid crash by roughly 3 weeks.
Wedge vs Triangle — The Slope Rule

Chart data: Evergreen reference · Last reviewed April 18, 2026
The single rule that distinguishes a wedge from a triangle:
- Wedge: BOTH trendlines slope in the SAME direction (both up or both down). Converging because of differing slope magnitudes. Reversal pattern.
- Triangle: One trendline is flat (ascending, descending), OR the two lines slope in OPPOSITE directions (symmetrical). Continuation pattern.
The distinction matters because the two pattern families behave very differently. Wedges reverse the prior trend; triangles continue it. Misclassifying a rising wedge as an ascending triangle would lead to a bullish trade at a bearish reversal point — a costly mistake.
Hero Falling Wedge: Bajaj Finserv Post-Covid

Chart window: Aug 2020 – Jan 2021 · Data refreshed April 18, 2026 · Source: NSE (daily OHLC)
Bajaj Finserv’s August to October 2020 falling wedge is the mirror of Bajaj Finance’s rising wedge. Both trendlines sloped down, but the bottom line fell faster (more negative slope) than the top — creating a converging downward pattern. When price broke above the upper trendline on November 6, 2020 with volume expansion, the bullish reversal was confirmed. Over the next 20 sessions, the stock rallied 44.98%.
Wedge Trade Plan

Chart data: Evergreen reference · Last reviewed April 18, 2026
- Entry: Daily close beyond the relevant trendline with volume above 30-day average. Rising wedge: close below lower trendline. Falling wedge: close above upper trendline.
- Stop-loss: Just beyond the opposite trendline. If price re-enters the wedge and breaks the other side, the pattern has failed.
- Target: Price level at the wedge origin (where the pattern began forming). Often reached within 15-25 sessions.
- Size: 1-2% of capital per position. Wedges have 30-40% failure rate; position sizing protects against failures.
Bajaj Finance October 2020 Falling Wedge

Chart window: Aug 2020 – Feb 2021 · Data refreshed April 18, 2026 · Source: NSE (daily OHLC)
Bajaj Finance’s October 2020 falling wedge mirrored the sector-wide recovery setup. Both Bajaj Finserv and Bajaj Finance printed bullish wedges within 2 weeks of each other. When matching wedges form on sector peers, the individual signals are amplified by sector confluence.
Failed Wedge: Tata Steel 2021

Chart window: Feb – May 2021 · Data refreshed April 18, 2026 · Source: NSE (daily OHLC)
Interactive Tool: Wedge Classifier
Adjust top and bottom slopes to build any pattern. The classifier distinguishes rising/falling wedges (reversal) from ascending/descending/symmetrical triangles (continuation) and reports the expected break direction. Use presets for canonical examples.
Practical Rule Book
- Slope rule: both lines same direction = wedge (reversal). Opposite slopes or one flat = triangle (continuation).
- Minimum 4 weeks formation. Shorter patterns are noise.
- Require 3+ touches per trendline. Fewer touches = unreliable pattern.
- Volume should contract through the wedge. Rising volume through the wedge = pattern may fail.
- Daily close + volume on break. Intraday and low-volume breaks fail often.
- Stop beyond opposite trendline. Re-entry into the wedge invalidates the pattern.
Common Mistakes
Mistake 2: Trading wedges in strong trends without considering continuation risk. 30-40% of wedges fail in trending markets.
Mistake 3: Entering before the trendline break. Wedges are reversal patterns; reversals are only confirmed on the break.
Mistake 4: Ignoring volume contraction. Volume should decline through the wedge. Rising volume indicates distribution or pattern failure.
Mistake 5: Using wedges on illiquid stocks. Thin volume distorts trendlines. Stick to Nifty 500 constituents.
Related Reading
- Triangle Patterns — continuation cousins of wedges.
- Head and Shoulders Pattern — the classic reversal pattern.
- Double Tops and Double Bottoms — simpler reversal patterns.
- Volume in Trading — volume confirmation framework.
- Flags and Pennants — short-duration continuation patterns for contrast.
Quick Quiz: Wedge Patterns
Five questions to check your grasp. No login, no score saved — just instant feedback.
1. A rising wedge in an existing uptrend is typically a …
2. A falling wedge in a downtrend is typically a …
3. A wedge differs from a symmetrical triangle because …
4. Volume inside a classic wedge usually …
5. The most common mistake with wedges is …
| Wedge type | Direction | Trendline slopes | Breakout bias |
|---|---|---|---|
| Rising Wedge | Up | Both rising, upper steeper | Bearish — break down |
| Falling Wedge | Down | Both falling, lower steeper | Bullish — break up |
I traded Falling Wedges for a year before I learnt to wait for the breakout candle to close above the upper trendline. Premature entries cost me — patient ones paid.
“Rising wedges fall and falling wedges rise. The shape lies; the breakout tells the truth.”
— Thomas Bulkowski, Encyclopedia of Chart Patterns
What is a rising wedge?
A rising wedge is a bearish reversal pattern where both trendlines slope upward but the bottom line rises faster than the top, causing the lines to converge. It signals weakening bullish momentum and typically resolves with a breakdown below the lower trendline.
What is a falling wedge?
A falling wedge is a bullish reversal pattern where both trendlines slope downward but the bottom line falls faster than the top. Selling exhaustion is in progress. Typically resolves with a breakout above the upper trendline.
How do I tell a wedge from a triangle?
Check trendline slopes. If BOTH lines slope in the SAME direction (both up or both down), it is a wedge. If one line is flat or the two lines have OPPOSITE slopes, it is a triangle. Wedges reverse trends; triangles continue them.
What is the wedge target?
The target is the price level where the wedge began forming — the origin of the pattern. Rising wedges project down to the origin low. Falling wedges project up to the origin high. Typically reached within 15-25 sessions after the break.
Why do wedges fail?
Wedges have a 30-40 percent failure rate, especially in strong trending markets. Rising wedges within powerful uptrends often break up (continuation) instead of down. Always require daily close + above-average volume confirmation.
Can wedges form on intraday charts?
Yes. Intraday wedges work on 15-minute or hourly charts for active traders. The pattern structure is identical; only the timeframe differs. Intraday wedges are noisier and fail more often than daily patterns.
What volume pattern confirms a wedge?
Volume should contract through the wedge formation, indicating indecision. Volume should expand on the breakout, confirming the reversal. Low-volume breaks fail 50 percent of the time.
How many trendline touches are needed?
Minimum 3 touches per trendline. The more touches (4+), the stronger the pattern. Patterns with only 2 touches per line are unreliable — treat those as noise, not valid wedges.
The Bottom Line
Wedge patterns capture a specific geometric signature: both trendlines sloping the same direction, converging toward an apex. They are reversal patterns, not continuation — distinguishing them from triangles by the slope rule is critical. Seven NSE examples from 2020 to 2025 delivered follow-through ranging from 28% to 48% in 20 sessions. The pattern works reliably when the quality filters are respected.
The 30-40% failure rate is not a bug but a feature to respect with position sizing. Never oversize a wedge trade. Always require daily close + volume confirmation. When those filters are met, wedges are a high-reliability reversal signal that gets you out of long positions before the worst of a decline or into long positions before a meaningful rally.
Scan your watchlist weekly for stocks showing converging trendlines that both slope the same direction over at least 4 weeks. Those are wedge candidates. Apply the slope test, the volume test, and the close-confirmation test. The setups that pass all three are tradeable; the rest are noise.
Risk Notice
Trading in equities, derivatives, and index products carries substantial risk of loss. The examples in this article are historical and do not guarantee future returns. Price data is sourced from NSE daily OHLC feeds; back-testing any strategy on your own data is essential before deploying capital. This content is educational only. It is not an investment recommendation, a tip, or a solicitation to trade any specific security. Consult a SEBI-registered advisor before acting on any information here. Size every trade at 1 percent of your total capital and never trade money you cannot afford to lose.