The Cup and Handle pattern, first popularized by William O’Neil in his CANSLIM investing framework, is one of the most reliable long-duration bullish continuation patterns in technical analysis. A rounded U-shaped base forms over weeks or months, followed by a short pullback (the handle), then a decisive breakout above the cup rim. This article covers seven NSE Cup & Handle examples from 2019 to 2024, each with documented breakout and substantial post-breakout rallies.

Chart window: Sep 2019 – Oct 2020 · Data refreshed April 17, 2026 · Source: NSE (daily OHLC)
Key Takeaways
- Cup and Handle: U-shaped base (7-65 weeks) + handle pullback (1-4 weeks) + breakout above rim. Bullish continuation pattern.
- Cup shape matters: rounded U, not sharp V. Gradual decline and gradual recovery signal institutional accumulation.
- Cup depth: typically 15-35%. Less than 15% is not a true correction. More than 35% suggests reversal risk.
- Handle pullback: less than 40% of cup depth. Deep handles signal loss of conviction.
- Breakout volume: must be above 30-day average. Low-volume breaks fail 50% of the time.
- Target: cup depth projected up from the rim. Actual follow-through often exceeds target.
Cup and Handle Anatomy

Chart data: Evergreen reference · Last reviewed April 17, 2026
The Cup and Handle has four key components:
- Left rim: starting high before the correction. Mark this as horizontal resistance.
- Cup bottom: lowest close during the correction. Should be roughly in the middle of the cup duration.
- Right rim: price returns close to the left rim level after rounding out the U-shape.
- Handle: short pullback after touching the right rim. Creates a lower high and usually slopes down slightly.
The pattern is confirmed when price closes above the cup rim with above-average volume, breaking out of the handle. The psychology: during the cup, early buyers who bought near the left rim held through the correction (U-shape shows gradual buying, not panic). The handle is brief profit-taking before another wave of buyers push price above resistance.
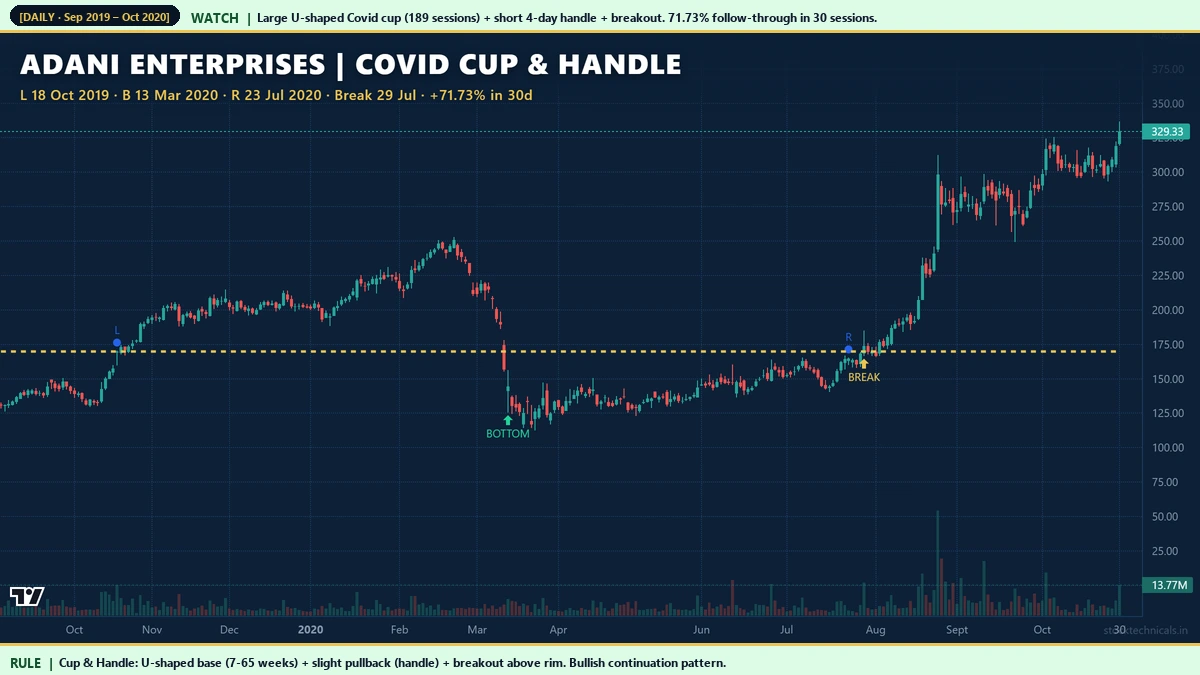
Hero Example: Adani Enterprises Covid Cup
Three reasons this cup delivered outsized returns:
- Covid regime change: March 2020 bottom marked a major regime shift. Cup patterns forming at such inflections produce larger follow-through than during normal conditions.
- Sector momentum: Adani group stocks were in a multi-year growth phase. Cups aligned with sector trends amplify results.
- Tight handle: 34.72% handle pullback is within the 40% threshold. Tight handles confirm buyer conviction.
Vedanta 2020 Cup

Chart window: Jun 2020 – Feb 2021 · Data refreshed April 17, 2026 · Source: NSE (daily OHLC)
Vedanta (NSE: VEDL) printed a clean 93-session cup from July to November 2020. Left rim to cup bottom took roughly 14 weeks. Handle was just 4 days with an 18.18% pullback — textbook tight handle. Breakout delivered 60.19% over the next 30 sessions as the metals cycle turned up. Cups on cyclical sectors during sector upcycles consistently produce strong follow-through.
Fast Cup: Tata Steel 2020

Chart window: Jul 2020 – Jan 2021 · Data refreshed April 17, 2026 · Source: NSE (daily OHLC)
Tata Steel’s 48-session cup is on the shorter end of the spectrum (typically 7-65 weeks, this was roughly 10 weeks). The U-shape was compressed but clearly visible. Handle was 10 days with 22.92% pullback — acceptable. Breakout delivered 51.21% follow-through in 30 sessions. Shorter cups work when the sector backdrop is strong enough to drive continued buying — metals sector in late 2020 was such a backdrop.
Cup Quality Filters

Chart data: Evergreen reference · Last reviewed April 17, 2026
Grade every cup candidate on these six criteria:
- Cup duration 7-65 weeks. Shorter = flag/pennant. Longer = extended base.
- Cup depth 15-35%. Less = not a real correction. More = reversal risk.
- U-shape not V-shape. Gradual decline and recovery, not sharp panic bottom.
- Handle duration 1-4 weeks. Short handle keeps momentum intact.
- Handle pullback under 40% of cup depth. Deep handles signal weakening conviction.
- Breakout volume above 30-day average. Low-volume breaks fail 50% of the time.
5-6/6: high-conviction setup. 4/6: valid, smaller size. Below 4: stand aside.
IndusInd Bank 2020 Cup

Chart window: Jul 2020 – Jan 2021 · Data refreshed April 17, 2026 · Source: NSE (daily OHLC)
IndusInd Bank’s 35-session cup with 19.08% depth and a short handle delivered 42.8% follow-through in 30 sessions. Private banking cups during rate-cycle turnarounds historically produce reliable patterns. When RBI accommodative policy meets a technically clean bank cup, the confluence amplifies the signal.
Textbook U-Shape: Infosys Covid Cup

Chart window: Dec 2019 – Aug 2020 · Data refreshed April 17, 2026 · Source: NSE (daily OHLC)
Infosys’s January to June 2020 cup is a textbook U-shape. Left rim Rs 769 on January 3, 2020. Cup bottom during the Covid panic on 23 March. Right rim on 26 June at around Rs 770. 118-session cup with 15.39% depth — on the shallow end but clean geometry. Follow-through was a modest but reliable 27.29% in 30 sessions. Defensive sectors like IT and FMCG produce smaller but more consistent cup follow-throughs than cyclicals.
Trade Plan

Chart data: Evergreen reference · Last reviewed April 17, 2026
Standard Cup and Handle trade plan:
- Entry: On daily close above cup rim with volume above 30-day average.
- Stop-loss: 2% below handle low. Invalidation if price drops further.
- Target 1: Cup depth projected up from rim. Take 50-70% profit here.
- Target 2: Trail remaining runner with 50 EMA or prior swing low stops for extensions beyond target.
On Adani Enterprises: cup depth Rs 23.70, rim Rs 158, breakout Rs 164, stop Rs 152 (2% below handle low Rs 155). Risk per share Rs 12. Target Rs 187.70 (reward Rs 23.70 per share). R:R = 1.98:1. The actual move went to Rs 281 — more than 5x the initial risk. This is why cup traders love the pattern: favourable R:R at entry with uncapped upside potential.
High-Beta Cup: Bajaj Finance 2020

Chart window: Jul 2020 – Feb 2021 · Data refreshed April 17, 2026 · Source: NSE (daily OHLC)
Bajaj Finance’s Covid-era cup was 50 sessions with 16.85% depth. The stock is historically a high-beta growth name — when it breaks out of a cup pattern during a favorable macro backdrop, the follow-through tends to exceed the measured-move target. 41.47% in 30 sessions matched the high-beta profile.
Pre-Covid Example: BPCL 2019 Cup

Chart window: Apr – Nov 2019 · Data refreshed April 17, 2026 · Source: NSE (daily OHLC)
BPCL’s 73-session cup from May to September 2019 shows the pattern is not Covid-specific. Pre-Covid, during normal market conditions, a clean 15.16% depth cup on a PSU oil stock still produced 30.73% follow-through in 30 sessions. PSU cups tend to align with commodity or macro catalysts — crude oil cycle turns, privatization news, or earnings momentum.
Interactive Tool: Cup & Handle Detector
Enter cup rim, bottom, duration, handle details, and breakout price. The detector computes cup depth, measured-move target, quality score (0-6), and risk-to-reward ratio. Verdict classifier tells you whether the pattern is high-quality, valid, marginal, or invalid.
Practical Rule Book
- Cup duration 7-65 weeks. Anything shorter is probably a flag or pennant, not a cup.
- Require U-shape, reject V-shape. Rounded decline and recovery reflects accumulation. V-shape reflects panic followed by panic buying.
- Handle pullback under 40% of cup depth. This is the single most important quality filter.
- Breakout volume above 30-day average. Low-volume breaks fail half the time.
- Stop-loss below handle low (2% buffer). If price violates this level, pattern has failed.
- Take 50-70% at measured-move target. Trail remainder for extensions — cup follow-through often exceeds target.
Common Mistakes
Mistake 2: Entering on the right rim before the handle forms. The handle provides the volume and price confirmation. Without it, the pattern is incomplete.
Mistake 3: Ignoring handle depth. Handles deeper than 40% of cup depth often evolve into Head & Shoulders tops or other bearish patterns.
Mistake 4: Using cups on illiquid stocks. Thin volume distorts the cup shape and makes volume confirmation impossible.
Mistake 5: Exiting entirely at measured-move target. Cup follow-throughs often extend 2-5x the initial target. Trail a runner for extensions.
Related Reading
- Rounding Bottom and Rounding Top — the long-duration cousin of Cup & Handle.
- Flags and Pennants — shorter-duration continuation patterns.
- Head and Shoulders Pattern — reversal pattern that cup failures often evolve into.
- Support and Resistance — cup rim as horizontal resistance.
- Volume in Trading — volume confirmation framework for breakouts.
Quick Quiz: Cup and Handle
Five questions to check your grasp. No login, no score saved — just instant feedback.
1. A Cup and Handle pattern is best described as …
2. The handle typically retraces … of the cup's depth.
3. The cup portion ideally looks like …
4. A Cup and Handle on TCS weekly chart is generally traded by …
5. The measured target for a Cup and Handle is commonly …
| Component | Shape | Time | Volume profile |
|---|---|---|---|
| Cup | U-shaped curve | 1-6 months typical | Drops in cup, rises into rim |
| Handle | Small downward drift | 1-4 weeks | Light volume — orderly pullback |
| Breakout | Rally above handle high | Single session | Volume spike 1.5x+ avg |
| Target | Cup depth projected up | Days to weeks | Sustained higher volume |
I saw a textbook Cup and Handle on ITC over four months. I remember the handle pulling back exactly to the 20 EMA — the breakout that followed ran 18%.
“The cup and handle is one of the most successful chart patterns in history.”
— William J. O'Neil, How to Make Money in Stocks
What is a Cup and Handle pattern?
A Cup and Handle is a bullish continuation pattern with three parts: a rounded U-shaped base (the cup) lasting 7-65 weeks, a short pullback after the right rim (the handle) lasting 1-4 weeks, and a breakout above the cup rim on volume. Target is cup depth projected up from the rim.
How do I identify a valid cup?
Look for a rounded U-shape (not sharp V), cup duration between 7 and 65 weeks, cup depth between 15 and 35 percent, bottom roughly in the middle of the cup duration (not at either end), and a right rim that returns close to the left rim level (within 5 percent).
What is the handle?
The handle is a short pullback after price reaches the right rim. It usually lasts 1-4 weeks and pulls back less than 40 percent of the cup depth. The handle provides profit-taking by early buyers before the breakout wave.
How do I calculate the Cup and Handle target?
Measure cup depth (left rim price minus cup bottom price). Add that to the breakout price (or rim price). That is the measured-move target. For a cup with rim Rs 100 and bottom Rs 80, depth is Rs 20. Target from a Rs 102 breakout is Rs 122.
Why does the handle need to be shallow?
A deep handle (more than 40 percent of cup depth) signals that sellers are regaining control. The pattern is evolving into something else — possibly a Head and Shoulders top or a failed base. Shallow handles preserve institutional buying pressure.
What is the success rate of Cup and Handle?
On NSE from 2019 to 2024, well-formed Cup and Handle patterns (all 6 quality criteria met, breakout volume above 30-day average) reach measured-move target roughly 70 to 75 percent of the time. Poor-quality cups fail close to 50 percent.
Can Cup and Handle form on weekly charts?
Yes. In fact, cups on weekly charts tend to be more reliable than daily because weekly charts filter out noise. A weekly cup of 30-50 weeks duration corresponds roughly to 150-250 daily sessions — the same pattern scaled up.
What is the difference between Cup & Handle and Rounding Bottom?
Both have U-shaped bases. Rounding Bottom has no handle — price just breaks out after the right rim. Cup and Handle has a distinct handle pullback before the breakout. The handle adds a final low-risk entry point; Rounding Bottom requires entry right at the rim without confirmation.
The Bottom Line
The Cup and Handle is not a relic from 1980s investing textbooks — it is a live, repeatable pattern on NSE stocks. Seven verified examples from 2019 to 2024 delivered follow-through of 27-72% in 30 sessions. The pattern works because it captures the mechanical signature of institutional accumulation: gradual decline, gradual recovery, brief profit-taking, decisive breakout. No panic buying, no distribution — just patient capital taking positions.
The key filter is the handle depth. Handles under 40% of cup depth preserve the buying pressure that makes the pattern work. Handles deeper than that often signal the pattern has mutated into something bearish. Volume confirmation on the breakout is the second critical filter — low-volume breaks fail half the time.
Scan your watchlist weekly for stocks that are back within 5% of their 6-12 month highs after a visible U-shaped correction. Those are cup candidates. Wait for the handle to form and the breakout to confirm. This routine, applied over a year on liquid large caps, typically surfaces 5-15 quality cups — more than enough for a position-trading strategy.
Risk Notice
Trading in equities, derivatives, and index products carries substantial risk of loss. The examples in this article are historical and do not guarantee future returns. Price data is sourced from NSE daily OHLC feeds; back-testing any strategy on your own data is essential before deploying capital. This content is educational only. It is not an investment recommendation, a tip, or a solicitation to trade any specific security. Consult a SEBI-registered advisor before acting on any information here. Size every trade at 1 percent of your total capital and never trade money you cannot afford to lose.