Most candlestick patterns are single-candle signals. A doji here, a hammer there — useful, but they represent one session of market activity. THREE WHITE SOLDIERS and THREE BLACK CROWS are different. These patterns span three full trading sessions, and that extended timeframe is exactly what makes them more reliable than almost any single-candle formation.
When three consecutive candles all tell the same story — sustained buying pressure or sustained selling pressure — the market is not just hinting at a reversal. It is demonstrating one in real time. This article breaks down both patterns with real NSE chart examples, strict identification rules, volume confirmation techniques, and the exact entry/stop-loss/target framework that professional traders use.
Quick Answer: Three white soldiers are three consecutive long bullish candles, each closing near its high and opening within the previous body — a strong bullish continuation signal. Three black crows are the bearish opposite: three long red candles, each closing near its low. Volume should increase with each successive candle.
Key Takeaways
- THREE WHITE SOLDIERS is a bullish reversal pattern: three consecutive long green candles, each opening within the previous body and closing progressively higher.
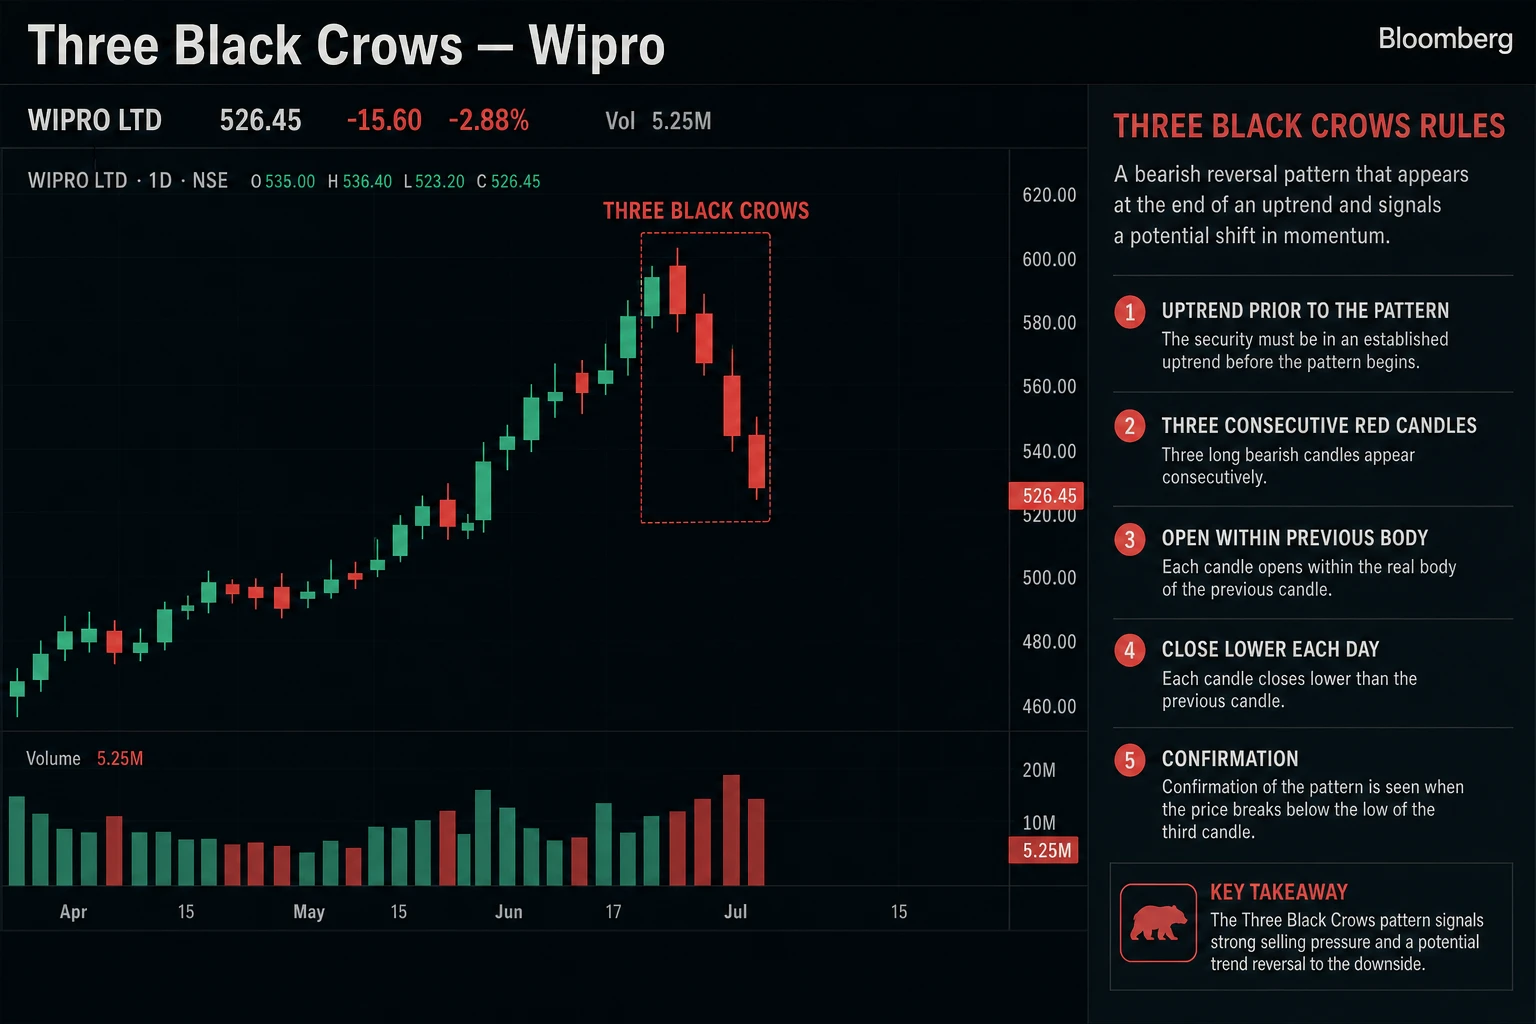
- THREE BLACK CROWS is the bearish mirror: three long red candles, each opening within the previous body and closing lower.
- Context matters more than the pattern itself — soldiers appearing after a clear downtrend at support carry far more weight than soldiers in the middle of nowhere.
- Volume should increase across all three candles. Flat or declining volume weakens the signal significantly.
- Watch for ADVANCE BLOCK (shrinking bodies) and DELIBERATION (small third candle) — these are weakened versions that often fail.
- The entry is above the close of the third candle. The stop loss goes below the low of the first candle. No exceptions.
What Are Three White Soldiers
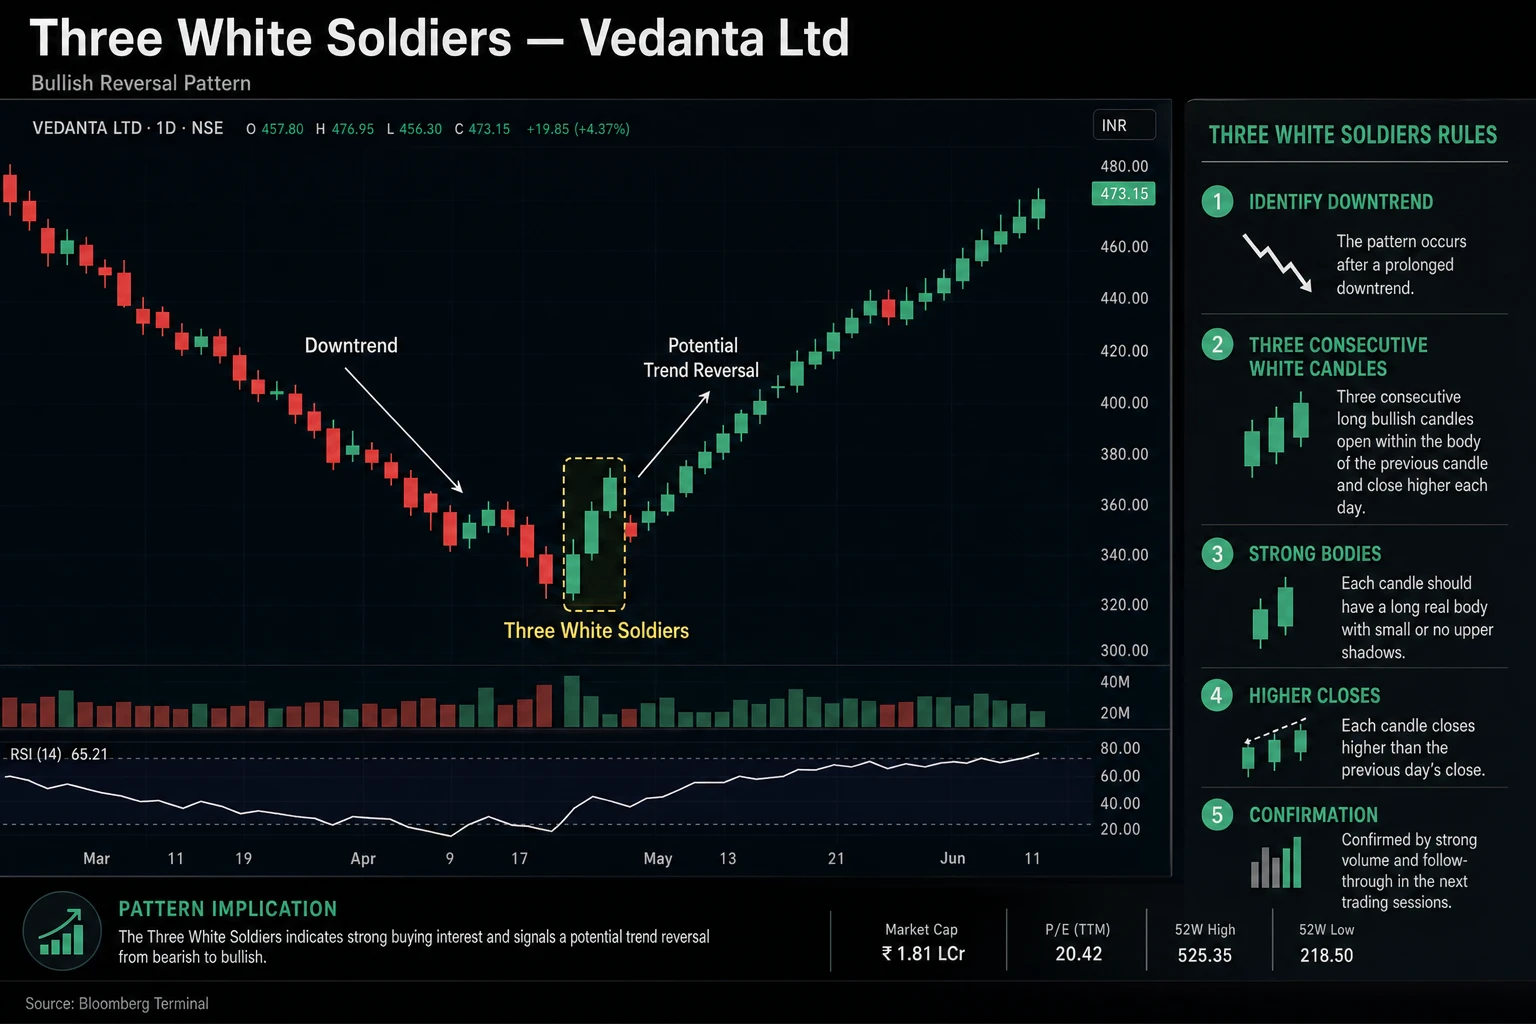
THREE WHITE SOLDIERS is a bullish reversal candlestick pattern consisting of three consecutive long-bodied green (bullish) candles. The pattern typically appears after a sustained downtrend and signals that buying pressure has taken control of the market decisively.
The term “soldiers” is not accidental. Each candle represents a day where buyers marched the price higher, held their gains, and set the stage for the next day’s advance. Three days of this disciplined advance is what separates this pattern from random green candles.
Strict Identification Rules
- Three consecutive green candles — Each candle must close higher than it opened. No exceptions, no “almost green” candles.
- Each candle opens within the previous candle’s body — Candle 2 opens somewhere between Candle 1’s open and close. Candle 3 opens within Candle 2’s body. This overlap is critical.
- Each candle closes progressively higher — Close 1 < Close 2 < Close 3. The price must be making higher closes across all three sessions.
- Long bodies with minimal upper wicks — The real body should occupy at least 60% of the total candle range. Long upper wicks suggest sellers are fighting back.
- Consistent body sizes — All three candles should have roughly similar body sizes. If bodies shrink progressively, that is an ADVANCE BLOCK, not true soldiers.
What Are Three Black Crows

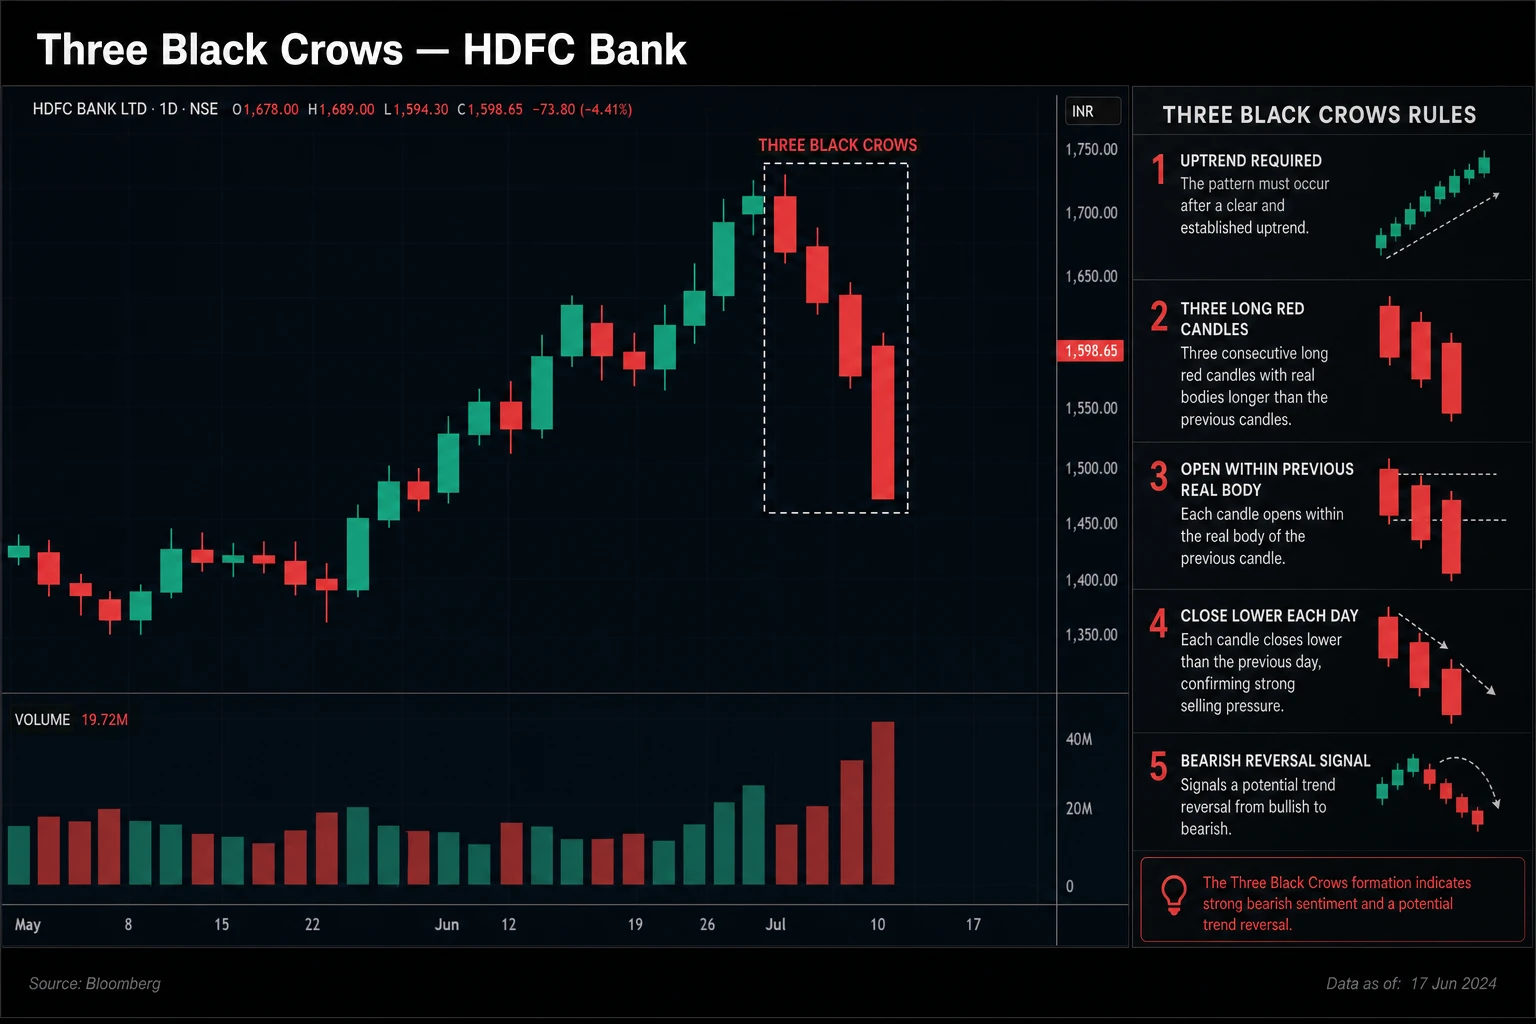
THREE BLACK CROWS is the exact bearish mirror of Three White Soldiers. It consists of three consecutive long-bodied red (bearish) candles, typically appearing after an uptrend. Where soldiers march prices higher, crows drive prices relentlessly lower across three sessions.
The “crows” metaphor comes from the idea of dark birds sitting on a branch — an omen of bad news ahead. In trading terms, three sessions of sustained selling pressure after a rally is exactly that kind of omen.
Identification Rules for Three Black Crows
- Three consecutive red candles — Each closes lower than it opened.
- Each candle opens within the previous candle’s body — Candle 2 opens between Candle 1’s open and close. Candle 3 opens within Candle 2’s body.
- Each candle closes progressively lower — Close 1 > Close 2 > Close 3.
- Long bodies with minimal lower wicks — Sellers are in complete control. Short lower wicks mean there is no bounce-back buying.
- Consistent body sizes — Similar-sized bodies across all three candles. Shrinking bodies signal the selling pressure is fading.
The Psychology of Three-Session Conviction

A single bullish candle can be a fluke — a short squeeze, an overreaction to news, or simply random noise. But when buyers show up three days in a row and close higher each time, something fundamental has changed. The psychology behind Three White Soldiers breaks down session by session:
- Session 1: After a downtrend, buyers step in near support. The first strong green candle catches attention, but many traders dismiss it as a dead cat bounce.
- Session 2: The second candle opens within the first candle’s body (a small gap down or flat open that gets bought immediately). Sellers who were confident start getting nervous. Short positions begin to get squeezed.
- Session 3: By the third session, the message is clear. Sellers are capitulating, shorts are covering, and fresh buying enters. The third strong close confirms the reversal.
The same psychology works in reverse for Three Black Crows. Three consecutive sessions of selling conviction breaks the confidence of bulls. By the third red candle, late buyers who entered near the top are panic selling, accelerating the decline.
Where These Patterns Carry the Most Weight

Context is everything. A Three White Soldiers pattern appearing in the middle of a strong uptrend is meaningless — the trend was already bullish. The pattern carries weight only when it signals a CHANGE in direction.
High-Probability Locations for Three White Soldiers
- After a clear downtrend of at least 5-7 sessions
- Near a known support level
- At the lower Bollinger Band or oversold RSI territory
- After a pullback in a larger uptrend (continuation signal)
- Near a Fibonacci retracement level (38.2%, 50%, or 61.8%)
High-Probability Locations for Three Black Crows
- After a clear uptrend of at least 5-7 sessions
- Near a known resistance level
- At the upper Bollinger Band or overbought RSI territory
- After a rally into supply zones
- Near round-number resistance (like Nifty 50 at 22,000 or Bank Nifty at 50,000)
Volume Confirmation: The Make-or-Break Factor
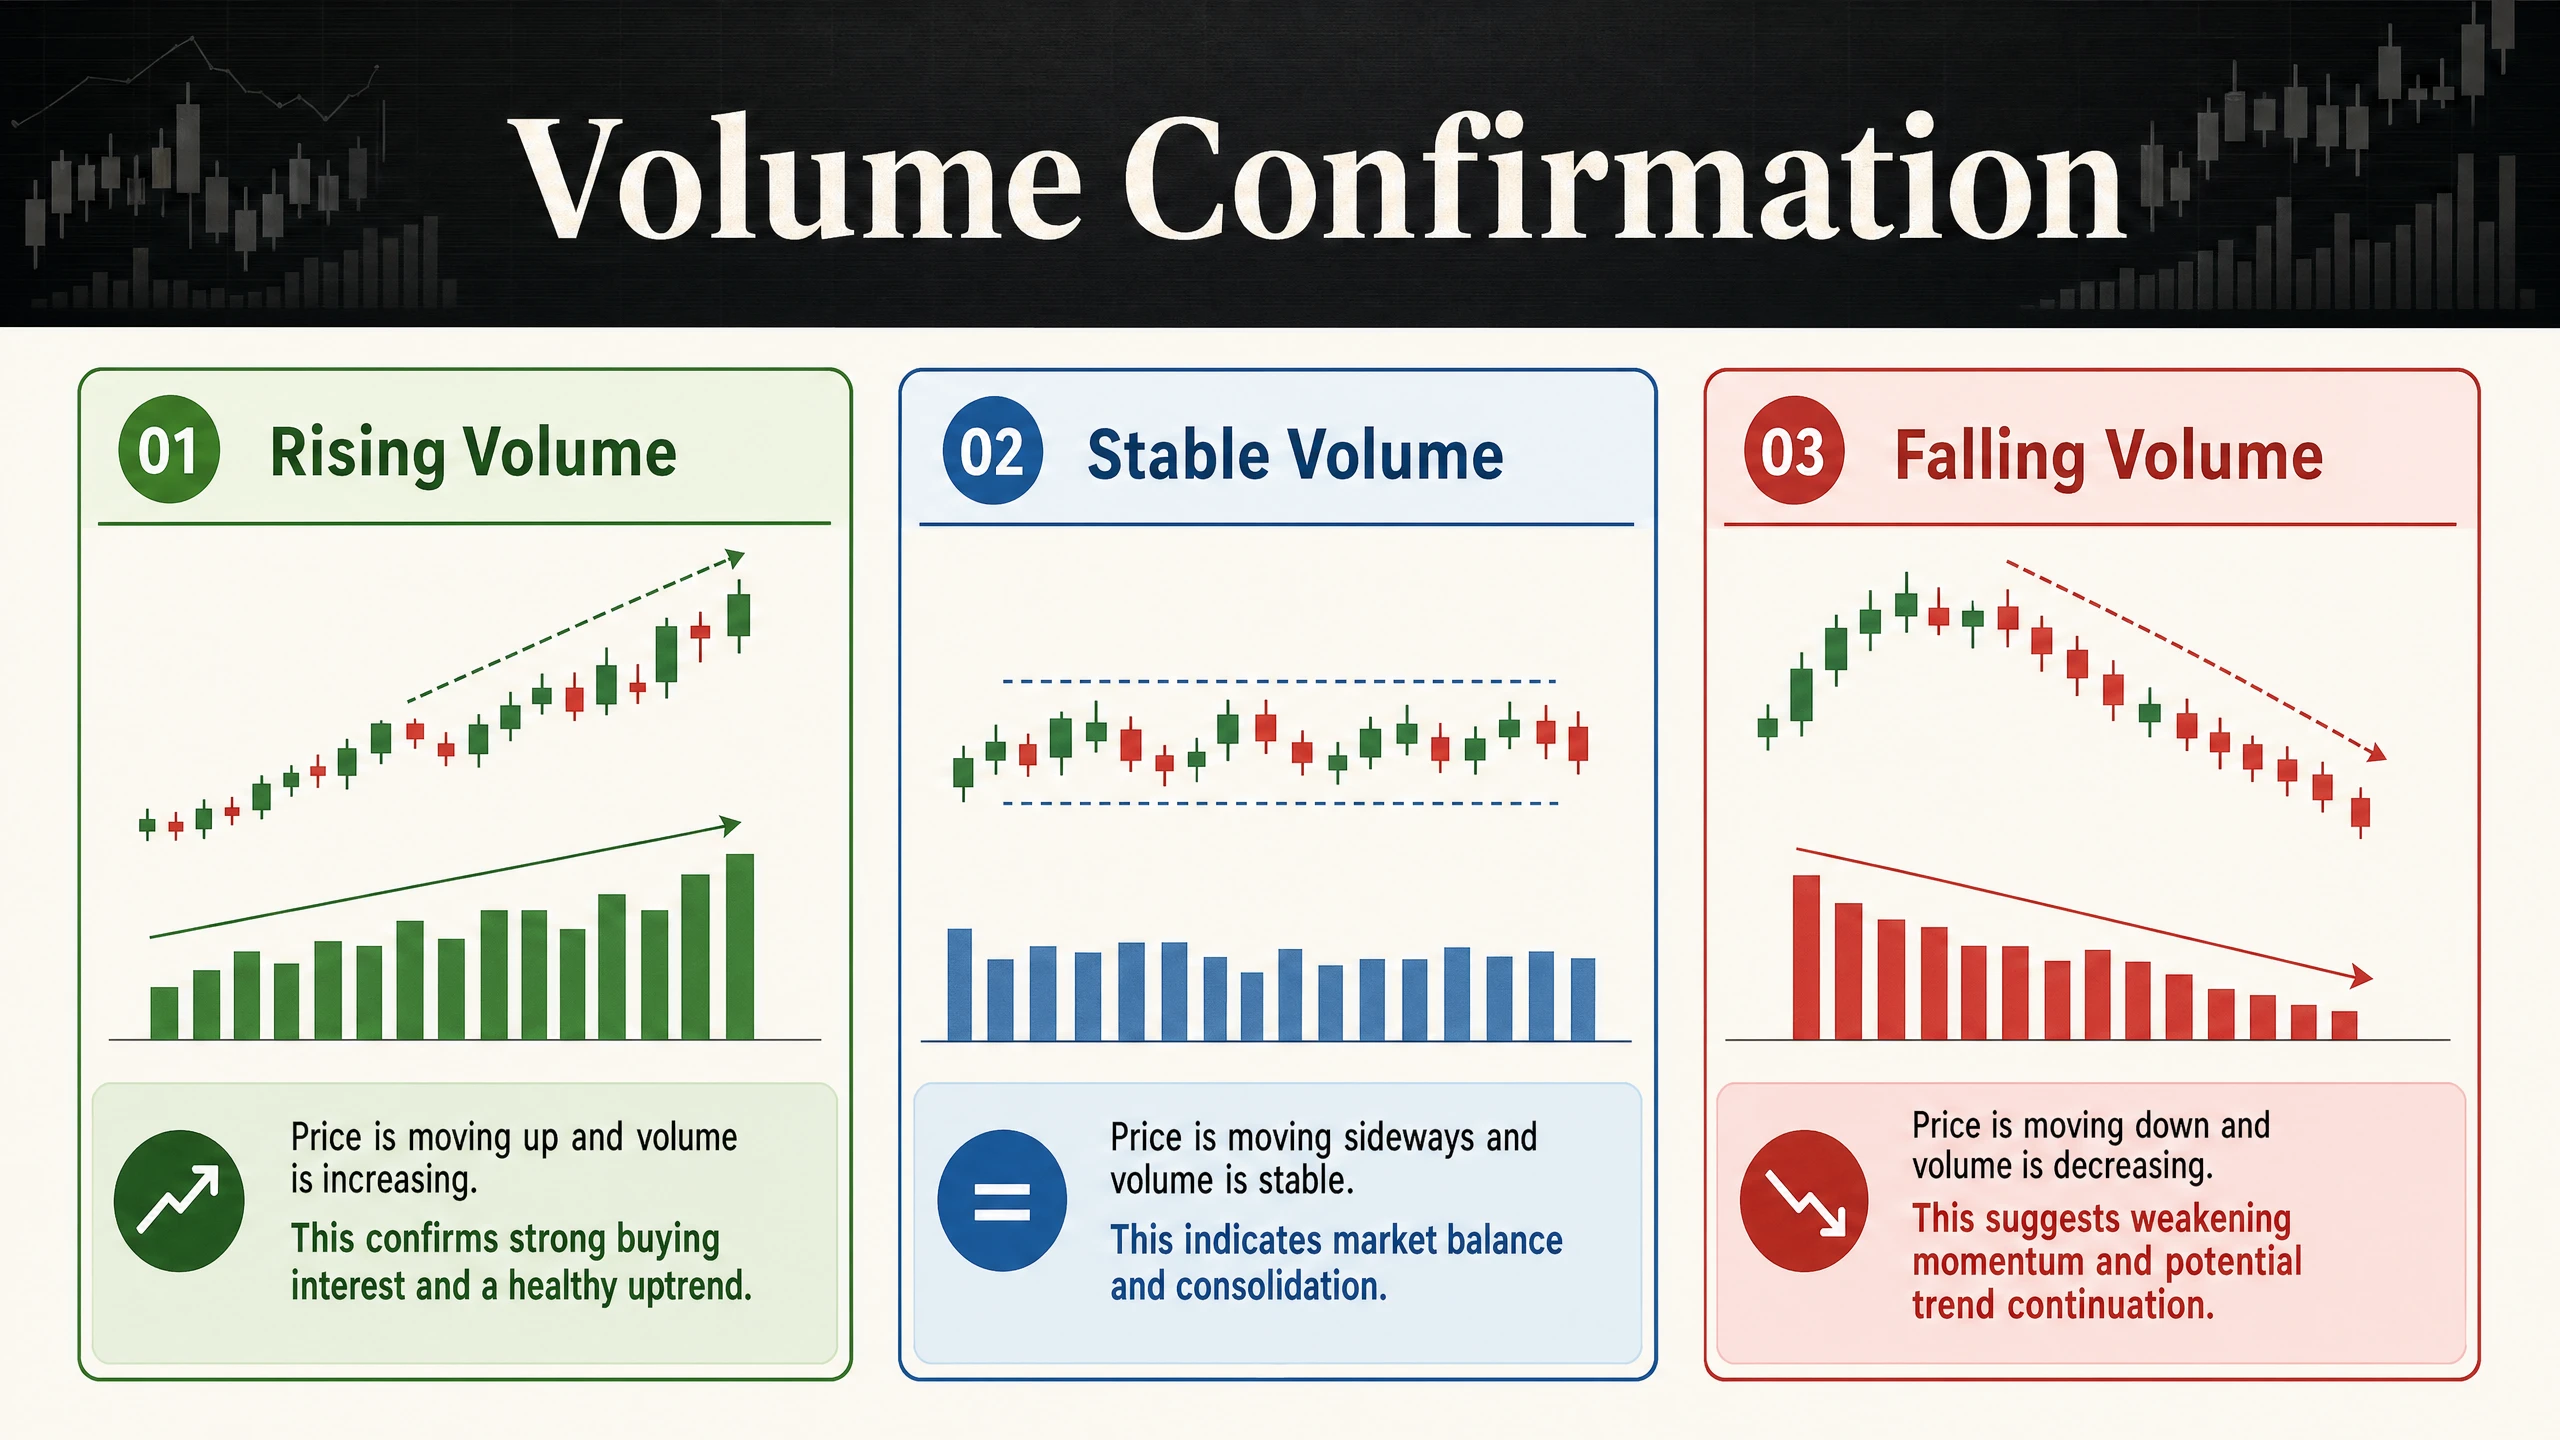
Volume separates genuine Three White Soldiers from weak imitations. The ideal volume profile across the three candles tells a specific story:
- Candle 1 volume: Above average — this is the initial spark that draws attention.
- Candle 2 volume: Equal to or higher than Candle 1 — confirms that the buying is not fading.
- Candle 3 volume: The highest of the three — institutional participation and short covering create a volume climax.
If volume decreases across the three candles, treat the pattern with extreme caution. Declining volume means fewer participants are driving the move higher, and the reversal may not sustain. This is one of the most common reasons Three White Soldiers patterns fail — the candles look right, but the volume story is wrong.
The same principle applies to Three Black Crows. Increasing volume across the three red candles confirms genuine selling pressure. Declining volume on the crows suggests sellers are running out of ammunition.
Advance Block and Deliberation: The Weakened Variations
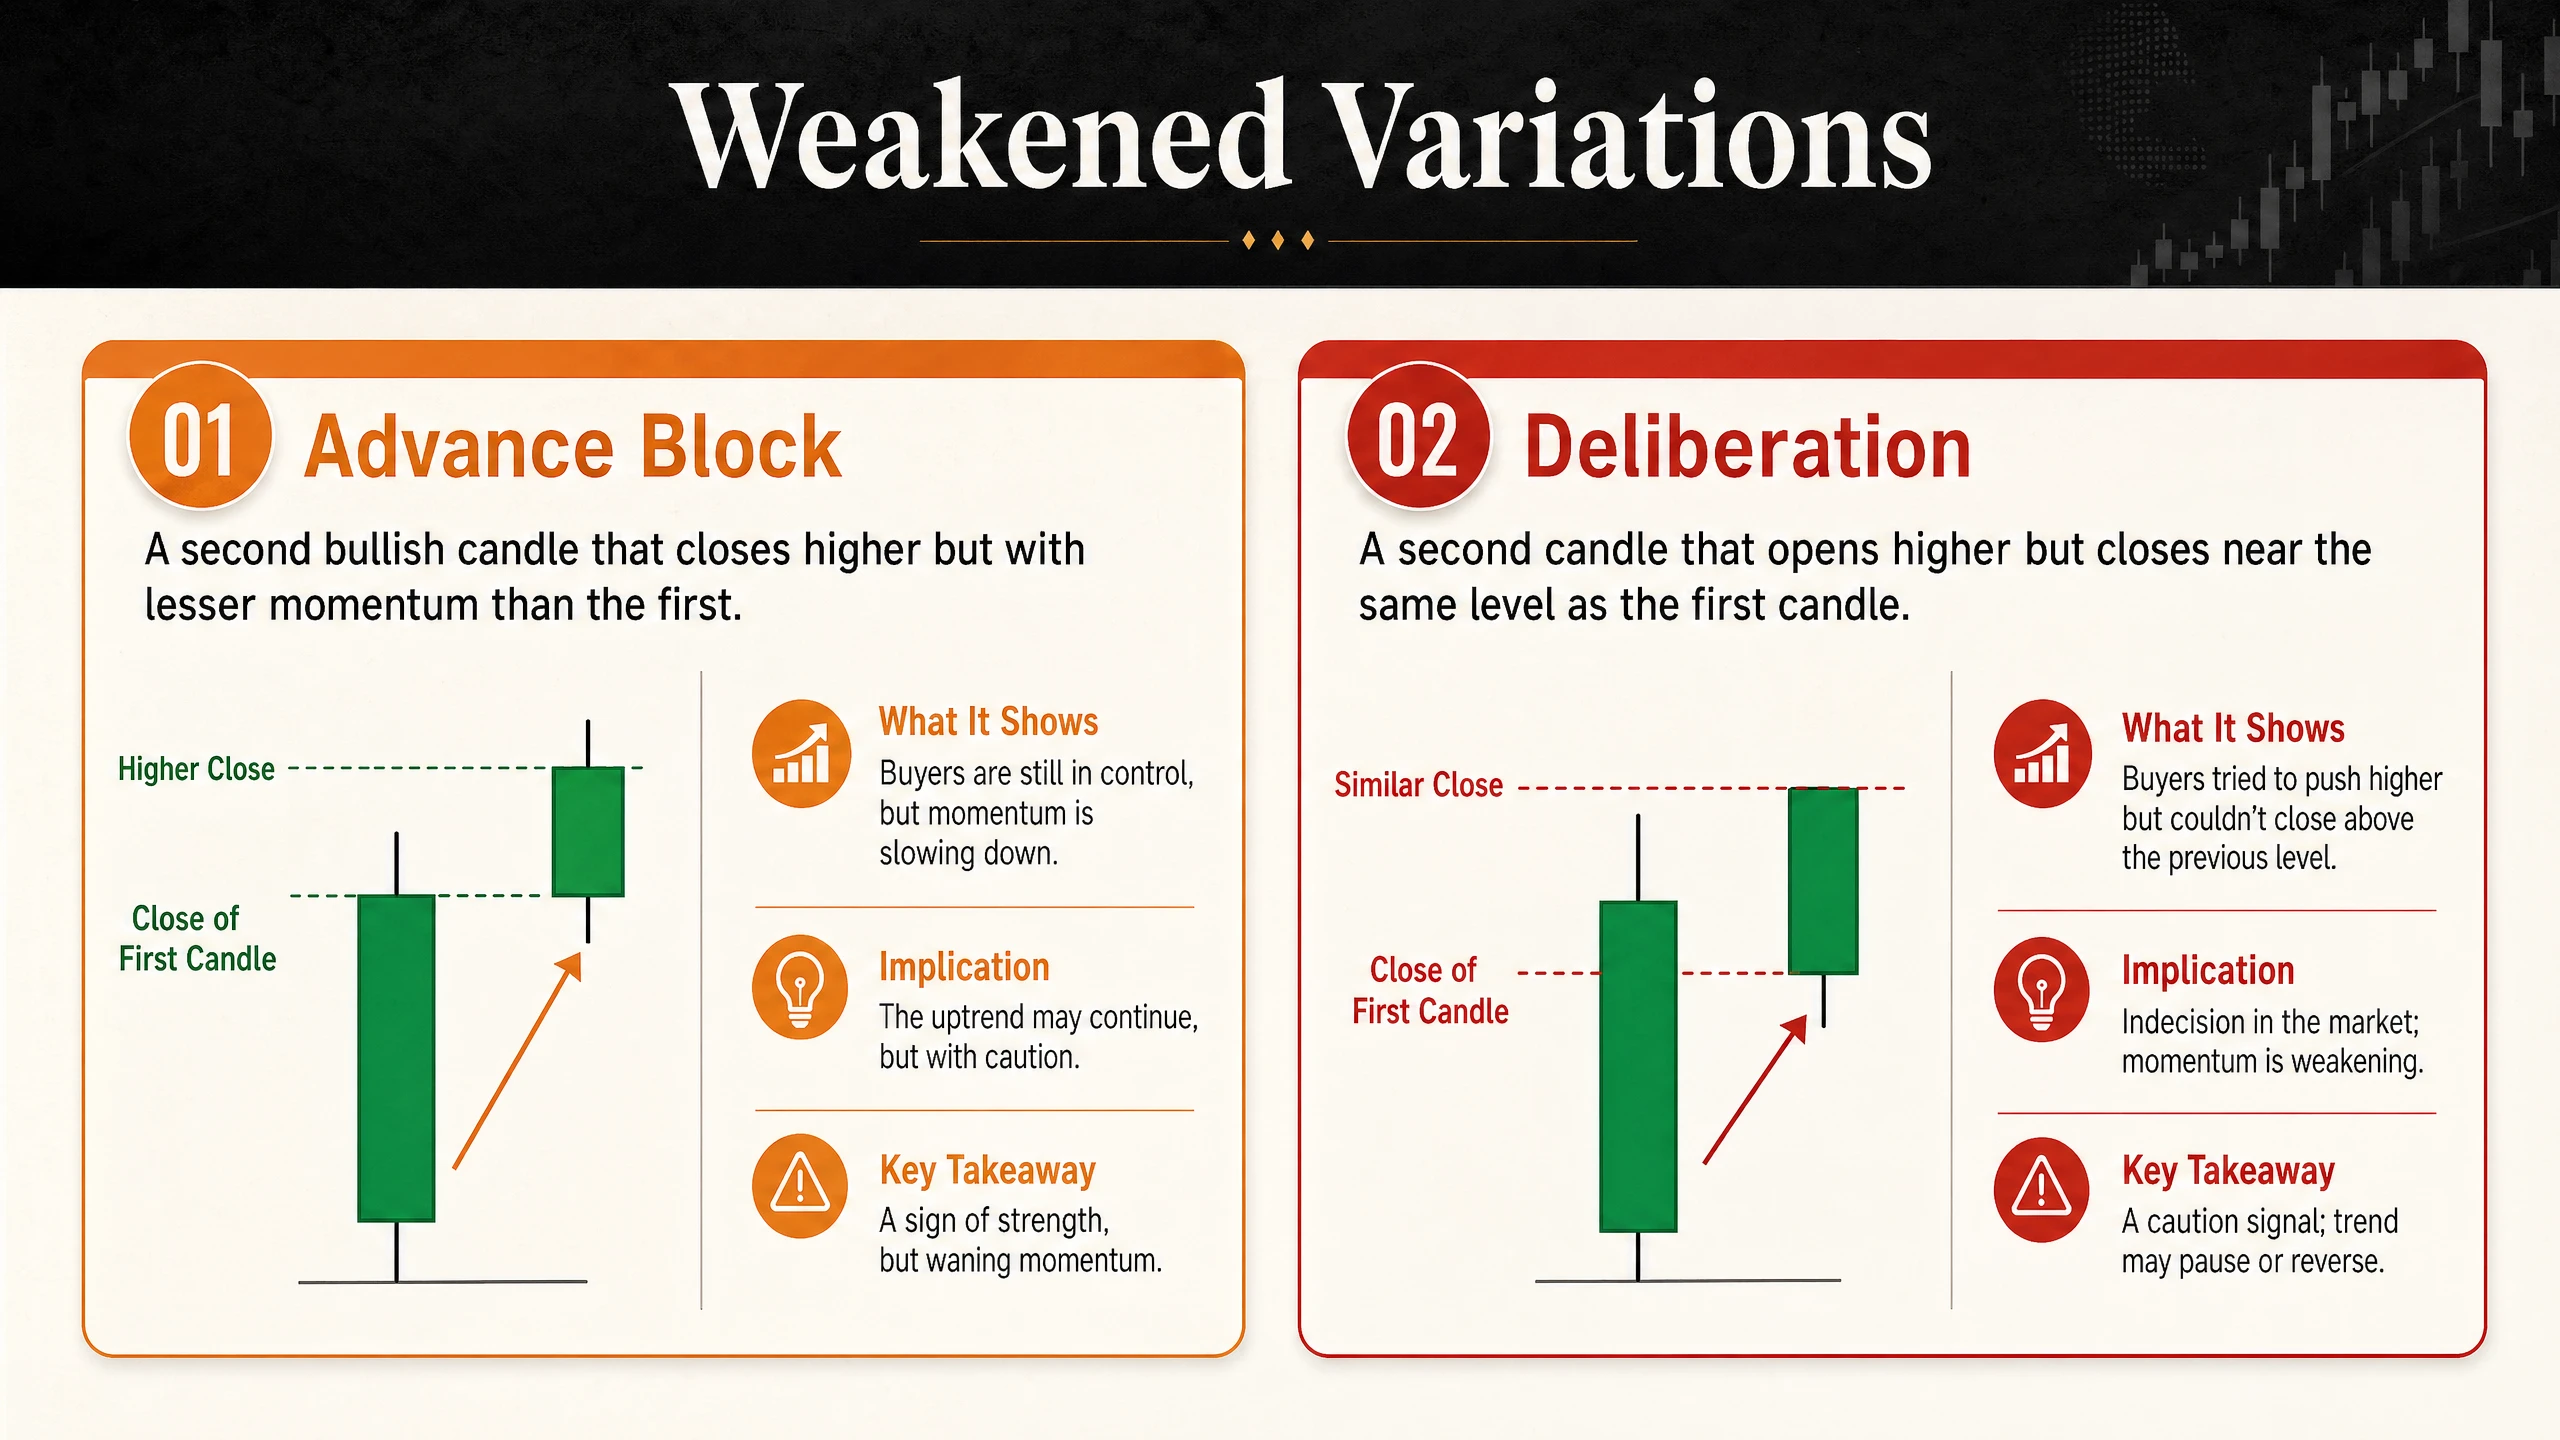
Not every set of three green candles is a true Three White Soldiers pattern. Two common variations look similar but carry a fundamentally different message:
Advance Block
An ADVANCE BLOCK forms when the three green candles have progressively SHRINKING bodies. The first candle has the largest body, the second is smaller, and the third is the smallest. This pattern suggests that while buyers are still in control, their conviction is fading with each session. The upper wicks on Candles 2 and 3 tend to be longer, showing sellers are beginning to resist.
An Advance Block is NOT a buy signal. It warns that the bullish move is losing steam and a reversal or consolidation may follow. Traders who enter long on an Advance Block thinking it is Three White Soldiers often get trapped.
Deliberation Pattern
The DELIBERATION pattern (also called a stalled pattern) has two strong green candles followed by a third candle with a significantly smaller body — often a spinning top or small-bodied candle. The first two candles show strong conviction, but the third candle shows indecision.
When the third candle opens near the second candle’s close but barely moves higher, it signals that buyers have hit a wall. The deliberation pattern often appears just below resistance levels and frequently precedes a pullback or sideways consolidation.
How These Patterns Compare with Other Multi-Candle Formations

| Pattern | Candles | Signal | Reliability | Volume Need |
|---|---|---|---|---|
| Three White Soldiers | 3 long green | Bullish reversal | High | Increasing |
| Three Black Crows | 3 long red | Bearish reversal | High | Increasing |
| Morning Star | 3 (red + small + green) | Bullish reversal | High | High on 3rd candle |
| Evening Star | 3 (green + small + red) | Bearish reversal | High | High on 3rd candle |
| Bullish Engulfing | 2 | Bullish reversal | Medium-High | High on 2nd candle |
| Advance Block | 3 shrinking green | Weakening bulls | Medium | Declining |
| Deliberation | 2 strong + 1 small | Stalling | Medium | Low on 3rd |
Three White Soldiers and Three Black Crows have an edge over two-candle patterns like engulfing patterns because the third candle provides additional confirmation. The extra session reduces the odds of a false signal, but it also means traders enter later in the move. This trade-off between reliability and early entry is fundamental to multi-candle pattern trading.
Common Mistakes Traders Make
- Ignoring context: Three green candles in the middle of an uptrend are just trend continuation, not a reversal pattern. Soldiers must appear after a downtrend to qualify.
- Accepting short bodies: Candles with small bodies and long wicks do not qualify. The body must be at least 60% of the total range for each candle.
- Skipping volume analysis: Pattern recognition without volume confirmation is incomplete. Declining volume across the three candles is a warning sign, not a buy signal.
- Confusing Advance Block with soldiers: If the bodies are shrinking, it is an Advance Block — a bearish warning, not a bullish signal. Measure the body sizes before entering.
- Trading the pattern in isolation: Three White Soldiers work best when combined with other tools — support/resistance, RSI oversold/overbought, or moving average proximity.
- Setting stop loss too tight: The stop must go below the low of the first candle. Traders who use tighter stops get stopped out by normal volatility.
Trading Three White Soldiers: Entry, Stop Loss, and Target
Here is the exact framework for trading a confirmed Three White Soldiers pattern. This same framework applies in reverse for Three Black Crows (short entry).
Entry
- Wait for the third candle to close. Do NOT enter during the formation.
- Enter long above the close of the third candle — either at market open on the fourth day or on a small pullback to the third candle’s close.
- Some conservative traders wait for the fourth candle to close green as confirmation. This reduces risk but also reduces reward.
Stop Loss
- Place the stop loss below the low of the FIRST candle in the pattern.
- This is non-negotiable. The first candle’s low is the invalidation level — if price falls below it, the pattern has failed.
- For wider stops (large candles), consider position sizing to keep risk at 1-2% of trading capital.
Target
- Target 1: The nearest resistance level or previous swing high.
- Target 2: 1.5x to 2x the risk (distance from entry to stop loss).
- Trail the stop loss once the price moves 1:1 in favor. Move the stop to breakeven and let the trend run.
Real Chart Examples from NSE
Textbook patterns are clean. Real charts are messy. Here are actual instances of these patterns found in NSE stock data, showing how the patterns look in practice rather than in theory.
Three White Soldiers on Maruti Suzuki
Maruti Suzuki (NSE: MARUTI) (MARUTI) formed a textbook Three White Soldiers pattern on the daily chart in September 2023. After trading in a range near the ₹9,600-9,800 zone, three consecutive strong bullish candles pushed the price above ₹10,300. Volume increased progressively across all three sessions. The stock continued higher for several weeks after the pattern completed.
Three Black Crows on BHEL
BHEL formed a clear Three Black Crows pattern in October 2024. After a rally that took the stock above ₹250, three consecutive long red candles dropped the price to ₹224. Volume expanded significantly on each candle, confirming genuine institutional selling. The stock continued to decline after the pattern.
Which Timeframes Work Best
Three White Soldiers and Three Black Crows are most reliable on the daily timeframe. Here is how the pattern performs across different timeframes:
- Daily chart (recommended): The pattern represents three full trading sessions. This gives enough time for genuine shifts in sentiment to develop.
- Weekly chart: Extremely powerful but rare. Three white soldiers on a weekly chart means three consecutive weeks of buying — a major trend change.
- 4-hour chart: Usable for swing traders on liquid stocks like Nifty 50 components. Volume data is essential on intraday timeframes.
- 15-minute and below: Too much noise. Three green candles on a 5-minute chart carry little significance because they represent just 15 minutes of action.
For most traders on NSE, stick with the daily chart. Open TradingView and scan Nifty 50 stocks on the daily timeframe — that is where these patterns generate the most actionable signals.
Combining with Other Technical Tools
No candlestick pattern should be traded in isolation. Here are the most effective combinations:
- Soldiers + RSI below 30: Three White Soldiers forming when RSI is in oversold territory is one of the highest-probability bullish setups.
- Crows + RSI above 70: The bearish mirror — Three Black Crows at overbought RSI levels.
- Soldiers + Support level: When the pattern forms right at a known support zone, the support level acts as a floor for the stop loss.
- Soldiers/Crows + EMA 50/200: Soldiers forming near the 50-day or 200-day EMA in an uptrend act as strong continuation signals.
- Volume + MACD crossover: If MACD crosses bullish during the soldiers formation, the signal is significantly strengthened.
The Uncomfortable Truth About These Patterns
Three White Soldiers and Three Black Crows look beautiful in textbooks. On real charts, they fail roughly 30-40% of the time, even when all identification rules are met. The pattern is not a guarantee — it is a probability edge. Traders who treat it as a certainty blow up accounts. Always use a stop loss, always manage position size, and never risk more than 1-2% of capital on any single pattern trade. SEBI data confirms that 93% of individual intraday traders lose money — patterns alone do not change those odds. Discipline does.
Scanning for These Patterns on NSE
Manual scanning across 500+ stocks on NSE is impractical. Here are systematic approaches to find these patterns efficiently:
Using TradingView Screener
Open TradingView and use the stock screener with candlestick pattern filters. Set the market to NSE, timeframe to daily, and filter for “Three White Soldiers” under the candlestick pattern section. The screener will return all stocks where this pattern formed on the most recent candles.
For Three Black Crows, apply the same screener with the bearish pattern filter. TradingView uses a strict definition that matches the identification rules described in this article — body size, wick ratio, and progressive closing levels are all factored in.
Manual Visual Scanning
Even with screeners, developing the ability to spot these patterns visually is essential. The best approach is to flip through Nifty 50 and Nifty Next 50 charts on the daily timeframe every evening after market close. These 100 stocks provide enough liquidity for any trading style and represent the majority of NSE trading volume.
Set up a watchlist with these stocks, open the daily chart for each, and look for any cluster of three consecutive same-color candles. Then apply the identification rules: body size, opening position, progressive closes, and volume profile. This daily scan takes 15-20 minutes once the routine is established.
Performance Across Different Timeframes
The reliability of these patterns changes dramatically across timeframes. Understanding where they work best — and where they generate false signals — is critical for any trader using multi-candle pattern recognition.
Weekly Charts
Three White Soldiers on a weekly chart is one of the most powerful reversal signals in technical analysis. Each candle represents an entire week of trading — so three soldiers means three consecutive weeks where buyers dominated from Monday to Friday. This level of sustained buying conviction is rare, and when it appears after a multi-week decline, it often marks the start of a significant trend reversal.
The same applies to Three Black Crows on weekly charts. Three consecutive weeks of selling pressure after a sustained rally is a serious warning that the trend has changed. Position traders and investors should pay particular attention to weekly chart formations because the signals here affect price action for weeks or months, not just days.
Hourly and 4-Hour Charts
For swing traders using 4-hour charts on highly liquid stocks (Reliance, HDFC Bank, Infosys, TCS), these patterns remain useful but require stricter confirmation criteria. Volume data becomes less reliable on intraday timeframes because institutional order flow gets distributed across the day, making volume spikes less meaningful.
On hourly charts, combine the pattern with VWAP analysis. Three White Soldiers forming above VWAP on the hourly chart suggest that the buying is happening at prices institutions are willing to accumulate at. Three Black Crows forming below VWAP confirm that sellers are in control at institutional price levels.
Sub-Hourly Charts
On 5-minute and 15-minute charts, these patterns lose most of their predictive power. Three candles on a 5-minute chart represent just 15 minutes of market activity — not enough time for genuine sentiment shifts to develop. The one exception is the opening 15-30 minutes of the trading session. Three White Soldiers on the 5-minute chart in the first 30 minutes after the 9:15 AM open can indicate strong directional intent for the day, but this is a specialized use case that should not replace the daily chart as the primary timeframe.
Position Sizing for Multi-Candle Pattern Trades
The stop loss for Three White Soldiers (below the first candle low) is often wider than single-candle pattern stops. This means position sizing becomes critical — a wider stop needs a smaller position to keep risk at 1-2% of trading capital.
Here is the calculation for a typical trade:
- Calculate risk per share: Entry price minus stop loss. For example: entry at ₹560, stop loss at ₹520 = ₹40 risk per share.
- Define maximum risk: 1-2% of trading capital. On a ₹5,00,000 account, that is ₹5,000 to ₹10,000.
- Calculate position size: ₹10,000 divided by ₹40 risk = 250 shares maximum.
- Check exposure: 250 shares at ₹560 = ₹1,40,000. That is 28% of capital in one position, which is acceptable for a high-conviction signal.
If the stop loss is too wide relative to account size, the pattern is not tradeable with that account. Never widen risk tolerance just because the pattern looks perfect. Risk management overrides pattern recognition every single time.
Backtesting Results: What the Data Shows
Thomas Bulkowski, the researcher who tested thousands of candlestick patterns on US market data, found that Three White Soldiers ranks among the more reliable multi-candle patterns. The pattern achieves a reversal rate of approximately 67-72% when proper identification rules are followed — meaning roughly two out of three patterns lead to continued upward movement over the following 10 trading sessions.
Three Black Crows shows similar reliability but with a slightly lower reversal rate of approximately 60-65%. Bearish reversals tend to be less clean than bullish reversals because selling is typically more emotional and volatile, leading to more whipsaw price action after the pattern completes.
These numbers come with a critical caveat: the statistics improve dramatically when context is factored in. Three White Soldiers appearing after a downtrend at support with increasing volume has a much higher success rate than the raw pattern statistics suggest. Conversely, soldiers appearing in random market conditions without proper context drag the average down.
How Institutional Traders Use These Patterns
Institutional traders — the FIIs (Foreign Institutional Investors) and DIIs (Domestic Institutional Investors) who move large amounts of capital — do not trade candlestick patterns in the same way retail traders do. But the patterns they create in the market reveal their activity, and understanding this provides an edge.
When Three White Soldiers forms on a large-cap stock like Reliance or HDFC Bank, the three-day accumulation visible in the pattern is almost always institutional. Retail traders do not have the buying power to create three consecutive sessions of sustained, high-volume price advance. The pattern is essentially a fingerprint of institutional accumulation.
Similarly, Three Black Crows on a liquid stock signals institutional distribution. Large funds rarely dump their entire position in one day — they distribute over multiple sessions, creating the steady, methodical selling that produces the three-crow pattern. This is why volume is so critical as a confirmation tool: institutional activity shows up in volume data before it shows up anywhere else.
Traders who understand this institutional angle can use the pattern not just as an entry signal, but as a confirmation that smart money is participating in the direction of the trade. A Three White Soldiers pattern with increasing volume at a support level, combined with FII buying data from NSE (available daily after market close), provides a multi-dimensional confirmation that retail traders rarely access.
Pattern Failure: What Happens When Soldiers and Crows Fail
No pattern works 100% of the time. When Three White Soldiers fails, the price typically reverses back below the low of the first candle within 3-5 sessions. Recognizing failure early is just as important as recognizing the pattern itself.
Signs That the Pattern Is Failing
- Fourth candle is a strong red candle: If the session immediately after the three soldiers opens gap-down or closes below the midpoint of the third soldier, the pattern may be failing.
- Volume spike on the reversal candle: If the fourth or fifth candle has significantly higher volume than the three soldiers, sellers have overpowered the buyers.
- Price falls below the second candle close: This is an early warning. If the price drops below where the second candle closed, the conviction demonstrated by the soldiers is being questioned.
- Price breaks below the first candle low: This is the stop loss level and the definitive failure point. The pattern is completely invalidated.
When a pattern fails, the resulting move in the opposite direction is often sharp and fast. This is because traders who entered long on the soldiers pattern are all exiting at the same time — their stop losses cluster at the first candle low, and the triggered stops accelerate the decline. This is why the stop loss is non-negotiable: without it, a failed soldiers pattern can turn a calculated trade into an open-ended loss.
Trading the Failure
Experienced traders sometimes trade the failure of Three White Soldiers as a short signal. If the pattern forms without volume confirmation and then the price drops below the first candle low, this becomes a bull trap. The traders who went long are now trapped, and their stop-loss selling provides fuel for a short trade.
This is an advanced technique that requires experience and discipline. The entry for the short trade is a break below the first candle low with volume. The stop loss goes above the third candle high. The target is at least 1:2 risk-reward.
Options Trading with These Patterns
F&O traders on NSE can use these patterns to time options entries. The high reliability and clear stop-loss levels make them suitable for defined-risk options strategies:
- Three White Soldiers confirmed: Buy a call option (ATM or slightly ITM) on the stock. The clear stop loss below the first candle low translates directly into an options exit level — exit the call if the stock price drops below that level.
- Three Black Crows confirmed: Buy a put option (ATM or slightly ITM). The resistance level above the pattern provides the invalidation point for the bearish thesis.
- Spread strategy: For traders with smaller capital, a bull call spread after Three White Soldiers limits risk to the premium paid while still capturing the upside move. A bear put spread works similarly for Three Black Crows.
- Avoid selling options against these patterns: Three White Soldiers and Three Black Crows often lead to extended moves. Selling premium against a confirmed multi-candle reversal pattern is fighting a strong trend — a losing proposition.
The key advantage of using options with these patterns is that the defined risk of options buying (limited to premium paid) aligns naturally with the wider stop-loss levels that multi-candle patterns require. A trader who cannot afford 250 shares at ₹560 can buy 1 lot of options for a fraction of the capital while maintaining the same directional exposure.
Real Talk: No chart pattern, indicator, or strategy works 100% of the time. The SEBI study showing 93% of F&O traders lose money is not a scare tactic — it is a filter. Most of that 93% traded without a stop-loss, sized positions too large, or chased signals without understanding context. Risk no more than 1-2% of capital per trade. Keep a trading journal. The market rewards patience and discipline — not speed or boldness.
Test What Traders Learned: Three White Soldiers and Three Black Crows
1. How many candles form a Three White Soldiers pattern?
2. Where should a Three Black Crows pattern appear for a valid bearish signal?
3. What invalidates a Three White Soldiers pattern?
4. What does increasing volume across the three candles confirm?
5. After a Three Black Crows pattern, the conservative entry approach is:
OrsLeo — Six blown accounts. Started with NTPC IPO in 2004, then a stock market website in 2007, made ₹50,000 in a single day on futures in 2017, and lost it all in the same day. A lot of hard-earned lessons between then and now.