Published January 4, 2026 · Last refreshed April 27, 2026. Prices and data are compiled with reasonable care — always confirm against your broker before trading.
The single most-asked question from new Indian traders is also the simplest: should I learn technical analysis or fundamental analysis? The answer depends entirely on what kind of trading or investing the person actually wants to do — and most beginners pick one approach without understanding what each method is built to answer.
Both methods study the same stocks but ask completely different questions. Technical analysis treats the chart as the ground truth and asks when to act. Fundamental analysis treats the financial statements as the ground truth and asks what to own. Neither is universally right. Both can be wrong. And the traders who consistently profit on the NSE understand exactly when to use each one.
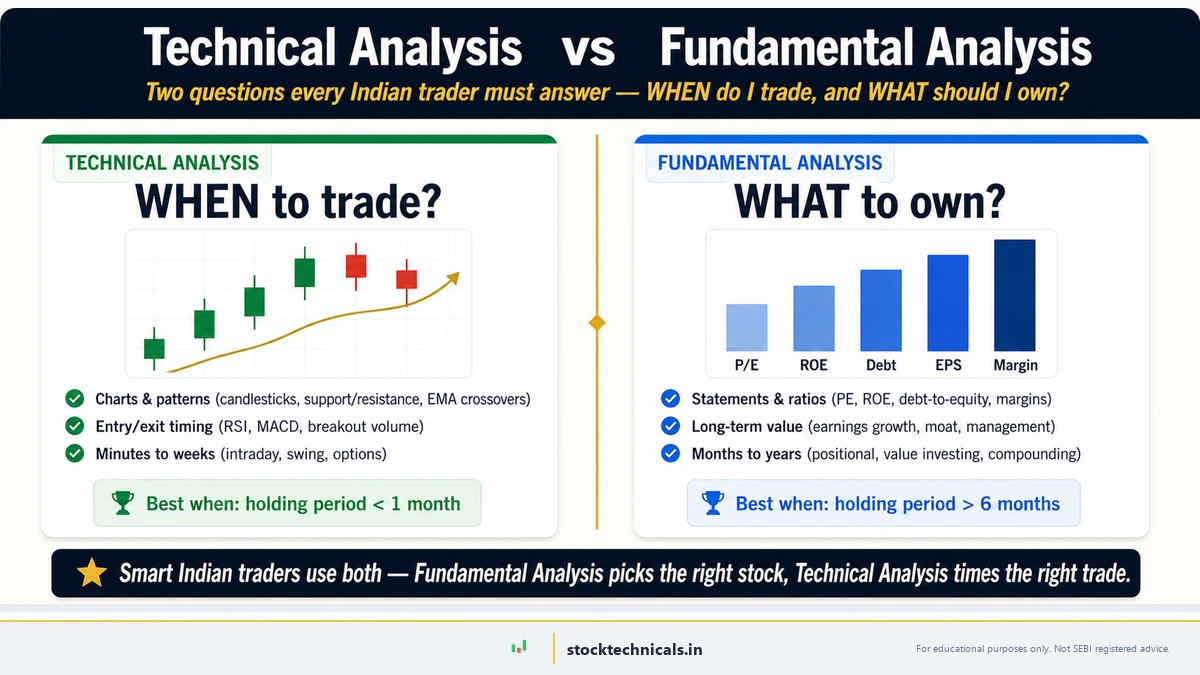
- Technical analysis answers WHEN to buy or sell (timing). Fundamental analysis answers WHAT to buy (selection)
- For intraday and swing trading, technicals dominate because price moves faster than earnings
- For long-term investing, fundamentals dominate because price eventually tracks business value
- Combining both is the professional approach: fundamentals to pick the stock, technicals to time the trade
- example: Reliance Industries on April 9, 2026 — fundamentally strong (PE 27.4, EPS ₹56) but technically weak (close ₹1,330, below all major EMAs, just bounced from ₹1,290 low). The combined approach handles exactly this kind of split-signal setup.
What Technical Analysis Actually Does
Technical analysis studies price and volume to predict future price movements. The core assumption is that everything known about a company — earnings, news, sentiment, institutional positioning — is already reflected in the chart. A technical trader does not need to read a quarterly report to decide whether to buy Reliance, because the price chart has already absorbed that information.
The toolkit includes candlestick charts, support and resistance levels, trendlines, trend identification, and indicators like RSI, MACD, and moving averages. Volume confirms or denies what price is showing. The output is a setup with a defined entry, stop loss, and target.
Technical analysis answers questions like: Is this stock in an uptrend or a downtrend? Where will buyers likely step in? Is volume confirming the move or warning about it? Is the trend likely to continue or reverse? These are timing questions, not quality questions.

What Fundamental Analysis Actually Does
Fundamental analysis studies a company’s financial health, growth prospects, competitive position, and valuation to determine its intrinsic worth. The core assumption is that price eventually reflects business value. If a company’s earnings keep growing and the price stays flat, the price is mispriced — and a fundamental analyst will buy and wait.
The toolkit includes balance sheets, profit and loss statements, cash flow statements, financial ratios (PE, debt-to-equity, return on equity), management quality, industry trends, and valuation methods. The output is a list of stocks worth owning at current prices, regardless of short-term chart movements.
Fundamental analysis answers questions like: Is this company profitable and growing? Is the management trustworthy? Is the stock cheap relative to its earnings? Will the business still be valuable in five years? These are quality questions, not timing questions.
For Indian traders, the standard fundamental tools are Screener.in for financial data and ratios, Trendlyne for analyst estimates, and the company’s own annual reports filed with SEBI. None of these tell a trader when to enter or exit — they tell the trader whether the company is worth holding for years.
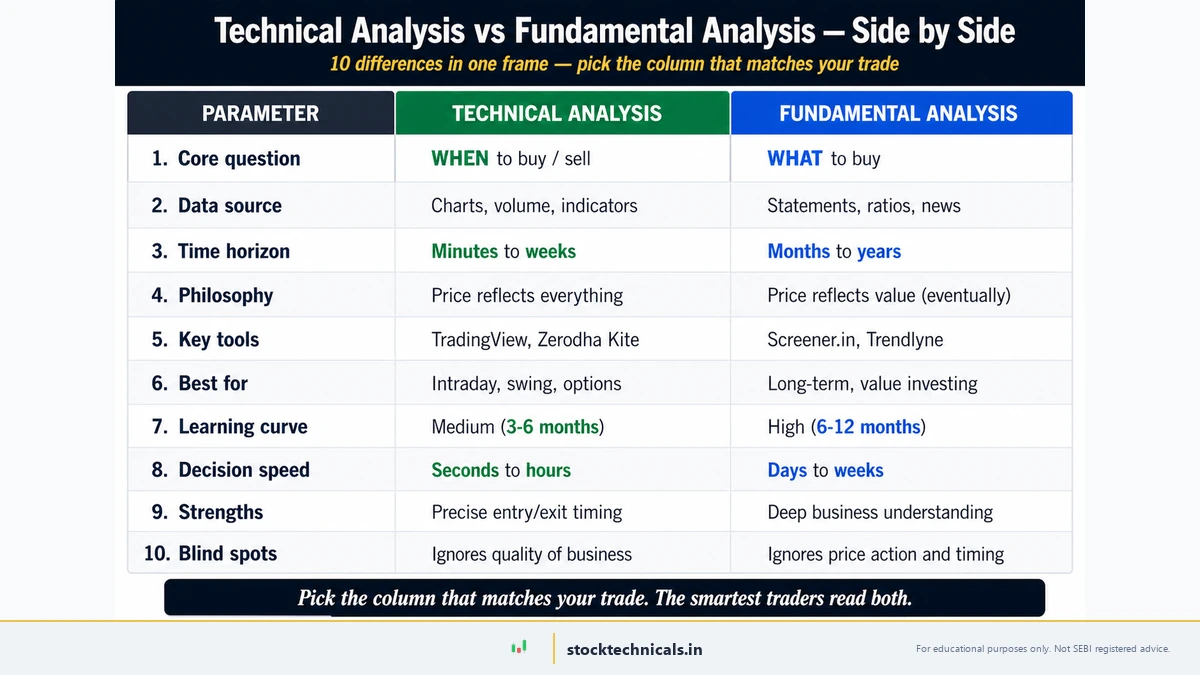
Core Differences Between Technical and Fundamental Analysis
The differences between the two methods go far beyond just “charts vs financial statements.” They diverge on time horizon, decision speed, data sources, and what they fundamentally optimise for.
Time Horizon
Technical analysis works on time horizons from seconds (scalping) to weeks (swing trading). Fundamental analysis works on time horizons from months (catalyst plays) to years (value investing). A technical trader holding a position for six months is unusual. A fundamental investor holding for less than a year is unusual.
Decision Speed
A technical analyst can make a buy or sell decision in seconds — the chart shows what the chart shows. A fundamental analyst takes hours or days to update a model after a quarterly result. This is why technicals dominate intraday and fundamentals dominate long-term investing — the methods are matched to different decision-making speeds.
What Each Method Ignores
Technical analysis ignores company quality. A chart pattern works the same on a great company and a fraud. Fundamental analysis ignores price action — a stock can have brilliant fundamentals and still fall 40% because the broader market is in a downtrend. Each method has a blind spot the other covers.
When Technical Analysis Wins
Technical analysis dominates in three specific contexts that fundamental analysis is structurally incapable of serving.
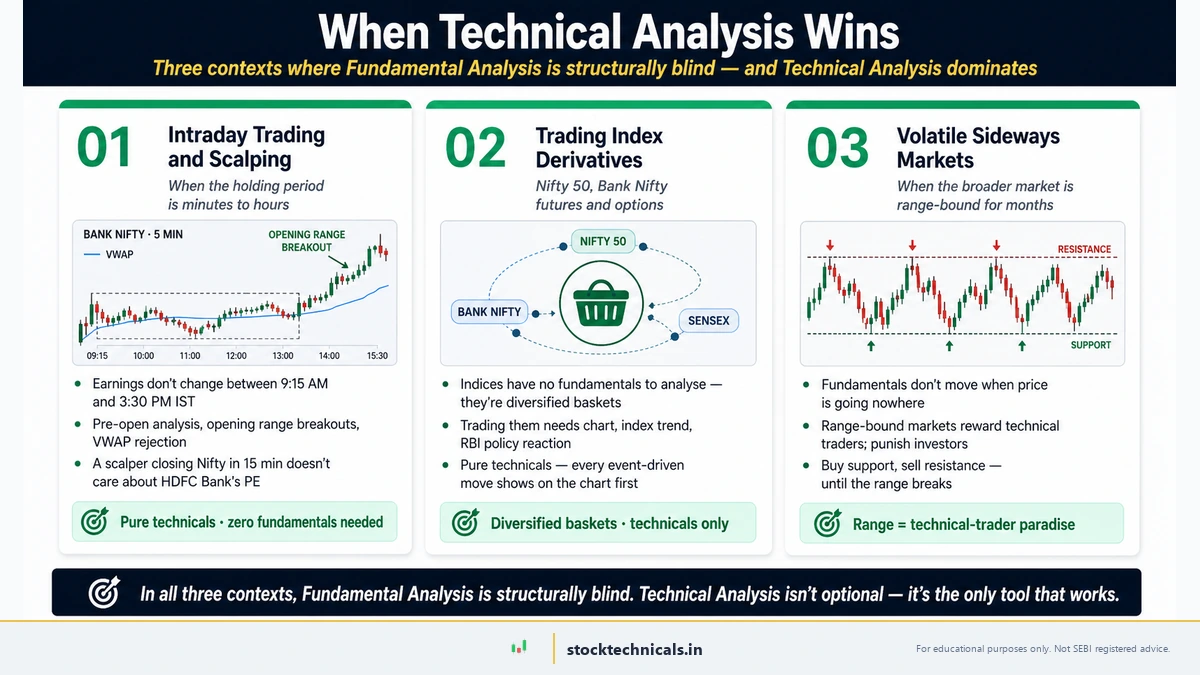
Intraday Trading and Scalping
When the holding period is minutes to hours, fundamentals are irrelevant because earnings do not change between 9:15 AM and 3:30 PM IST. Bank Nifty intraday traders rely entirely on technical patterns — pre-open analysis, opening range breakouts, VWAP rejection setups, and trend continuation entries. A scalper closing a Nifty 50 position in 15 minutes does not care about HDFC Bank’s PE ratio.
Trading Index Derivatives
Nifty 50 and Bank Nifty futures and options have no fundamentals to analyse — they are diversified baskets. Trading them requires understanding the chart, the index trend, and event-driven moves around RBI policy and global cues. Pure technicals.
Volatile Sideways Markets
When the broader market is range-bound for months, fundamental investors have nothing to trade — businesses don’t change quarterly. But technical traders can extract dozens of swing trades from the same range using support and resistance, RSI divergence, and pattern-based entries.
When Fundamental Analysis Wins
Fundamental analysis dominates in three contexts where technical analysis is structurally weak or actively misleading.
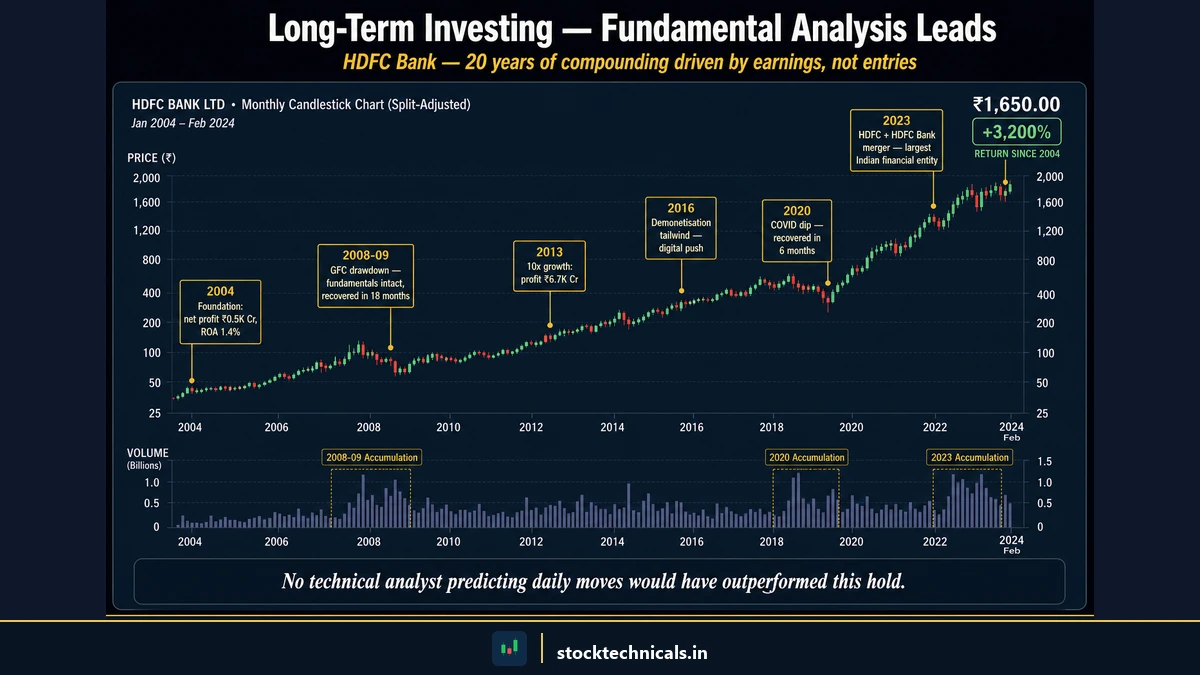
Long-Term Wealth Creation
Buying HDFC Bank in 2003 and holding for 20 years required no chart skills at all. The thesis was simple: India’s banking sector would grow with the economy, HDFC Bank had the strongest balance sheet, and earnings would compound. The stock multiplied many times over. No technical analyst predicting daily moves would have outperformed that hold.
Identifying Mispriced Stocks
When a fundamentally strong business trades at a low PE ratio because of temporary fear (a sector scandal, a regulatory scare, a one-time loss), fundamental analysis identifies the opportunity. Technical analysis only sees a downtrend and waits for a reversal signal — by which time the easy money is gone.
Capital Allocation Across Sectors
A fundamental investor decides which sectors to overweight based on macro views, regulatory changes, and earnings cycles. A technical trader follows price after the move has already started. For multi-year portfolio decisions, fundamentals provide the road map.
How Professional Traders Combine Both Approaches
The smartest traders don’t pick one approach — they layer both. The mental model is simple: fundamentals tell you WHAT to buy, technicals tell you WHEN to buy. This is called the confluence approach, and it dramatically improves win rates compared to either method alone.
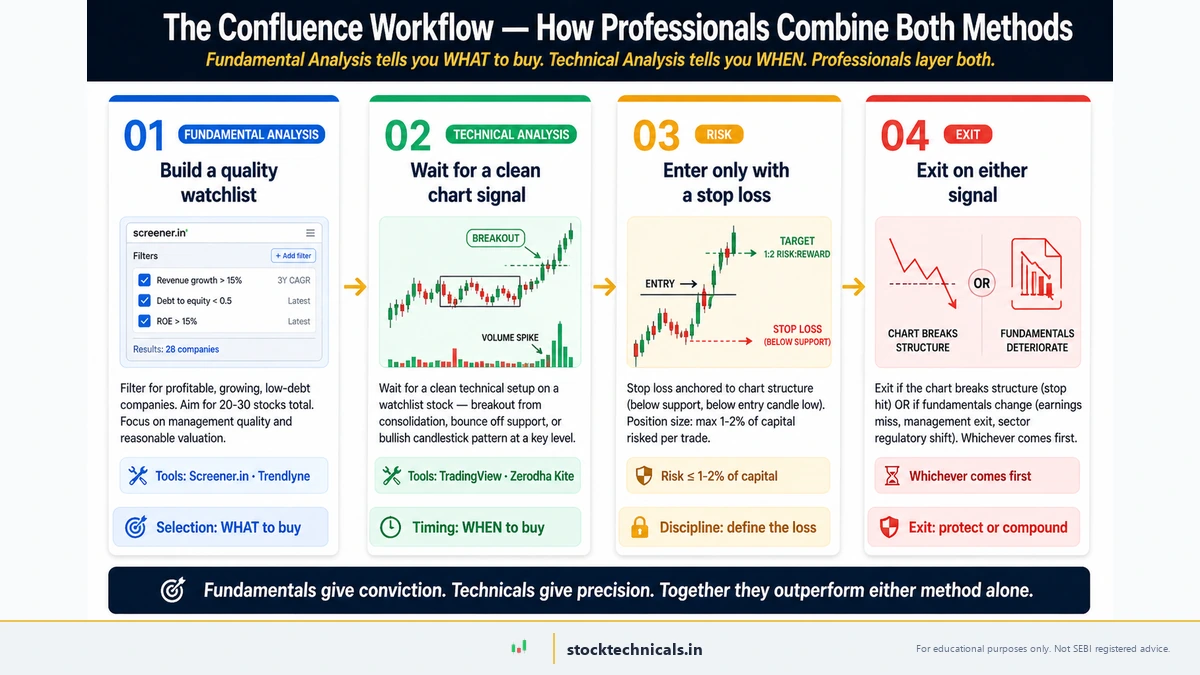
The professional workflow looks like this:
- Fundamental screen: Build a watchlist of 20-30 high-quality companies based on revenue growth, profitability, manageable debt, and reasonable valuation. Use Screener.in or Trendlyne to filter.
- Technical setup: Wait for one of those watchlist stocks to form a clean technical setup — a breakout from consolidation, a bounce off support, or a bullish candlestick pattern at a key level.
- Risk-defined entry: Enter only when the technical setup confirms, with a defined stop loss based on the chart structure (below support, below the entry candle low).
- Exit on technical OR fundamental change: Exit if the chart breaks structure (stop hit), or if the fundamental thesis changes (earnings miss, management exit).
Which Approach Fits Each Trading Style
Different trading styles require different ratios of technical to fundamental analysis. The chart below maps the typical mix across the most common types of trading on the NSE.
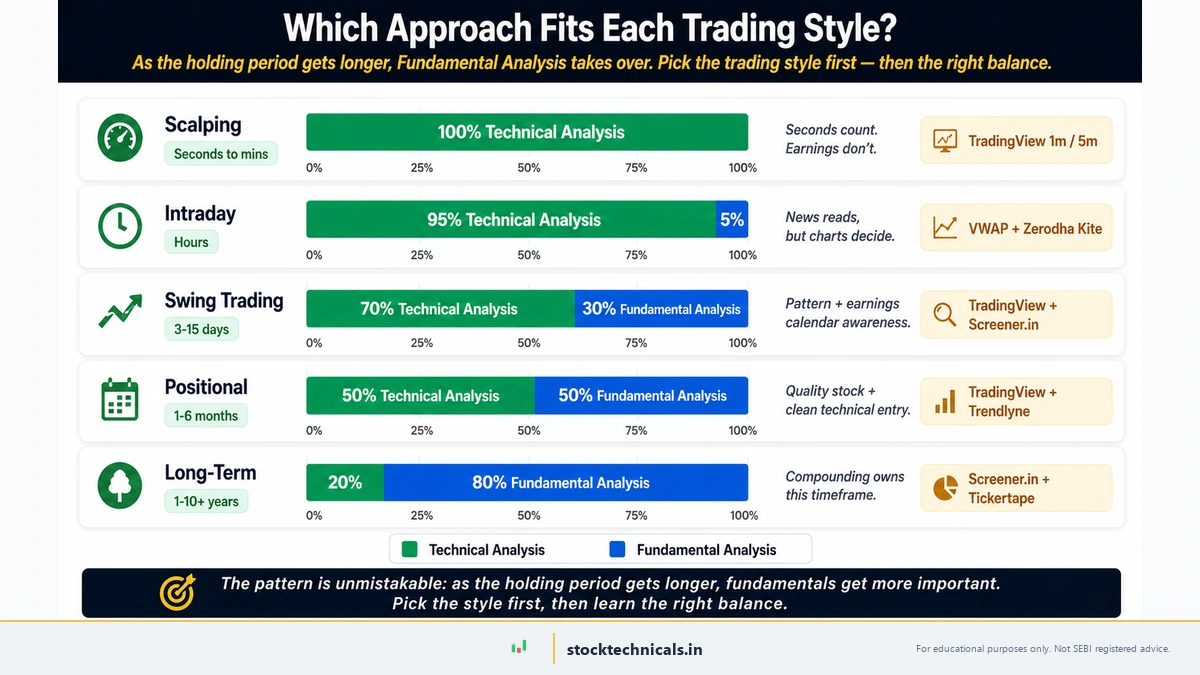
The pattern is unmistakable: as the holding period gets longer, fundamentals get more important. Scalpers and intraday traders are nearly 100% technical. Swing traders are mostly technical with some fundamental filtering. Positional traders split it roughly fifty-fifty. Long-term investors are dominated by fundamentals. Pick the trading style first, then learn the right balance.
Example — Reliance Industries Analysed Both Ways
The most effective way to understand the difference is to apply both methods to the same stock. Here is Reliance Industries (NSE: RELIANCE) viewed through both lenses, with all numbers verified as of April 9, 2026.
The Fundamental View
A fundamental analyst pulling Reliance Industries on Screener.in on April 9, 2026 sees:
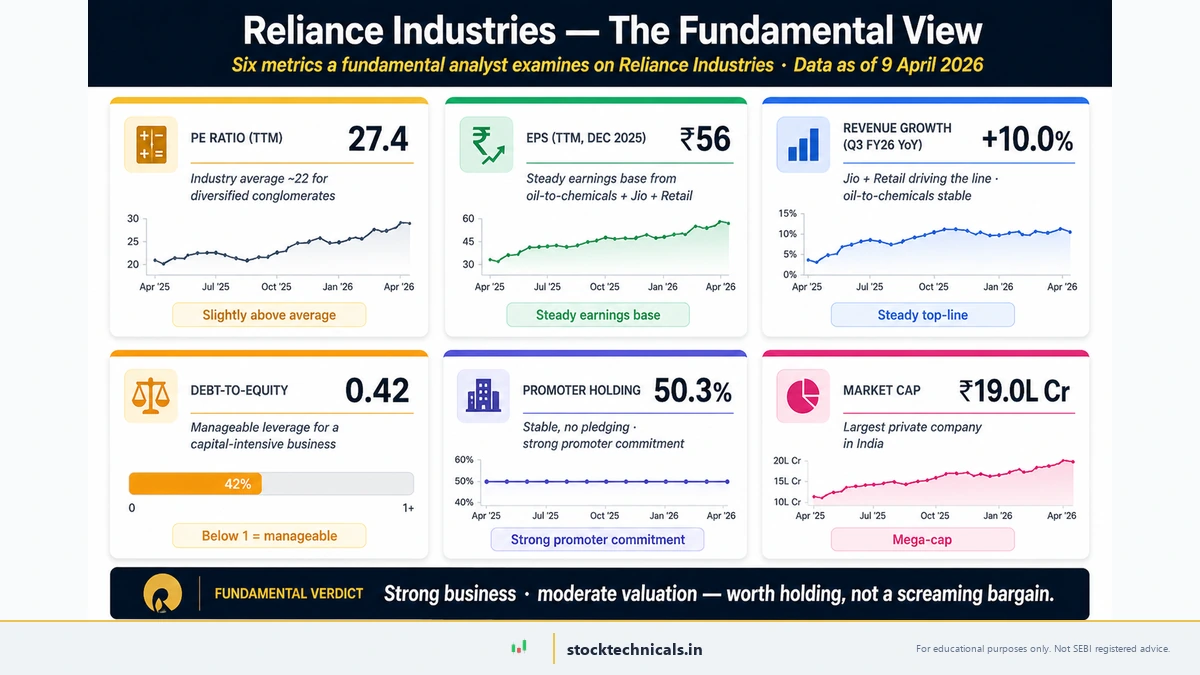
- Market cap: approximately ₹19.0 lakh crore (largest private company in India)
- PE ratio (TTM): 27.4 — moderate, slightly above the industry average of ~22 for diversified conglomerates
- EPS (TTM, Dec 2025): ₹56 — steady earnings base from oil-to-chemicals plus Jio plus Retail
- Revenue growth (Q3 FY26): +10.0% year-on-year — Jio and Retail driving the line, oil-to-chemicals stable
- Debt-to-equity: 0.42 — manageable leverage for a capital-intensive business
- Promoter holding: 50.3% — stable, no pledging, strong commitment
- Business segments: Oil-to-chemicals, digital services (Jio), retail — diversified revenue streams
The fundamental verdict: Reliance is a fundamentally strong company with diversified revenue, growing earnings, and manageable debt. The PE of 27.4 suggests it is neither undervalued nor grossly overvalued. A long-term investor could justify holding the stock, but it is not a screaming bargain at current levels.
The Technical View
A technical analyst opening Reliance on a charting platform on April 9, 2026 sees a very different story from the fundamentals:

- Current close: ₹1,330 — down roughly 17% from the 52-week high of ₹1,611 set on January 5, 2026
- EMA 20: ₹1,367 — price is below by about ₹37
- EMA 50: ₹1,399 — price is below by about ₹69
- EMA 200: ₹1,423 — price is below by about ₹93
- RSI (14): 41 — in the weaker half of the neutral zone, not yet oversold
- Recent action: Price broke the earlier ₹1,307 support on 6 April, printed a fresh 60-day low at ₹1,290, and has since bounced back to the ₹1,330 area
- 52-week range: ₹1,114 (April 2025) to ₹1,611 (January 2026)
The technical verdict: Reliance is in a short-term downtrend. The three EMAs are stacked bearishly (20 below 50 below 200) and price is below all of them — the classic downtrend structure. The first sign of a real turnaround would be a daily close above ₹1,367 (the EMA 20). A close above ₹1,399 (EMA 50) would confirm a trend change. Until then, the honest technical read is: wait, do not buy into the falling knife just because the chart "looks cheap".
What the Combined View Reveals
This is exactly the setup where combining both methods beats either one alone:
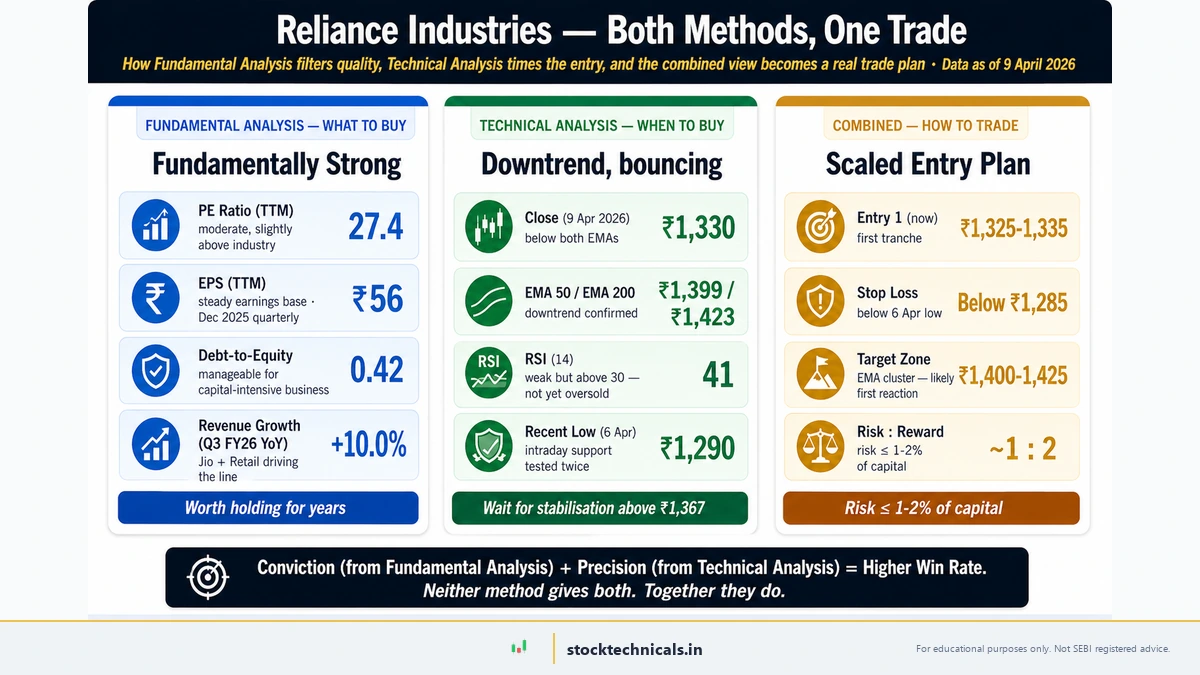
- Fundamentals say: The company is solid. PE 27.4 is fair, EPS ₹56 is steady, debt is manageable, promoter holding is stable at 50.3%, and revenue grew 10% year-on-year in Q3 FY26. This is a business worth owning for the long run.
- Technicals say: The chart is weak. Price is below every major moving average, the trend is down, support at ₹1,307 just broke, and the bounce from ₹1,290 needs to prove itself.
- Combined conclusion: A fundamental-only investor would buy the 17% dip on conviction alone and risk watching it fall further. A technical-only trader would stay out and miss the eventual recovery. The combined approach uses fundamentals to justify taking the position at all, and technicals to scale in carefully and manage risk.
A combined trader's plan might look like this: Enter one-third of the intended position size at the current ₹1,325–1,335 zone. Add another third on a daily close above ₹1,367 (EMA 20 reclaim — first bullish confirmation). Add the final third on a daily close above ₹1,399 (EMA 50 reclaim — trend change confirmed). Stop for the entire position: a daily close below ₹1,285, just under the 6 April swing low. First target: ₹1,400–1,425 (EMA 50 and 200 confluence). Risk-reward roughly 1:2 on the initial tranche.
This is something neither approach delivers alone. Fundamental analysis cannot tell a trader where to set the stop loss. Technical analysis cannot tell a trader whether the company is worth holding through the drawdown. Together, they provide both conviction and precision.
Tools for Technical and Fundamental Analysis
The tools differ as much as the methods themselves. A trader serious about either approach needs to master at least one platform from each column.
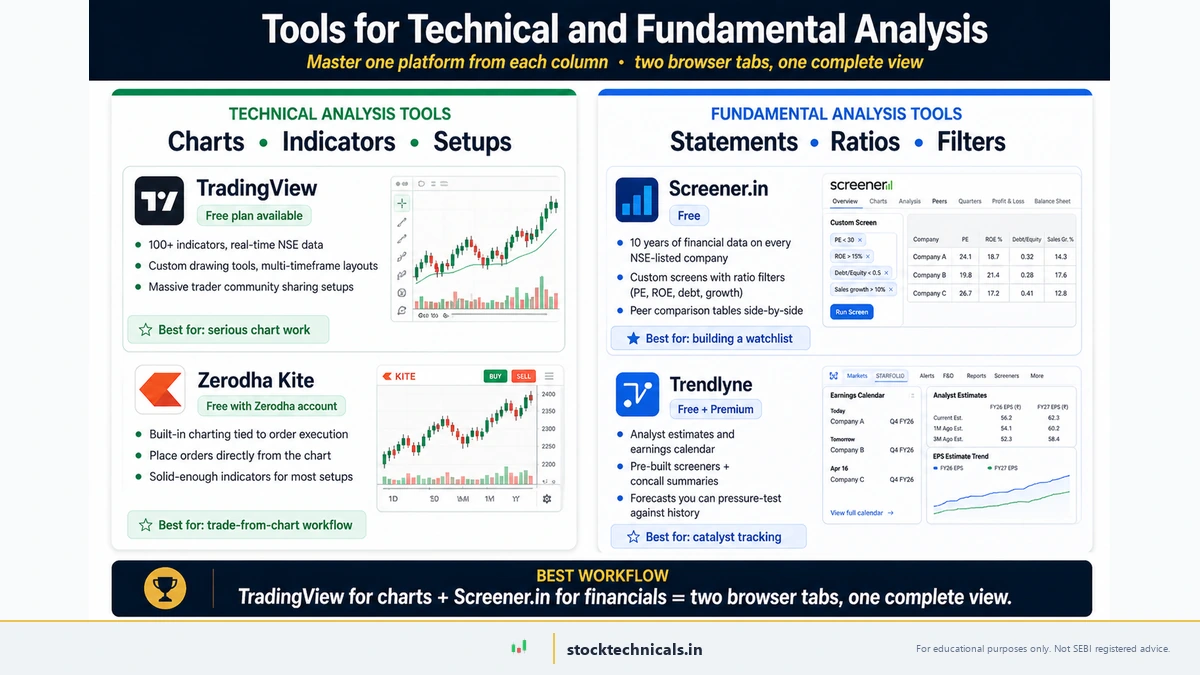
Technical Analysis Tools
TradingView is the global standard for charting, with 100+ indicators, real-time NSE data, custom drawing tools, and a massive community sharing setups. Most active Indian traders use the free plan or upgrade to a paid tier for multi-chart layouts. Zerodha Kite bundles charting with order execution — convenient if Zerodha is the broker. For a full walk-through of platform setup, see how to set up your first chart on TradingView.
Fundamental Analysis Tools
Screener.in is the most-used fundamental screening tool in India, with free access to 10 years of financial data on every NSE-listed company, custom screens, and ratio analysis. Trendlyne adds analyst estimates, peer comparisons, and concall summaries. Annual reports filed with SEBI are the source of truth — every serious fundamental analyst reads them directly rather than relying on summary websites.
What Each Tool Misses
A trader using only Screener.in will miss every chart-based opportunity. A trader using only TradingView will miss every fundamentally driven move. The overlap zone — high-quality companies forming clean setups — is where the highest-probability trades live.
Common Misconceptions That Cost Traders Money
Both camps suffer from the same problem: oversimplified beliefs that get repeated until people treat them as facts. Here are the misconceptions that cause the biggest losses.
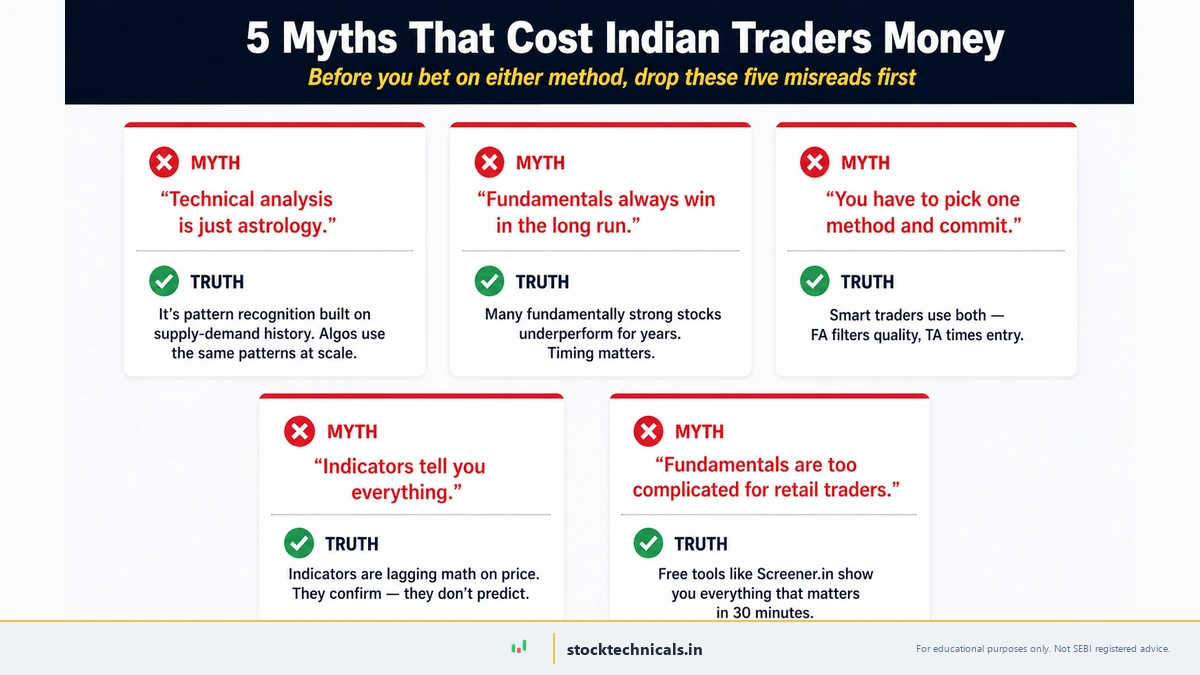
Myth: Technical Analysis Is Just Astrology
Reality: Technical analysis is structured pattern recognition based on supply and demand. Patterns repeat because human psychology — fear and greed — repeats. A bullish engulfing pattern at a major support level is not magic; it is a measurable shift from net selling to net buying that can be statistically validated.
Myth: Fundamentals Always Win in the Long Run
Reality: Fundamentally strong companies can underperform for years if the entry price was too high. Many investors who bought IT stocks at peak valuations in early 2022 are still underwater four years later. Fundamentals matter, but the entry price matters too — and technical analysis helps with the entry.
Myth: You Have to Pick One
Reality: The best traders use both. A purist on either side leaves money on the table. Combining the methods is not cheating — it is the most rational way to trade because each method covers the other’s blind spot.
Myth: Indicators Tell You Everything
Reality: Indicators are derived from price. They cannot tell you anything price has not already shown. Ten indicators on a chart do not give ten independent signals — they give one signal repeated ten times. Use one or two indicators alongside trend and support/resistance, not ten on top of each other.
Myth: Fundamentals Are Too Complicated for Retail Traders
Reality: Modern Indian platforms like Screener.in put institutional-grade fundamental data one click away. Reading a quarterly result and a balance sheet takes a few hours of practice, not a CFA degree. Anyone willing to spend two weekends learning the basics can run a fundamental screen.
Neither method guarantees profits. Technical analysis can be wrong because the market is irrational in the short run. Fundamental analysis can be wrong because the market is irrational in the long run. The SEBI study showing that 93% of equity F&O traders lose money does not separate them by method — both technical and fundamental traders are in that 93%.
The traders who survive are not the ones who picked the "right" method. They are the ones who sized positions to survive the inevitable losses, used stop losses on every trade, and refused to chase setups that did not match their rules. Method matters less than discipline. Discipline matters more than everything else.
Which Method Should Traders Choose — A Decision Framework
Use this framework to pick the method that matches the actual goal, not the method that sounds more interesting.
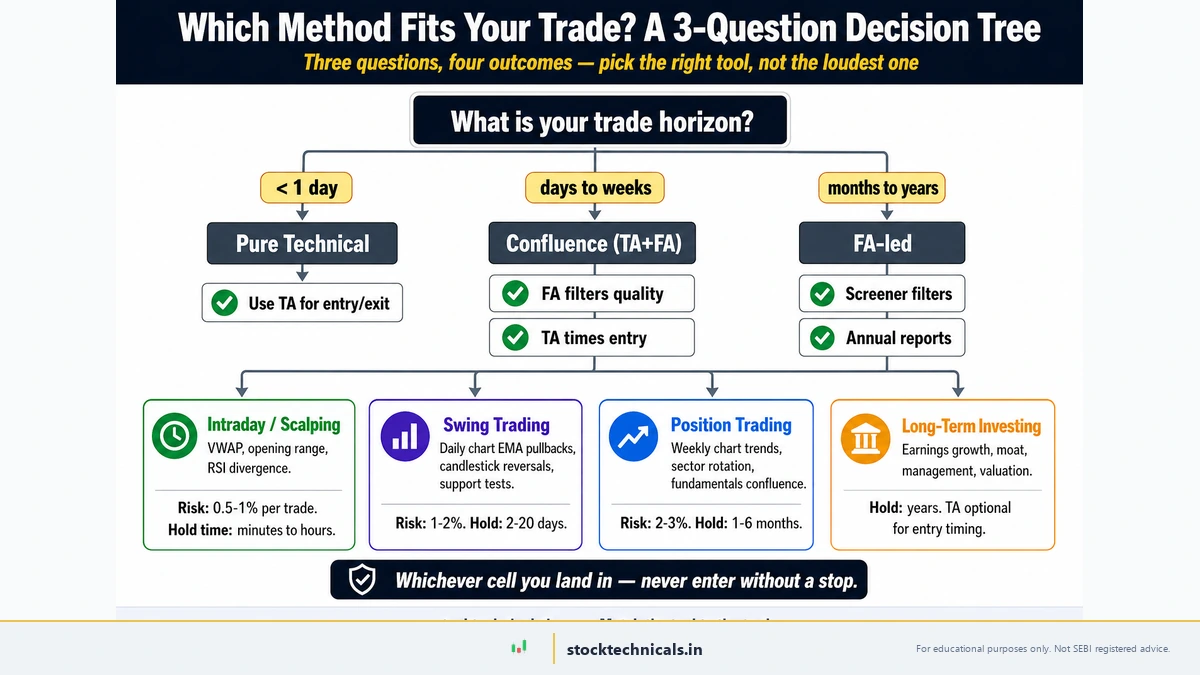
If the goal is to make money trading stocks within hours, days, or weeks — technical analysis is the right starting point. Learn to read candlestick charts, identify support and resistance, understand trend, and use one or two indicators. Pair this with strict risk management.
If the goal is to grow capital across years through quality businesses — fundamental analysis is the right starting point. Learn to read balance sheets, understand basic ratios, evaluate management quality, and assess industry trends. Buy good companies at reasonable prices and let time do the work.
If the goal is both — trade with discipline and invest with conviction — learn both. Use fundamentals to build a watchlist of high-quality stocks and use technicals to time the entries. This is the approach most professional traders converge on after years of trial and error.
Your 30-Day Plan to Learn Both Approaches
Theory without practice does nothing. This four-week plan gives a structured path that builds both technical and fundamental skill in parallel, so the trader can apply both approaches by the end of the month.
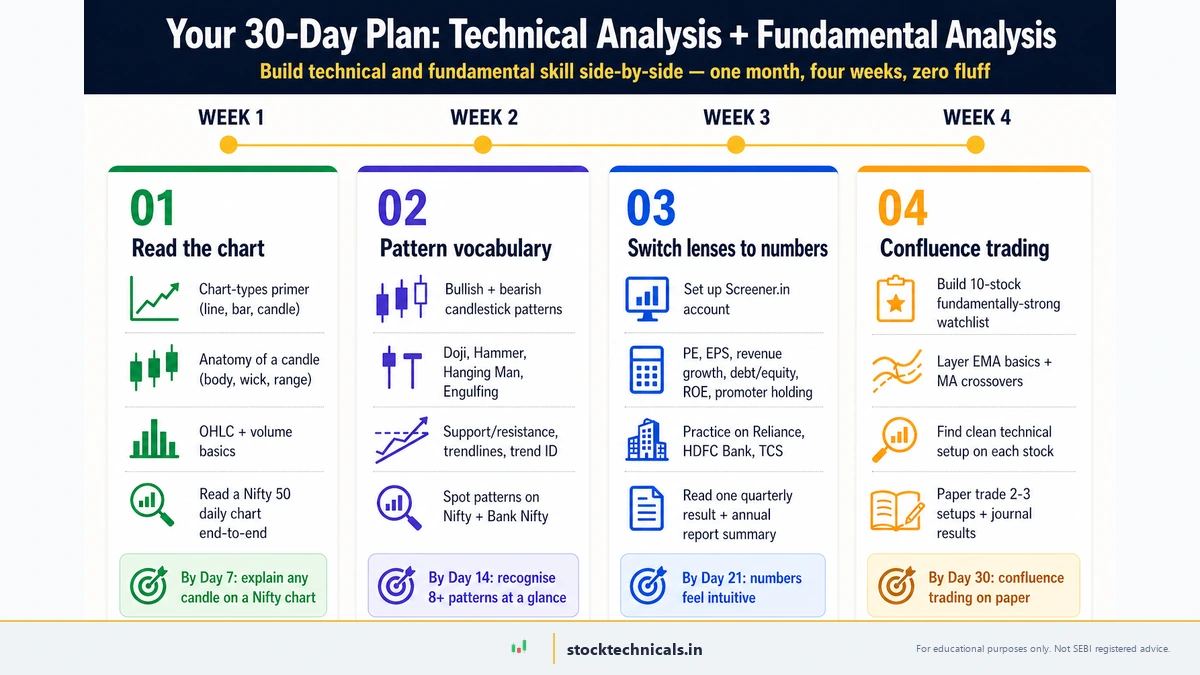
Week 1 — Technical Analysis Foundations
Start with the visual layer because it builds intuition fastest. Read what is technical analysis and how to read stock charts. Then work through the types of stock charts guide and the anatomy of a candlestick. By Day 7, the trader should be able to look at a Nifty 50 daily chart and describe what each candle means.
Week 2 — Patterns and Levels
Build the pattern vocabulary. Cover bullish and bearish candlestick patterns, doji candles, hammer and hanging man, and engulfing patterns. Then layer the structural tools: support and resistance, trendlines, and trend identification. Spot all of these on real Nifty and Bank Nifty charts.
Week 3 — Fundamental Analysis Foundations
Now switch lenses. Sign up on Screener.in and pull up Reliance Industries, HDFC Bank, and TCS. Read each company’s quarterly results and annual report summary. Learn the meaning of PE ratio, EPS, revenue growth, debt-to-equity, return on equity, and promoter holding. Practice on the same three companies until the numbers feel intuitive.
Week 4 — Combine the Two Methods
Build a watchlist of 10 fundamentally strong NSE companies using Screener.in filters. Then check each one’s chart on TradingView for a clean technical setup — a breakout, a pullback to support, or a bullish candlestick pattern at a key level. Layer in EMA basics and moving average crossovers for confirmation. Paper trade two or three setups and journal the results.
Practice With Both Methods This Week
Reading is the easy part. Building real fluency requires hands-on practice. Here are five exercises that take a single evening on free tools.
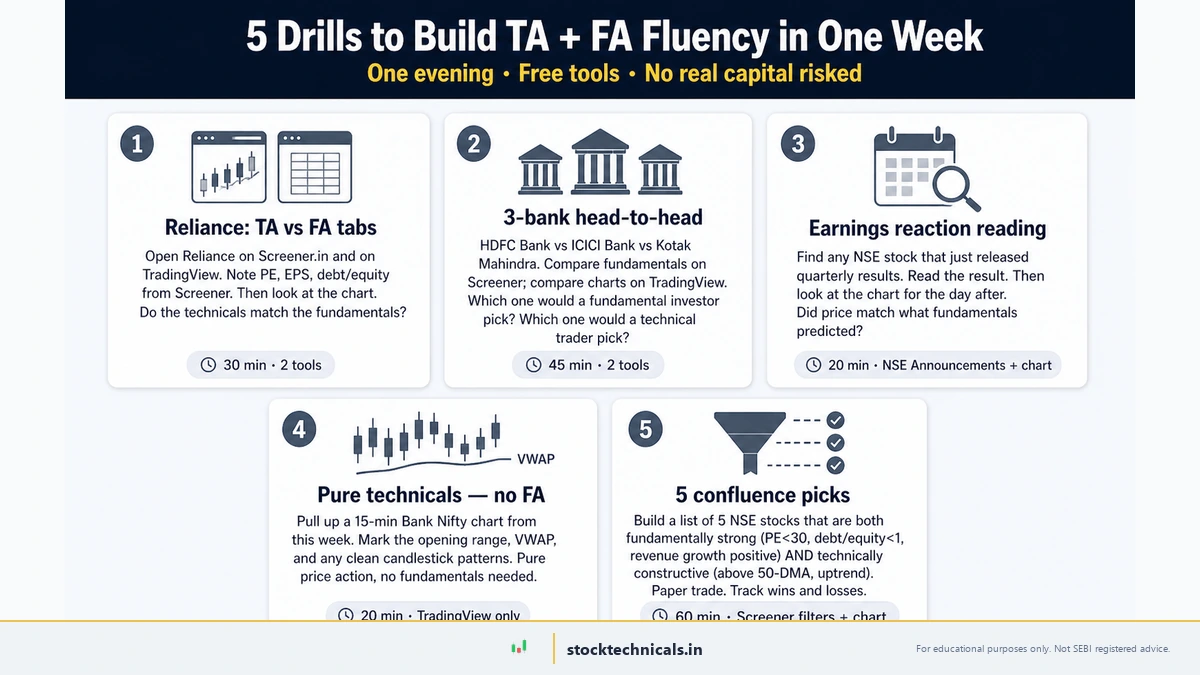
- Reliance side-by-side. Open Reliance on Screener.in and on TradingView in two browser tabs. Note the PE, EPS, debt-to-equity from Screener. Then look at the chart. Do the technicals match the fundamentals? Why or why not?
- Sector comparison. Pick three banking stocks — HDFC Bank, ICICI Bank, Kotak Mahindra Bank. Compare their fundamentals on Screener. Then compare their charts on TradingView. Which one would a fundamental investor pick? Which one would a technical trader pick? Are they the same?
- Quarterly results test. Find any NSE stock that just released quarterly results. Read the result. Then look at the chart for the day after. Did the price reaction match what fundamentals would predict? This is how to learn if a quarterly beat actually translates to upside.
- Bank Nifty technical drill. Pull up a 15-minute Bank Nifty chart from this week. Mark the opening range, the VWAP, and any clean candlestick patterns. This is pure technicals, no fundamentals needed.
- Combined watchlist. Build a list of five NSE stocks that are both fundamentally strong (PE under 30, debt-to-equity under 1, revenue growth positive) and technically constructive (above 50-day EMA, in an uptrend). This is the confluence approach in action.
Paper trade the setups before risking real capital. Track wins and losses. The goal is not to be right on every trade — it is to learn how often each method works in real conditions.
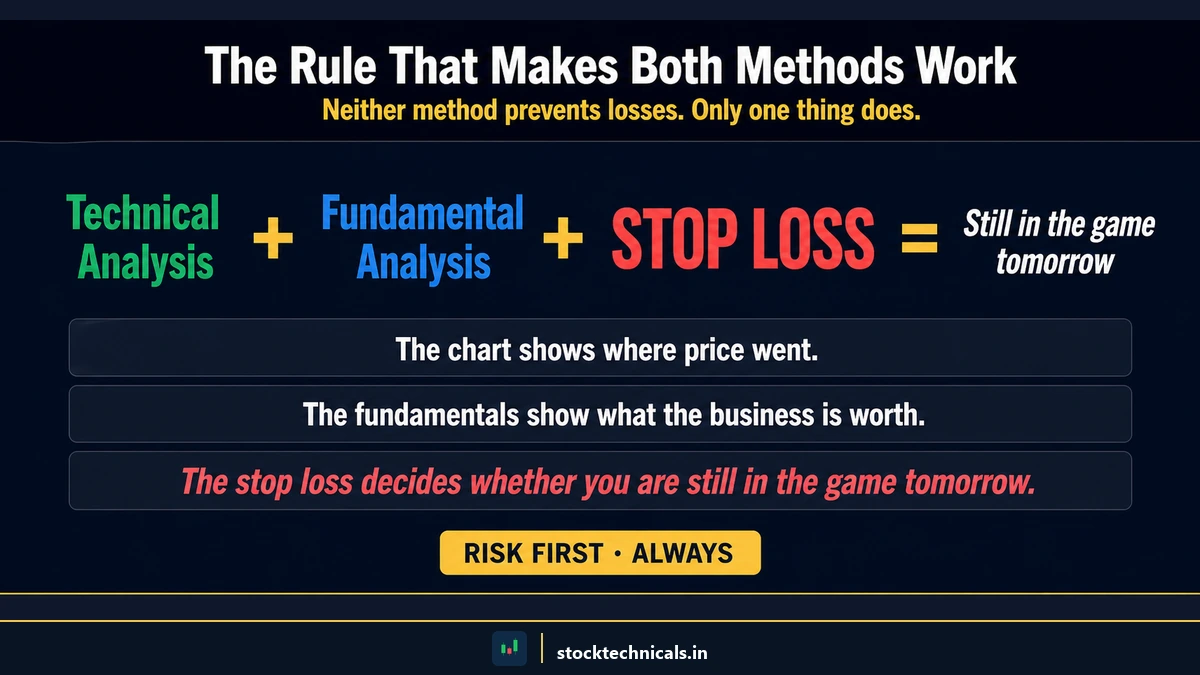
The Rule That Makes Both Methods Work
Neither technical nor fundamental analysis prevents losses. Only a stop loss does. Pick whichever method matches the trading style, but never enter a position without a defined exit level. The chart shows where price went. The fundamentals show what the business is worth. The stop loss decides whether the trader is still in the game tomorrow.
The Bottom Line on Technical vs Fundamental Analysis
Technical analysis and fundamental analysis aren’t rival camps — they answer different questions. Use fundamentals to filter high-quality stocks on the NSE (low debt, earnings growth, sector leaders like Reliance, TCS, HDFC Bank), then use technicals to time entries (support and resistance, volume breakouts, moving-average alignment). Per the SEBI FY24-25 study, 91 percent of individual equity F&O traders lost money — most because they picked one method and ignored the other.
Match the method to the timeframe: intraday wants technicals, multi-year wants fundamentals, and swing or positional trading wants both. The traders who survive in Indian markets don’t argue which approach is better — they use both tools, treating technical analysis as the entry signal and fundamental analysis as the quality filter.
Test Your Knowledge
Q1: A trader wants to hold a stock for 5+ years. Which method should dominate the decision?
Q2: A stock breaks out above resistance on 3× the 20-day average volume. Which method explains this signal?
Q3: Per the SEBI FY24-25 study, what percentage of individual equity F&O traders lost money?
Q4: A swing trader builds a watchlist of 20 debt-free Nifty 500 stocks, then buys only when each pulls back to the 50-day EMA. This approach uses:
Q5: Which single factor matters more than technical-versus-fundamental preference for long-term survival?
| Aspect | Technical Analysis | Fundamental Analysis |
|---|---|---|
| Time horizon | Days to weeks | Months to years |
| Primary input | Price + volume on charts | Earnings, balance sheet, sector |
| Best for | Swing + intraday trading | Long-term investing |
| Decision speed | Minutes to hours | Days to weeks |
| Skill curve | Pattern recognition | Financial statement analysis |
Should beginners learn technical analysis or fundamental analysis first?
Depends on goal. If the plan is intraday or swing trading, learn technical analysis first — charts, support and resistance, candlesticks, volume. If the plan is long-term investing across years, learn fundamental analysis first — earnings, debt, ratios, business quality. Most retail traders benefit from a technical foundation because it teaches risk management (stop-loss, position sizing) that fundamental investors often skip.
Which approach actually makes more money?
Neither approach wins by default — the winner is the trader who matches method to timeframe. Warren Buffett and Rakesh Jhunjhunwala built fortunes on fundamentals across decades. Jesse Livermore and Paul Tudor Jones built fortunes on technicals across weeks. Per the SEBI FY24-25 study, 91 percent of F&O traders lose regardless of method — discipline and risk management matter far more than the label.
Can I use only technical analysis for long-term investing?
Possible but risky. Pure technical investors miss warning signs that fundamentals reveal early — rising debt, declining margins, management fraud. Think Yes Bank before 2020 or DHFL before 2019: charts looked normal until they collapsed. For holding periods beyond six months, at minimum check debt-to-equity, ROE, and promoter pledging. Technicals work for entries; fundamentals prevent terminal losses.
Do Indian traders need to know both methods?
For serious trading, yes. Indian markets have specific quirks: quarterly results move stocks violently, SEBI rule changes reprice entire sectors overnight, and monsoon / RBI policy creates multi-week swings that technicals alone miss. Knowing both methods means reading an EMA crossover signal differently if the stock is a Nifty 50 leader versus a microcap with suspect books. One tool is never enough for a market where fundamentals shift this fast.
How do swing traders combine technical and fundamental analysis?
Common approach: use fundamentals to build a watchlist of 15-30 quality stocks (debt-free or low debt, consistent earnings, sector leadership), then use technicals to time entries and exits within that watchlist. Enter on pullbacks to 50-day EMA or support zones. Exit on resistance rejection or trend break. The fundamental filter removes the stocks most likely to go to zero; the technical signal removes the need to predict the future.
Technical analysis tells you WHEN, fundamental analysis tells you WHAT. Traders who ignore either side fight half-blind. Per the SEBI FY24-25 study, 91 percent of individual equity F&O traders lost money — discipline beats every indicator.
Continue Learning
Build on these concepts with the foundational guides on the site:
- What is Technical Analysis? A Complete Beginner’s Guide
- How to Read Stock Charts: From First Glance to Trade Setup
- Types of Stock Charts: The Complete Visual Guide
- Timeframes in Trading
- What Are Candlestick Charts?
- Support and Resistance: Complete Guide
- Browse the full Learn Technical Analysis hub
Protect your capital. Everything else follows. No setup works without a stop-loss.