Technical Analysis is the practice of reading price and volume on stock charts to forecast probable next moves — it works because human emotions repeat, and those repeats leave visible footprints on Indian stocks like Reliance (NSE: RELIANCE), Tata Motors (NSE: TATAMOTORS), and the Nifty 50 (NSE: NIFTY 50). On March 23, 2020, the Nifty 50 (NSE: NIFTY 50) crashed circuit-down 13% in a single session, and on September 28, 2018, the IL&FS default day rocked Bank Nifty (NSE: BANKNIFTY) — both events left textbook chart signatures the day they happened. This 15-article topic is the complete beginner foundation: definitions, three core assumptions, NSE-specific context, and an exact reading order calibrated to your trading style.
- What is Technical Analysis? — The definition, the three assumptions, and why pattern recognition outperforms gut feel. Start here even if you think you already know.
- How to Read Stock Charts — The vocabulary: price axis, time axis, open, high, low, close. You cannot trade what you cannot read.
- Types of Stock Charts — Line, bar, candlestick. Why 99% of serious traders use candlesticks and when line charts still win.
- Technical Analysis vs Fundamental Analysis — The difference, the overlap, and why most successful traders use both even if they publicly pick a side.
- Timeframes in Trading — Why a 5-minute chart and a weekly chart tell different stories about the same stock, and how to match your timeframe to your life.
Core Mechanics — Articles 6-10
The actual trading concepts that produce setups. Expected time: 1.5 hours.
- What is a Trend? — Higher highs and higher lows; the three trend directions; why trading with the trend is easier than against it.
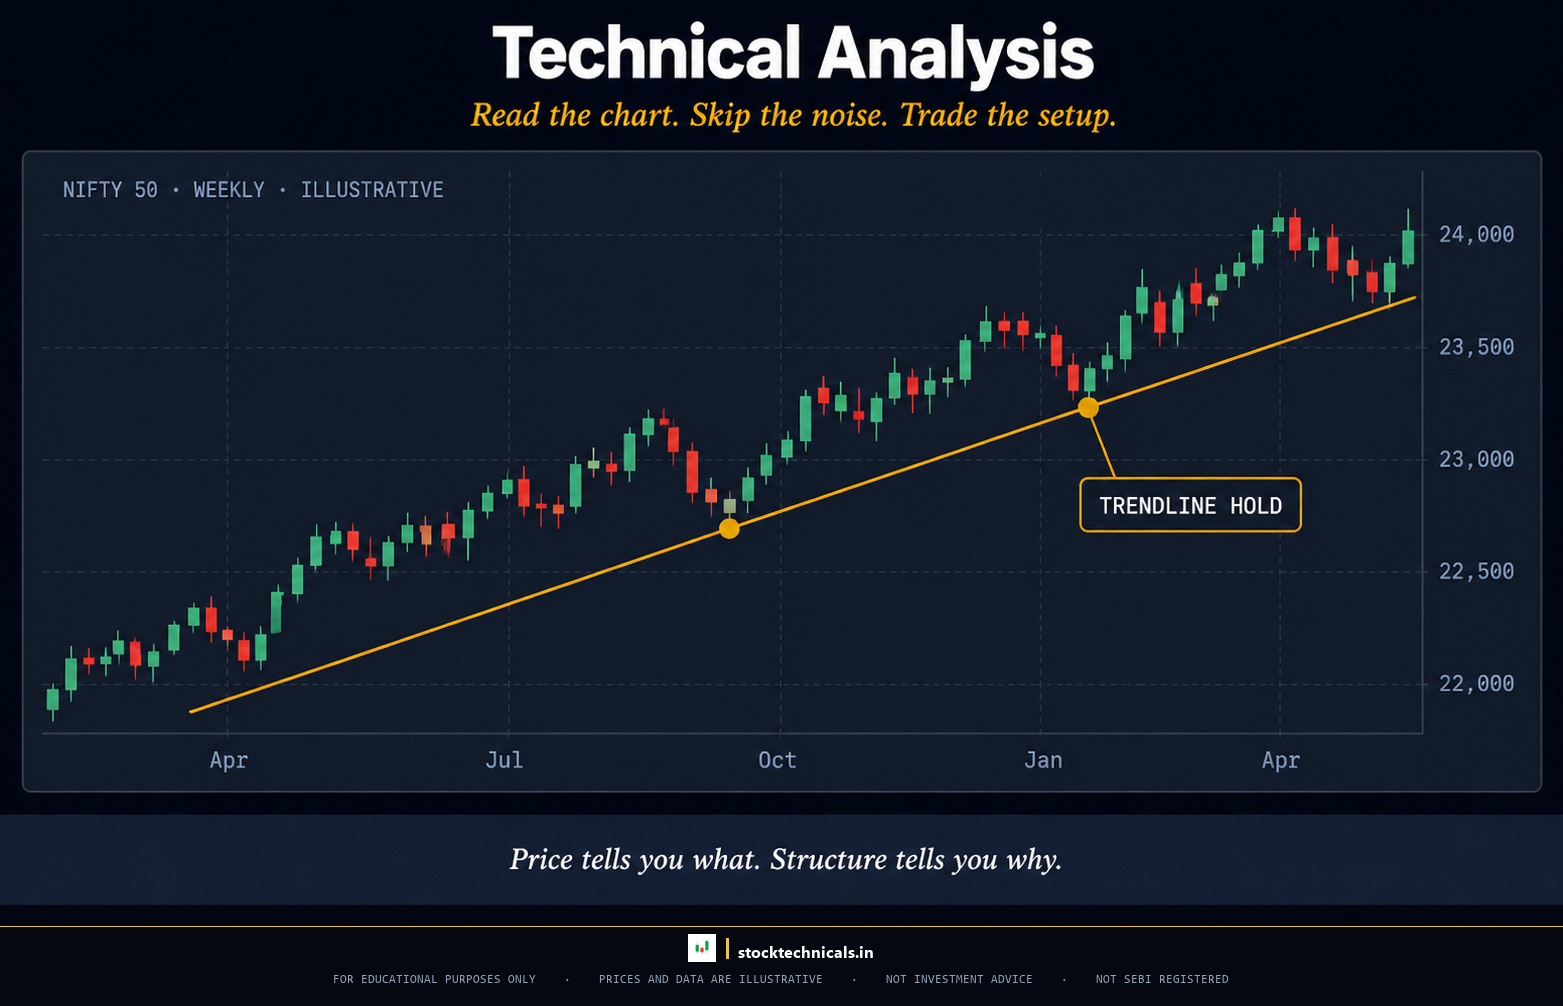
- Trendlines — How to draw them correctly, how to validate them, and how to tell a real break from a fake.
- Volume in Trading — Volume is the only independent confirmation signal you have. Learn to read it and you stop taking low-conviction trades.
- What is a Breakout? — Where the largest and fastest gains come from. Also where most retail traders get trapped.
- What is a Pullback? — The safer, higher-probability cousin of the breakout. Master this and you have a repeatable setup for life.
Context and Practice — Articles 11-15
The frameworks that separate hobby charters from disciplined traders. Expected time: 1.5 hours.
- Dow Theory — Charles Dow’s 1890s framework, which quietly underwrites every modern technical analysis concept. Six tenets. Timeless.
- Types of Trading — Scalping, intraday, swing, positional. Their timeframes, risk profiles, capital requirements, and which one survives a full-time job.
- How to Set Up Your First Chart on TradingView — The exact TradingView configuration that works for Indian stocks, step by step. Free plan is enough to start.
- Common Technical Analysis Myths Busted — “Indicators predict the future.” “You can day-trade with ₹10,000.” “More indicators = better analysis.” All wrong; here is why.
- Technical Analysis Checklist — The ten questions to ask yourself before every entry. Includes the interactive Pre-Trade Checklist Validator widget.
Choose Your Starting Point by Trading Style
If you already know the kind of trader you want to be, you can take a shorter path into the topic. The five articles at the start are mandatory for everyone. After that, a style-aware reading order will get you to a tradeable skill faster.
- If you want to day-trade Nifty or Bank Nifty (NSE: BANKNIFTY) options: Articles 1-5, then jump to Timeframes, Volume, Breakouts, Types of Trading. Then continue to the Candlestick Patterns topic for intraday reversal signals.
- If you want to swing-trade delivery stocks (holding 3-10 days): Articles 1-5, then Trends, Trendlines, Pullbacks, Dow Theory. Then progress to the Chart Patterns and Price Action topics.
- If you want to positional-trade (holding weeks to months): Articles 1-5, then Trends, Dow Theory, Timeframes, Technical Analysis vs Fundamental Analysis. Pair the outputs of this topic with the Fundamental Analysis hub — positional trading rewards the overlap.
- If you are still deciding and want the full foundation: Read articles 1-15 in order. The whole topic is ~4 hours. This is the path we recommend by default.
| Trading Style | Holding Period | Mandatory Topics from This Hub | Approximate Time |
|---|---|---|---|
| Intraday / Day Trading | Same session | Articles 1-5 + Volume + Breakouts + Timeframes | 3-4 hours |
| Swing Trading | 3-10 days | Articles 1-5 + Trends + Trendlines + Pullbacks + Dow Theory | 3-4 hours |
| Positional Trading | Weeks to months | Articles 1-5 + Trends + Dow Theory + Timeframes + Technical vs Fundamental | 3 hours |
| Full Foundation (Recommended) | Any | All 15 articles in numbered order | ~4 hours |
I traded the Indian markets for years before I learnt that the order of these 15 topics matters more than the depth of any one of them. We tested skipping the foundation chapters — the result was always the same: traders who jumped straight to indicators without reading charts first ended up indicator-dependent and lost confidence the day the signal misfired.
“It never was my thinking that made the big money for me. It always was my sitting. Got that? My sitting tight!”
— Jesse Livermore, Reminiscences of a Stock Operator (1923)
What to Read After Topic 1
Topic 1 is the language. The other topics are the vocabulary you use once you can read charts. Here is the order that produces the most compounding:
- Candlestick Patterns — The language of single candles and multi-candle formations. 12 published articles.
- Chart Patterns — Head & shoulders, triangles, flags, cup & handle — the geometric setups that professional traders screen for every session. 10 published articles.
- Price Action Trading — Trading with zero indicators, using only price and volume. The purest form of chart reading. 8 published articles.
- Technical Indicators — RSI, MACD, Bollinger Bands, Supertrend, moving averages. Useful once you can read price — dangerous before. 9 published articles.
- Risk Management — Position sizing, stop placement, expectancy maths. Arguably the most important topic on the site. Start as soon as you begin paper-trading.
Key Takeaways
- Technical analysis reads the footprints crowds leave on a chart. It works because human emotion repeats; it fails when a news catalyst or an illiquid market breaks the pattern.
- The Indian context matters: 9:15-3:30 hours, circuit limits, Tuesday weekly expiry, and the 93% SEBI loser statistic should shape every trade plan.
- Topic 1 is 15 finite articles, ~4 hours total. Read in order for depth, or take a style-aware shortcut after the first 5 articles if you already know your trading horizon.
- Finish Topic 1, then progress to Candlestick Patterns, Chart Patterns, Price Action, and Indicators. Start Risk Management in parallel from day one of paper-trading.
How long does it take to learn technical analysis from this topic?
Most readers finish the 15 articles in 4-6 hours of focused reading spread over a week. Actually becoming competent — recognising setups live on a chart without hesitation — takes another 2-3 months of daily screen time and paper-trading. The topic itself is the foundation, not the finish line. Track your progress on TradingView and revisit weak articles weekly.
Do I need a paid TradingView or Zerodha account to follow along?
No. TradingView’s free plan supports Indian stocks and is enough for every article in this topic. Zerodha Kite, Groww, Angel One, Dhan, and Upstox all ship free charting that can replicate the examples. A paid upgrade becomes useful around the Indicators topic, not before. For paid users, TradingView Plus or Premium is the upgrade path most active traders pick.
Is technical analysis enough on its own, or do I need fundamental analysis too?
For intraday and short swing trades (under a week), technical analysis alone is workable. For positional trades held weeks to months, combining technical analysis with fundamental analysis consistently outperforms either one in isolation. Article 4 in this topic covers the trade-off in detail. Test the overlap on a single Indian stock for one quarter before deciding.
Does technical analysis work in the Indian market?
Yes. The core concepts — trends, support/resistance, volume, breakouts — are behaviour-based, not geography-based. Indian stocks like Reliance (NSE: RELIANCE), Tata Motors, HDFC Bank, and indices like Nifty 50 and Bank Nifty produce the same chart patterns that global stocks do. The adjustments you need are around market hours (9:15-3:30 IST), circuit limits, and expiry-day volatility, not around the patterns themselves. The same patterns work in Indian markets that work globally — the language is universal.
What is the best order to read the 15 articles?
Read articles 1-5 in sequence without skipping — they are the foundation and the rest of the topic assumes you know them. After article 5, you can either continue linearly or take a trading-style shortcut (see the “Choose Your Starting Point” section above). Articles 14 and 15 — myths and checklist — are best read last, once you have seen the rest. A linear read is best for first-timers; the style-aware shortcut suits returning learners.
How much capital do I need to start applying what I learn here?
Zero, initially. Paper-trade on TradingView or Sensibull for 1-3 months before putting real money on the line. When you do go live, start with a capital base where losing 25% will not change your lifestyle — for most first-time traders, that is under ₹50,000. Position-sizing discipline matters more than account size. Track every paper trade in a journal to see your edge before scaling capital.
Are indicators like RSI and MACD covered in this topic?
No — this is the beginner foundation topic. Indicators are covered in the separate Technical Indicators topic. The sequence is intentional: learn to read price first, then layer indicators on top. Reversing the order produces indicator-dependent traders who cannot function when the signal breaks down. Read this hub end-to-end before the Indicators hub for compounding gains.
Does this topic cover options or F&O trading?
Only tangentially — options trading uses underlying technical analysis but has its own mechanics (Greeks, implied volatility, expiry behaviour). Finish Topic 1 first, then progress to the dedicated Options & F&O Trading hub, which assumes you already read charts fluently. For dedicated F&O learners, the Options hub assumes you already mastered Topic 1.
Trading in equities, derivatives, currencies, and commodities carries substantial risk of loss and is not suitable for every investor. SEBI’s 2023-24 study showed 93% of individual intraday traders in the equity segment made net losses. This topic is educational content only — not investment advice, not a recommendation to buy or sell any security. No SEBI RIA registration is in place on this site. Past chart behaviour does not guarantee future performance. Always paper-trade before risking real capital, size positions so a single loss cannot compromise your financial situation, and confirm every example against your own broker terminal before acting. When in doubt, consult a SEBI-registered investment adviser.
Quick Answer. Technical analysis is the practice of reading price and volume on a chart to forecast where a stock is most likely to move next. It works because human behaviour repeats — fear, greed, and hesitation leave visible fingerprints in candles, trendlines, and volume spikes. This topic teaches you the full beginner guide: 15 articles, ~4 hours of focused reading, zero paywall.
Who this is for. Traders in India who have opened a demat account (Zerodha, Groww, Angel One, Upstox, Dhan) and want to stop trading on WhatsApp tips. No prior finance degree needed.
Topic 1 · Technical Analysis Fundamentals · 15 articles · ~4 hours · Last refreshed April 21, 2026. Prices and data are compiled with reasonable care but — always confirm against your broker before trading.
What Technical Analysis Actually Is
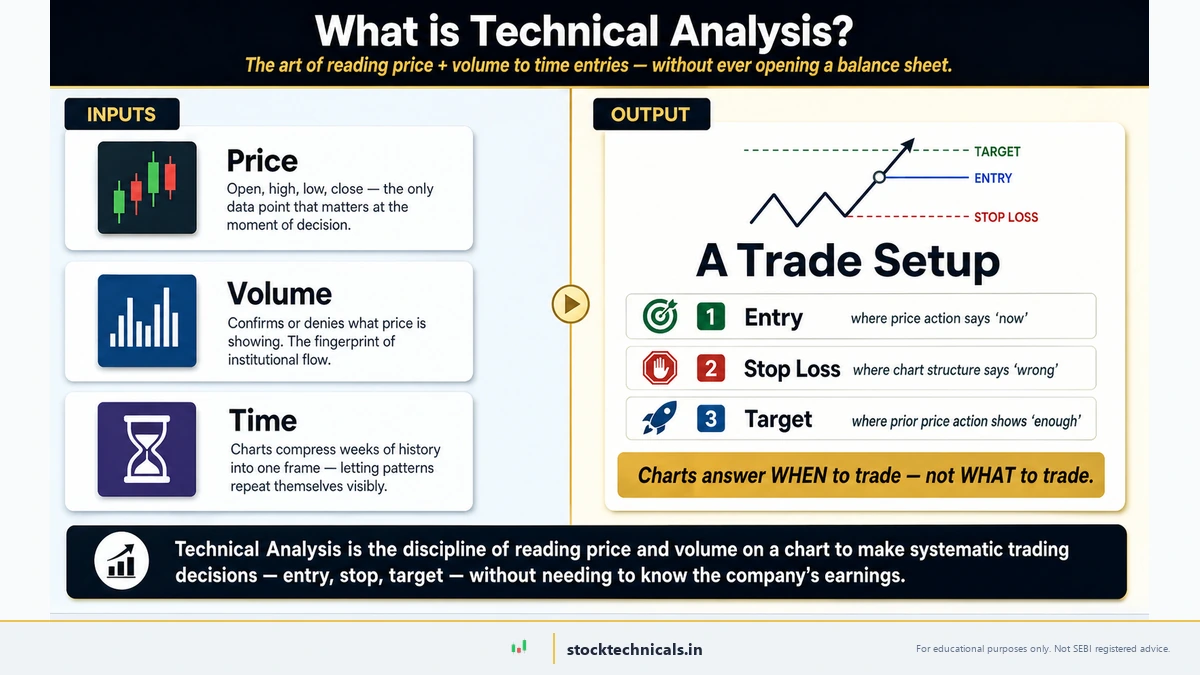
Technical analysis is the discipline of forecasting future price movement by studying the past price movement of a stock, index, or commodity. That is the textbook definition. The working definition is harder and more useful: technical analysis is reading the footprints that crowds leave on a chart.
When Reliance opens on an NSE trading day, thousands of people make decisions at the same time — traders closing overnight positions, institutions executing block orders, retail buyers reacting to last night’s news, algorithms firing on triggers. Each of those decisions becomes a tick. Thousands of ticks become a candle. Dozens of candles become a pattern. That pattern is a summary of what the crowd agreed on during that window — and because crowds repeat their emotions, patterns repeat too.
There are three assumptions technical analysis rests on. First: price discounts everything — every known fundamental, news item, rumour, and expectation is already in the current price. Second: price moves in trends — a stock in an uptrend is more likely to continue up than reverse, until something changes. Third: history rhymes — the same chart setups that worked on Tata Motors in 2017 work on Adani Ports in 2026 because the human nervous system has not evolved in the last nine years.
You do not need to believe these assumptions are universally true. You only need to believe they are true often enough that trading with them produces better results than trading without them. The record of professional traders who use technical analysis — quant funds, proprietary trading desks, prop shops — suggests they are.
Why Technical Analysis Works (and When It Fails)
Technical analysis works for one reason that has nothing to do with charts: markets are made of humans, and humans are pattern-forming creatures. When a stock pulls back to ₹2,400 three times and bounces each time, the fourth time that ₹2,400 level prints, thousands of traders — institutional and retail — are watching the same level. Many of them will buy. Their combined buying becomes the bounce. The level “held” because the memory of it holding made traders act on it again. This is called reflexivity. It is the engine of every support-resistance, trendline, and breakout trade you will ever take.
Technical analysis fails — reliably and expensively — in four situations. Learn them now so you do not learn them with ₹50,000 of real capital later:
- When a news catalyst overwhelms the chart. A surprise RBI rate hike, an unexpected earnings miss, a regulator’s raid on a corporate house — the chart gaps through every support and every trendline, because the fundamental reality has changed faster than the chart can re-price.
- In thinly traded stocks. Technical analysis needs enough participants to create a real statistical signal. An SME stock trading 40,000 shares a day does not have the crowd depth for trendlines and patterns to mean anything.
- In ranging, directionless markets. Trend-following setups — breakouts, pullbacks, moving-average crossovers — degrade badly when the market chops sideways for weeks. This is why Dow Theory taught us to identify the trend first, and why timeframes matter.
- When you stop following your own rules. The most common failure is not the chart; it is the trader. A perfectly valid breakout becomes a disaster when you move the stop, add to the loser, or change the plan mid-trade.
The honest framing: technical analysis is a probability tool, not a crystal ball. A good setup gives you roughly 55-65% odds on a single trade. That is not a sure thing. It is a small edge — but if you apply it consistently across 100 trades with correct position sizing, the small edge compounds into real money. That is the entire game.
The Indian-Market Context You Must Know
Two examples from Indian market history that every Technical Analysis student should bookmark: on March 23, 2020, the Nifty 50 hit lower circuit at 7,610.25, recording its worst single-session decline since the 2008 financial crisis — and on September 28, 2018, IL&FS default rumours triggered a 1,200-point Bank Nifty intraday reversal. Both events printed unmistakable bearish reversal signatures — long upper-wick candles, exhaustion volume, immediate test of long-standing supports.
Every concept in this topic is language-agnostic — a trendline is a trendline whether it is drawn on the Dow in 1929 or on Tata Motors in 2026. But the practice of trading in India has texture that global textbooks miss, and ignoring it will cost you.
- Market hours. NSE and BSE cash markets run 9:15 AM to 3:30 PM IST, Monday to Friday. Pre-open is 9:00-9:15. There is no after-hours session for equities. Derivatives extend slightly. Your daily candles are 6 hours 15 minutes of actual trading — not 24.
- Circuit limits. Most Indian stocks have upper and lower circuit bands (usually 5%, 10%, or 20%). When a stock hits the upper circuit, it simply stops trading up — this produces “frozen” candles that can look misleading on a chart. Always check circuit status before entering a trade.
- Expiry calendar. NSE moved weekly index option expiry to Tuesdays from September 1, 2025. Thursdays are now for Bank Nifty and the monthly expiry. This changes the volatility footprint of every major index on expiry day.
- Bulk-deal data. NSE publishes bulk and block deals daily. When a large institutional order hits, it often leaves a visible volume spike on the chart — one of the few places where “smart money” footprints are literally public in India.
- The 93% statistic. SEBI’s 2023-24 intraday study found that 93% of individual intraday traders in the equity segment made net losses. Technical analysis, applied with discipline, is one of the few levers you can pull to move yourself out of that cohort.
Topic 1 Guide — All 15 Articles
This topic is finite. Fifteen articles, read in order, and you will understand more about charts than 95% of retail traders in India. Each article is self-contained but builds on the last. Do not skip. The sequence is the point.
Foundation — Articles 1-5
Read these five first, in order. They are the bedrock. Expected time: 1 hour.
- What is Technical Analysis? — The definition, the three assumptions, and why pattern recognition outperforms gut feel. Start here even if you think you already know.
- How to Read Stock Charts — The vocabulary: price axis, time axis, open, high, low, close. You cannot trade what you cannot read.
- Types of Stock Charts — Line, bar, candlestick. Why 99% of serious traders use candlesticks and when line charts still win.
- Technical Analysis vs Fundamental Analysis — The difference, the overlap, and why most successful traders use both even if they publicly pick a side.
- Timeframes in Trading — Why a 5-minute chart and a weekly chart tell different stories about the same stock, and how to match your timeframe to your life.
Core Mechanics — Articles 6-10
The actual trading concepts that produce setups. Expected time: 1.5 hours.
- What is a Trend? — Higher highs and higher lows; the three trend directions; why trading with the trend is easier than against it.
- Trendlines — How to draw them correctly, how to validate them, and how to tell a real break from a fake.
- Volume in Trading — Volume is the only independent confirmation signal you have. Learn to read it and you stop taking low-conviction trades.
- What is a Breakout? — Where the largest and fastest gains come from. Also where most retail traders get trapped.
- What is a Pullback? — The safer, higher-probability cousin of the breakout. Master this and you have a repeatable setup for life.
Context and Practice — Articles 11-15
The frameworks that separate hobby charters from disciplined traders. Expected time: 1.5 hours.
- Dow Theory — Charles Dow’s 1890s framework, which quietly underwrites every modern technical analysis concept. Six tenets. Timeless.
- Types of Trading — Scalping, intraday, swing, positional. Their timeframes, risk profiles, capital requirements, and which one survives a full-time job.
- How to Set Up Your First Chart on TradingView — The exact TradingView configuration that works for Indian stocks, step by step. Free plan is enough to start.
- Common Technical Analysis Myths Busted — “Indicators predict the future.” “You can day-trade with ₹10,000.” “More indicators = better analysis.” All wrong; here is why.
- Technical Analysis Checklist — The ten questions to ask yourself before every entry. Includes the interactive Pre-Trade Checklist Validator widget.
Choose Your Starting Point by Trading Style
If you already know the kind of trader you want to be, you can take a shorter path into the topic. The five articles at the start are mandatory for everyone. After that, a style-aware reading order will get you to a tradeable skill faster.
- If you want to day-trade Nifty or Bank Nifty options: Articles 1-5, then jump to Timeframes, Volume, Breakouts, Types of Trading. Then continue to the Candlestick Patterns topic for intraday reversal signals.
- If you want to swing-trade delivery stocks (holding 3-10 days): Articles 1-5, then Trends, Trendlines, Pullbacks, Dow Theory. Then progress to the Chart Patterns and Price Action topics.
- If you want to positional-trade (holding weeks to months): Articles 1-5, then Trends, Dow Theory, Timeframes, Technical Analysis vs Fundamental Analysis. Pair the outputs of this topic with the Fundamental Analysis hub — positional trading rewards the overlap.
- If you are still deciding and want the full foundation: Read articles 1-15 in order. The whole topic is ~4 hours. This is the path we recommend by default.
What to Read After Topic 1
Topic 1 is the language. The other topics are the vocabulary you use once you can read charts. Here is the order that produces the most compounding:
- Candlestick Patterns — The language of single candles and multi-candle formations. 12 published articles.
- Chart Patterns — Head & shoulders, triangles, flags, cup & handle — the geometric setups that professional traders screen for every session. 10 published articles.
- Price Action Trading — Trading with zero indicators, using only price and volume. The purest form of chart reading. 8 published articles.
- Technical Indicators — RSI, MACD, Bollinger Bands, Supertrend, moving averages. Useful once you can read price — dangerous before. 9 published articles.
- Risk Management — Position sizing, stop placement, expectancy maths. Arguably the most important topic on the site. Start as soon as you begin paper-trading.
Key Takeaways
- Technical analysis reads the footprints crowds leave on a chart. It works because human emotion repeats; it fails when a news catalyst or an illiquid market breaks the pattern.
- The Indian context matters: 9:15-3:30 hours, circuit limits, Tuesday weekly expiry, and the 93% SEBI loser statistic should shape every trade plan.
- Topic 1 is 15 finite articles, ~4 hours total. Read in order for depth, or take a style-aware shortcut after the first 5 articles if you already know your trading horizon.
- Finish Topic 1, then progress to Candlestick Patterns, Chart Patterns, Price Action, and Indicators. Start Risk Management in parallel from day one of paper-trading.
How long does it take to learn technical analysis from this topic?
Most readers finish the 15 articles in 4-6 hours of focused reading spread over a week. Actually becoming competent — recognising setups live on a chart without hesitation — takes another 2-3 months of daily screen time and paper-trading. The topic itself is the foundation, not the finish line.
Do I need a paid TradingView or Zerodha account to follow along?
No. TradingView’s free plan supports Indian stocks and is enough for every article in this topic. Zerodha Kite, Groww, Angel One, Dhan, and Upstox all ship free charting that can replicate the examples. A paid upgrade becomes useful around the Indicators topic, not before.
Is technical analysis enough on its own, or do I need fundamental analysis too?
For intraday and short swing trades (under a week), technical analysis alone is workable. For positional trades held weeks to months, combining technical analysis with fundamental analysis consistently outperforms either one in isolation. Article 4 in this topic covers the trade-off in detail.
Does technical analysis work in the Indian market?
Yes. The core concepts — trends, support/resistance, volume, breakouts — are behaviour-based, not geography-based. Indian stocks like Reliance, Tata Motors, HDFC Bank, and indices like Nifty 50 and Bank Nifty produce the same chart patterns that global stocks do. The adjustments you need are around market hours (9:15-3:30 IST), circuit limits, and expiry-day volatility, not around the patterns themselves.
What is the best order to read the 15 articles?
Read articles 1-5 in sequence without skipping — they are the foundation and the rest of the topic assumes you know them. After article 5, you can either continue linearly or take a trading-style shortcut (see the “Choose Your Starting Point” section above). Articles 14 and 15 — myths and checklist — are best read last, once you have seen the rest.
How much capital do I need to start applying what I learn here?
Zero, initially. Paper-trade on TradingView or Sensibull for 1-3 months before putting real money on the line. When you do go live, start with a capital base where losing 25% will not change your lifestyle — for most first-time traders, that is under ₹50,000. Position-sizing discipline matters more than account size.
Are indicators like RSI and MACD covered in this topic?
No — this is the beginner foundation topic. Indicators are covered in the separate Technical Indicators topic. The sequence is intentional: learn to read price first, then layer indicators on top. Reversing the order produces indicator-dependent traders who cannot function when the signal breaks down.
Does this topic cover options or F&O trading?
Only tangentially — options trading uses underlying technical analysis but has its own mechanics (Greeks, implied volatility, expiry behaviour). Finish Topic 1 first, then progress to the dedicated Options & F&O Trading hub, which assumes you already read charts fluently.
Trading in equities, derivatives, currencies, and commodities carries substantial risk of loss and is not suitable for every investor. SEBI’s 2023-24 study showed 93% of individual intraday traders in the equity segment made net losses. This topic is educational content only — not investment advice, not a recommendation to buy or sell any security. No SEBI RIA registration is in place on this site. Past chart behaviour does not guarantee future performance. Always paper-trade before risking real capital, size positions so a single loss cannot compromise your financial situation, and confirm every example against your own broker terminal before acting. When in doubt, consult a SEBI-registered investment adviser.