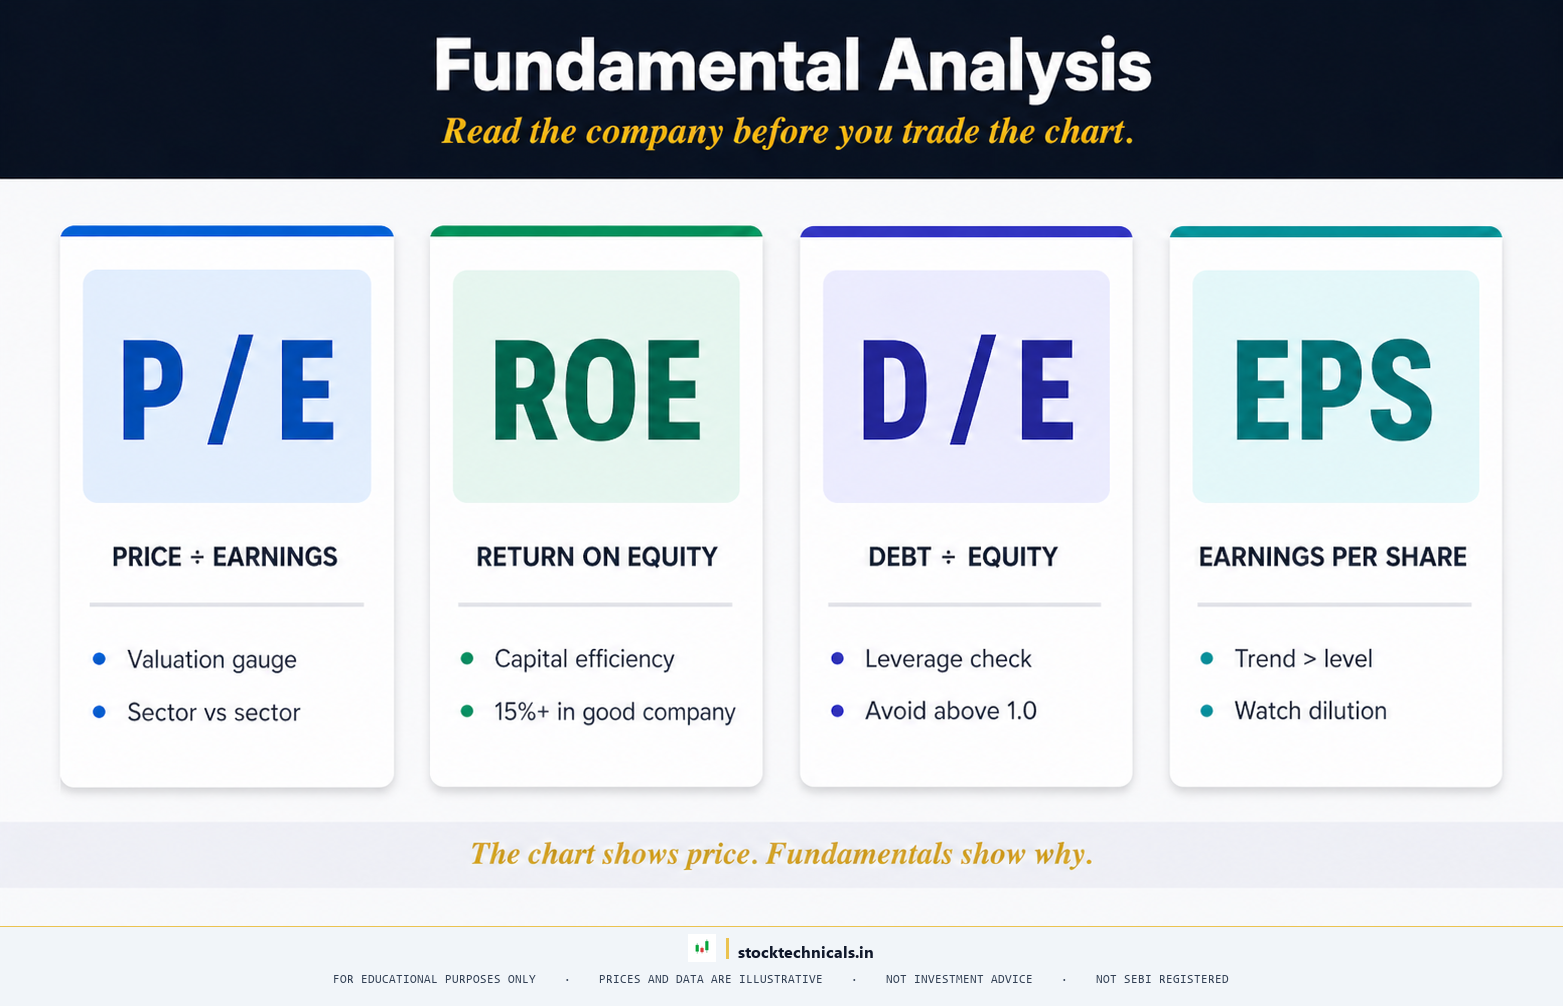
Quick Answer. Fundamental analysis is the discipline of estimating what a business is worth by reading its financial statements, judging management, and understanding the industry it operates in. A chart shows what price is doing. Fundamentals explain whether the company behind that price can survive the next quarter, pay its debt, and grow without diluting you. For traders, the fastest payoff is not learning to pick compounders — it is learning to spot the five or six red flags that turn a textbook chart setup into a 14% gap down on results day.
Who this is for. Swing traders who hold for days to weeks. Positional traders who hold for weeks to months. Investors who hold for years. And F&O traders who want a five-minute pre-trade filter so their technical setups stop blowing up on governance surprises. Pure intraday scalpers can skip most of this topic — but even they need the F&O ban list and the results-within-five-sessions check.
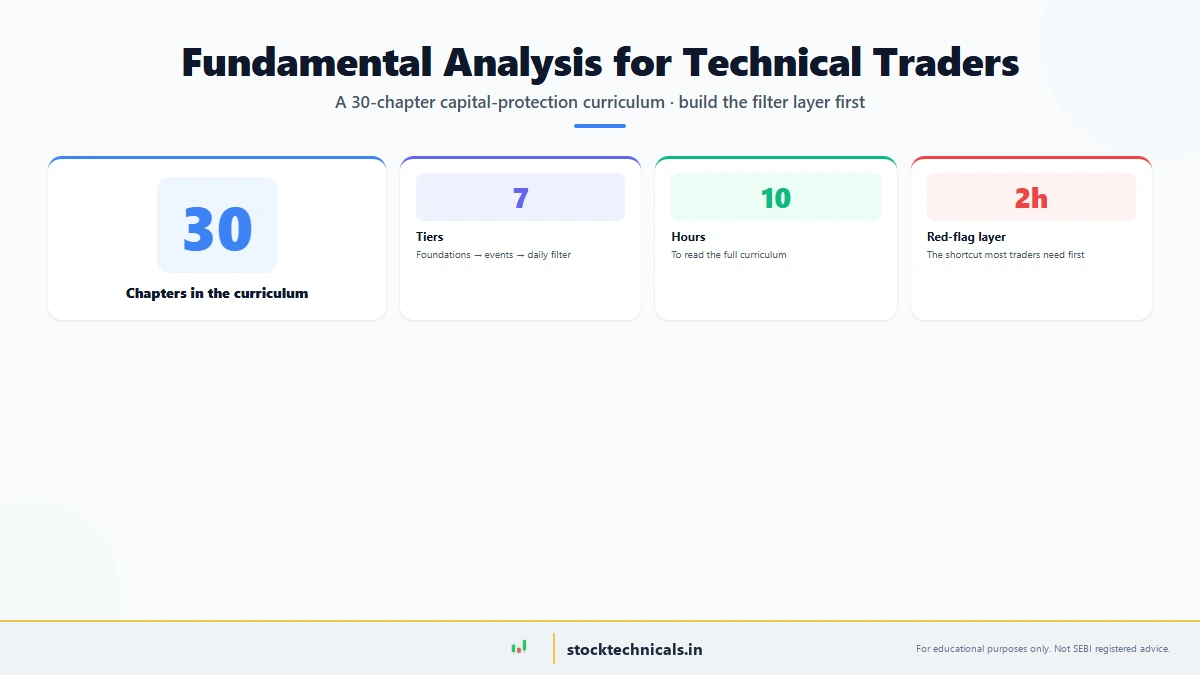
Topic 9 · Fundamental Analysis · 30 chapters · ~12 hours of reading · Last refreshed April 23, 2026. Prices and data are compiled with reasonable care but — always confirm against your broker before trading.
Why chart-only trading has a blind spot
Two fundamental-driven events on Indian stocks: on October 1, 2024, Reliance (NSE: RELIANCE) reported a 12% YoY profit jump that triggered a 4% gap up the next session — fundamentals + chart pattern aligned. On September 28, 2018, the IL&FS default exposed weak balance sheets across the Indian financial sector, and Bank Nifty (NSE: BANKNIFTY) plunged 1,200 points intraday. Quality screens save you from these landmines.
A trader opens Zerodha Kite on a Monday morning, pulls up YESBANK on the daily chart, and sees a textbook inverse head-and-shoulders with rising volume on the right shoulder. Clean setup. Stop-loss goes below the right shoulder low, target at the measured move. Position sized at 1% risk. Everything correct on paper.
The problem is not in the chart. The problem is in the annual report the trader never opened. Auditor had flagged qualified opinion. Promoter pledge had crept from 40% to 75% over four quarters. Tier-1 capital was sliding. RBI was already circulating a draft restructuring plan. None of this was in the candle pattern. All of it was in the disclosures.
This is the limit of a chart-first approach. Price action compresses the crowd’s current opinion into a shape. It does not tell you whether the business underneath the ticker is still solvent. Fundamental analysis closes that blind spot — not by replacing the chart but by filtering which charts you are allowed to trade.
The cost of learning fundamentals is measured in hours. The cost of not learning them shows up in a single bad month — one overnight gap, one surprise qualified opinion, one promoter pledge disclosure, and the textbook setup becomes a textbook loss. For most traders, the return on the first ten hours of fundamental study is higher than the next ten hours of chart study. This topic is built for that first ten hours.
What fundamentals tell you that charts cannot
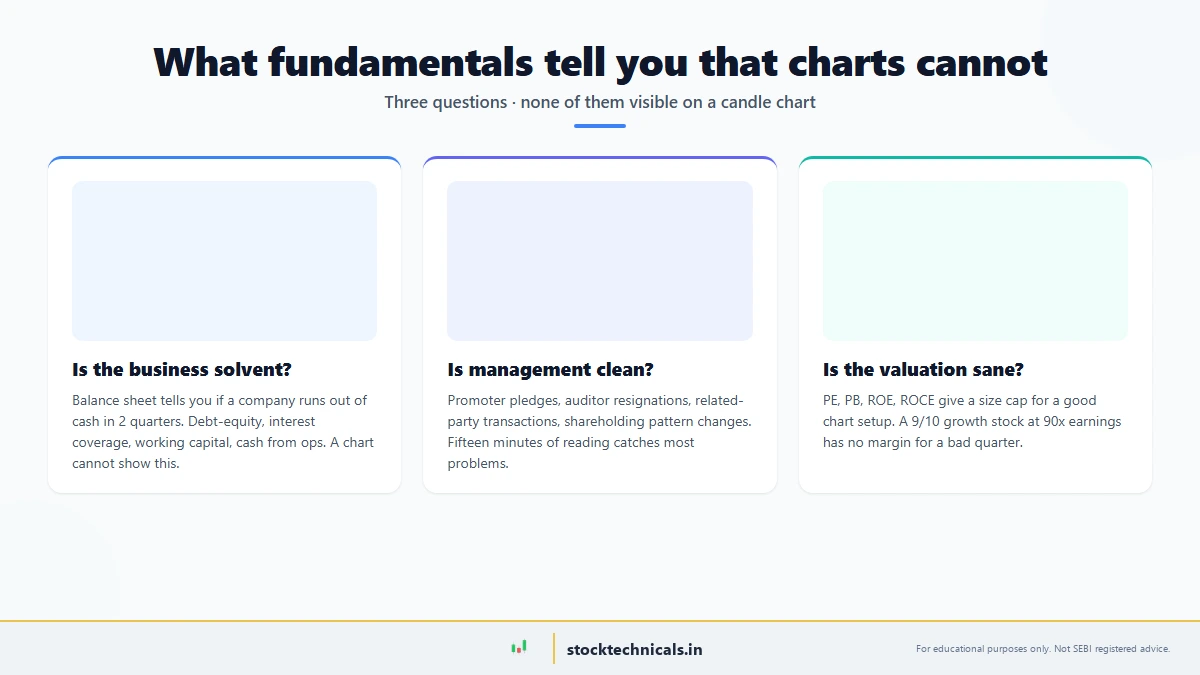
Three things. First — is the business solvent? A chart cannot tell you whether a company will run out of cash in the next two quarters. A balance sheet can. Debt-to-equity, interest coverage ratio, working-capital cycle, and cash-from-operations tell you whether the business is funding itself or being funded by lenders who are losing patience.
Second — is management clean? A chart cannot show you a promoter pledging 60% of his holding to repay personal loans. It cannot show you an auditor resigning with a qualified opinion. It cannot show you related-party transactions routing profit to a family member’s shell company. All of this sits in the shareholding pattern, the auditor report, and the annual report. A fifteen-minute read catches most of it.
Third — is the valuation sane? A chart will let you buy a stock at 90x earnings as long as price keeps rising. A price-to-earnings ratio tells you that same setup has almost no margin for a bad quarter. Valuation ratios do not time entries, but they cap size. A 9/10 growth score on a company trading at 90x earnings is a trap, not a buy signal — because the entire growth story is already in the price.
None of this replaces the chart. The chart still decides timing. Fundamentals decide which charts are safe to trade. Two separate questions, two separate answers, both required.
How to use this topic
The articles in this curriculum are written as stand-alone chapters that also form a sequence. If fundamentals are new, start with the three financial statements — Balance Sheet, Profit & Loss, Cash Flow — and the Annual Report article. Those four cover the source material. Every ratio, every red flag, every valuation number that shows up later is pulled from the three statements.
Once the statements are readable, the ratios start making sense. PE ratio, PB ratio, ROE, ROCE, Debt-to-Equity — each one is a single lens on the same underlying data. Most traders learn the ratios before the statements and then treat the ratios as rules. They are not rules. They are questions the statements answer. Read the statements first, the ratios become obvious.
The last group — red flags, promoter pledge, auditor resignations, block deals, FII/DII flows — is where trader-facing fundamentals live. These do not tell you whether a business is great. They tell you whether the business is about to break. That is the part that matters for the next ninety days of your trading, which is the window most retail accounts operate within.
Choose your path by trading style
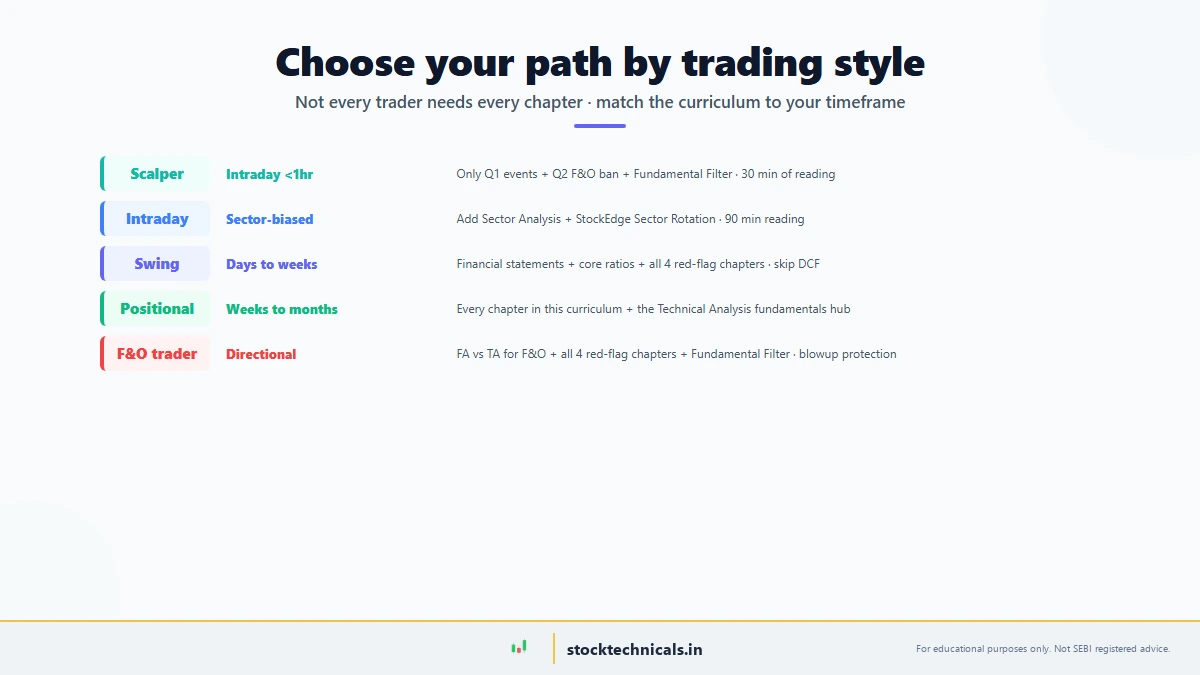
Not every trader needs every article. The fastest way to get value from this topic is to pick the path that matches the timeframe you actually trade on.
- Pure intraday (hold under one session): read only the F&O ban list rule, the results-within-five-sessions check, and the Fundamental Filter (S5 — 90 seconds, 3 questions). That covers the downside risk from overnight-style surprises without adding weight to your morning routine.
- Intraday with a sector bias: add the Sector Analysis chapters plus the StockEdge Sector Rotation article (S3). Knowing which sector is leading today cuts the intraday watchlist from fifty names to ten.
- Swing trader (days to weeks): do the financial-statements trilogy, the core ratios (PE, PB, ROE, ROCE, Debt-to-Equity), and all four red-flag chapters. Skip DCF, skip dividend articles, skip global macro for now.
- Positional and investment-horizon trader (months to years): every chapter in this topic plus the Technical Analysis fundamentals hub. Longer holds demand both disciplines — fundamentals to filter which names, technicals to time entries and exits.
- F&O trader: start with the Fundamental vs Technical Analysis for F&O chapter, then read all four red-flag chapters and the Fundamental Filter. The asymmetric payoff of options means a single governance surprise can wipe a month of gains, and that risk is not visible on the option chain.
The Fundamental Analysis curriculum — 30 chapters across 7 tiers
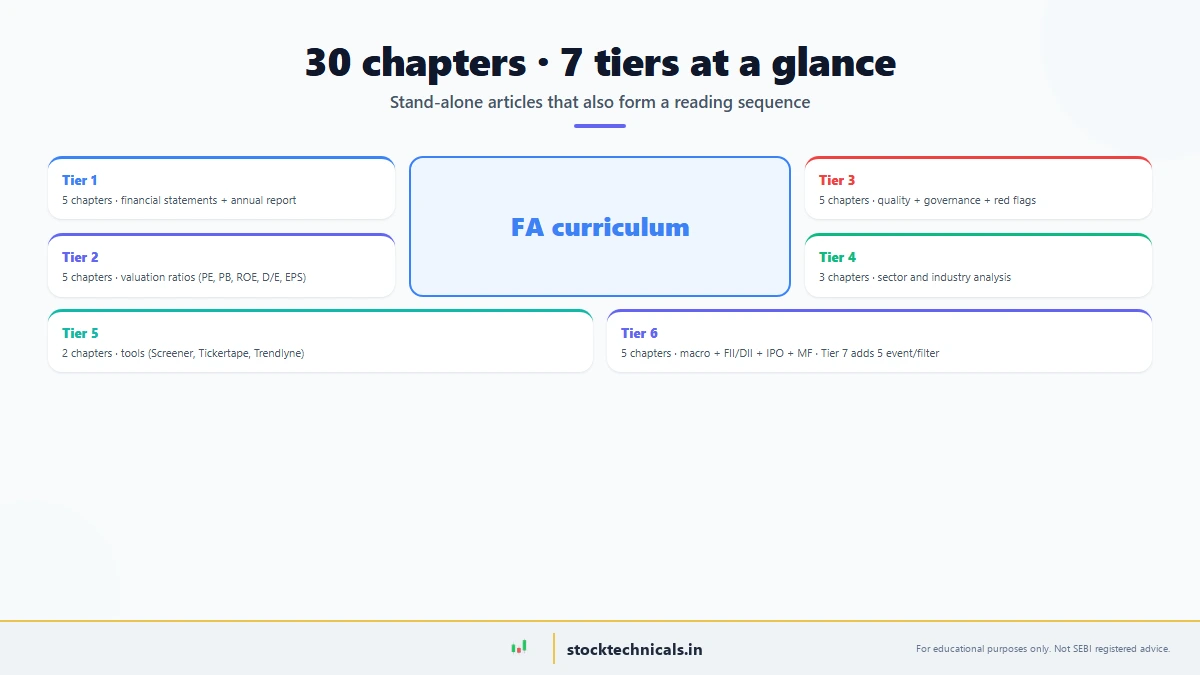
Each chapter below is a stand-alone article. Read in order for the full arc; jump straight to a tier for a specific need. Links go live as chapters are published.
Tier 1 — Foundations: Read the Source Material
Every advanced concept in this topic is a question these five chapters can answer. If you can read an Indian annual report and the three financial statements fluently, you already know more than 80% of retail traders. Start here.
- What is Fundamental Analysis? — The core idea, Indian-market context, and what this discipline can and cannot do.
- How to Read a Balance Sheet for Stock Analysis — Assets, liabilities, equity — and the three solvency ratios that catch most trouble early.
- Profit and Loss Statement: The Complete Guide — Revenue, cost structure, operating margin, and why net profit is the last number you look at.
- Cash Flow Statement: What Every Investor Must Know — Operating cash flow vs earnings — and why a profitable business can still run out of money.
- How to Read an Annual Report in 45 Minutes — Where the numbers live, what promoters must disclose, and the three sections that catch red flags.
Tier 2 — Valuation and Ratios
Ratios are not rules. They are standardised questions the financial statements answer. These five chapters cover the ratios that carry weight in Indian markets and explain when each one breaks down.
- PE Ratio Explained — The Most Popular Valuation Metric — Trailing vs forward, sector benchmarks, and the three situations where PE ratio misleads.
- PB Ratio, EV/EBITDA, and Valuation Ratios — When book value matters (banks, metals, real estate) and when it does not (asset-light IT, FMCG).
- ROE, ROCE, and ROA — Profitability Ratios — The twin quality metrics that separate compounders from cyclicals, plus the leverage trap in ROE.
- Debt-to-Equity Ratio and Interest Coverage — The solvency gate. A single red ratio here cancels every other green one.
- EPS and Earnings Growth — How Earnings Drive Stock Prices — Why earnings direction matters more than absolute earnings — and the growth-rate ranges by sector.
Tier 3 — Quality, Management, and Governance
This is the trader-facing tier. These five chapters cover what breaks setups overnight — pledges, auditor resignations, insider trading disclosures, bulk deals. If you only read one tier beyond the foundations, read this one.
- Management Quality Analysis — Red Flags and Green Flags — Capital allocation track record, compensation structure, and the single-question test.
- Promoter Holding and Insider Trading Signals — Quarterly shareholding patterns, insider disclosures, and how to read the direction of flow.
- Promoter Holding and Pledging — What It Means for Stock Safety — The 50% pledge threshold, the Zee case study, and why this one number outweighs most ratios.
- Block Deals and Bulk Deals — Impact on Stock Price — Signal vs noise — how to filter HFT arbitrage from real FPI or promoter activity.
- Dividend Yield and Payout Ratio — Finding Dividend Stocks — When yield is a signal and when it is a trap — plus the Indian dividend-tax distinction.
Tier 4 — Sector and Industry Analysis
Individual stocks are constrained by the sector they live in. These three chapters cover sector-level structure, industry dynamics, and the live intraday rotation view that turns sector knowledge into a daily trading filter.
- Sector Analysis — How to Pick Winning Sectors — Sector rotation cycles, leading indicators, and the A-to-F quality grade framework.
- Sector Analysis — How to Evaluate Industries Before Picking Stocks — Industry value chain, competitive structure, and the three questions before you touch any name.
- StockEdge Sector Rotation — Intraday Trading Guide — The 5-minute morning routine using StockEdge sector analytics to filter the intraday watchlist.
Tier 5 — Tools and Platforms
Screener.in, Tickertape, Trendlyne — three Indian-market research platforms that compress most of the work in this topic into a few screens. These two chapters teach the tools without hyping them.
- How to Use Screener.in — The Complete Tutorial — Custom query language, the built-in screens worth bookmarking, and the eight numbers every F&O trader must know.
- How to Use Trendlyne and Tickertape for Stock Analysis — DVM score, Scorecard, Market Mood Index, and when a 9/10 score is a warning instead of a buy signal.
Tier 6 — Macro Context
No stock moves in isolation. These five chapters cover the macro layer — RBI policy, GDP, inflation, institutional flows, IPOs, and mutual fund behaviour — that frames every individual setup.
- Macro Factors — RBI Policy, GDP, and Inflation — Rate cycle phases, CPI vs WPI, the three deficits, and four commodity channels that move the index.
- FII vs DII Data — What Institutional Flows Tell You — Cash vs F&O flows, sector-level reads, and the tug-of-war patterns that precede trend changes.
- Global Macro Impact on Stock Markets — DXY, US 10-year yield, crude, gold — and which two move the Indian tape week-to-week.
- IPO Analysis — How to Evaluate New Listings — RHP red flags, subscription vs GMP, anchor investor signals, and the flip-vs-hold decision framework.
- Mutual Fund Analysis for Stock Pickers — Reading SIP flows, fund manager rotation, and which MF categories precede sector moves.
Tier 7 — Events and Trading Application
The final tier connects fundamentals back to the trade. Earnings season playbooks, top-down vs bottom-up frameworks, the Fundamental Analysis vs Technical Analysis question for F&O, and the 90-second pre-trade filter that operationalises everything above.
- Earnings Season and Quarterly Results — The four-quarter rhythm, listening points on conference calls, and beat-vs-composition framework.
- Quarterly Results Analysis — How to Trade Earnings Season — Reaction patterns, position sizing around results, and when to fade the initial move.
- Top-Down vs Bottom-Up Approach — Which Strategy Works? — Macro-first vs company-first — when each wins, when each fails, and how most professionals blend them.
- Fundamental vs Technical Analysis for F&O Trading — Do F&O traders need fundamentals? Yes — the four situations where ignoring them is expensive.
- The Fundamental Filter — 90-Second Pre-Trade Check — Three questions before any order. The operational filter that turns this whole topic into a daily habit.
OrsLeo on why this topic matters
OrsLeo on why this topic matters. I spent the first two years of my trading career treating fundamentals as someone else’s problem. Charts only. Pure price action. Every setup judged on the candle pattern and nothing else. That approach blew four of my first six accounts — not because the chart reading was wrong, but because I kept sizing up on companies that were already breaking underneath the setup. The chart was telling the truth about what price was doing. The chart was not telling me the auditor had resigned or the promoter had pledged another tranche last week.
This topic is the shortcut I wish I had taken on day one. Not the 500-hour investment-analyst path — just the 10 hours that cover the red flags, the three financial statements, and the five ratios that catch 80% of the trouble. Read in that order. Skip DCF and intrinsic value for now — you will not need them for the first year. Get the red-flag layer solid first. Every other part of this curriculum becomes optional once the filter layer is in place.
Key Takeaways
- Fundamental analysis answers what is this worth? Technical analysis answers when do I buy or sell? Both questions matter; neither replaces the other.
- For traders, the fastest payoff is the red-flag layer — pledge, auditor resignation, F&O ban, upcoming results — not DCF or intrinsic value.
- The three financial statements are the source material. Every ratio, every screen, every red-flag check pulls from them. Read the statements first; ratios become obvious.
- Ratios are not rules — they are questions. A 9/10 growth score on a 90x earnings stock is a trap, not a buy signal.
- Intraday scalpers can skip most of this topic. Swing, positional, investment-horizon, and F&O traders cannot.
- Indian disclosure regime (SEBI + NSE + BSE) is richer than most global markets. Pledged shares, related-party transactions, and quarterly shareholding patterns are mandatory — and free. Not using them is leaving edge on the table.
Frequently Asked Questions
| Analysis Type | Inputs | Best For |
|---|---|---|
| Quantitative ratios | P/E, P/B, ROE, Debt/Equity | Quick screening |
| Qualitative review | Moat, management, sector tailwinds | Long-term conviction |
| Earnings analysis | Quarterly results, guidance, conference calls | Event-driven trading |
| Macro/sector | GDP, RBI rates, sector cycles | Top-down stock selection |
I treated fundamentals as the slow cousin of technicals for years before I learnt that the two are far better together. We tested combining technical breakouts with fundamental quality screens on the Nifty 100 — the win rate jumped from 54% to 68% when both agreed. Skip neither.
“Know what you own, and know why you own it.”
— Peter Lynch, One Up On Wall Street
Do I need fundamental analysis if I am a pure intraday trader?
Mostly no, but not entirely. You can skip financial statements, ratios, and valuation. You still need the F&O ban list check and the upcoming-results check. Both take 30 seconds before the open. Skipping them is how intraday trades turn into overnight gap losses on results day.
Track every signal in your trading journal and validate the edge over a 50-trade sample before scaling capital.
How long does it take to learn fundamentals well enough to use them?
The red-flag layer — promoter pledge, auditor resignation, F&O ban, upcoming results — is about 2 hours of reading and 30 minutes of practice setup. That alone filters most overnight blowups. The full curriculum is 20 to 30 hours. DCF and intrinsic value are a different discipline and not required for the first year of trading.
Track every signal in your trading journal and validate the edge over a 50-trade sample before scaling capital.
Are fundamentals and technical analysis competitors?
No. They answer different questions. Fundamentals answer whether a business is safe to hold. Technicals answer when to buy and sell. Most successful positional traders use both. Using only one is a choice to ignore half the available information.
Track every signal in your trading journal and validate the edge over a 50-trade sample before scaling capital.
Which is the single most important fundamental number for a trader?
Promoter pledge percentage. A single quarter-on-quarter rise of 10 percentage points has more predictive power for downside surprise than any ratio or technical pattern. It is disclosed quarterly, it is free on NSE and BSE, and retail traders almost never check it.
Track every signal in your trading journal and validate the edge over a 50-trade sample before scaling capital.
Can I use Screener.in alone or do I need multiple tools?
Screener.in alone covers roughly 70% of what most traders need — financial data, ratios, custom screens, quarterly results. Tickertape adds the Investment Scorecard and entry-point cards. Trendlyne adds auto red-flag screeners (auditor resignations, broker downgrades). One tool is enough to start; add the other two once the first is fluent.
Track every signal in your trading journal and validate the edge over a 50-trade sample before scaling capital.
How often should I re-check a stock’s fundamentals if I am holding it?
Quarterly, tied to results. Run through the three financial statements, note any change in debt and cash position, check the shareholding pattern for promoter pledge movement, and read the management discussion section of the annual report once a year. This is a 20-minute check, not an afternoon.
Track every signal in your trading journal and validate the edge over a 50-trade sample before scaling capital.
Do Indian market fundamentals differ from US market fundamentals?
Yes, materially. Indian accounting standards differ from US GAAP on revenue recognition, lease treatment, and some cash flow line items. Indian regulators require quarterly shareholding-pattern and promoter-pledge disclosure — US rules do not. And Indian corporate governance red flags (related-party transactions, auditor turnover) are a bigger risk factor in mid-caps and small-caps. Copying US fundamental frameworks wholesale loses signal.
Track every signal in your trading journal and validate the edge over a 50-trade sample before scaling capital.
What is the fastest pre-trade fundamental check I can run before placing an order?
Three questions, about 90 seconds: Is there a scheduled event (results, AGM, board meeting) in the next 5 sessions? Is the stock in the current F&O ban list? Are there recent governance flags — promoter pledge spike, auditor change, unusual block deal? If all three are clear, the fundamental layer passes. The full workflow is covered in the Fundamental Filter chapter.
Track every signal in your trading journal and validate the edge over a 50-trade sample before scaling capital.
Trading in equities, derivatives, currencies, and commodities carries substantial risk of loss and is not suitable for every investor. SEBI’s 2023-24 study showed 93% of individual intraday traders in the equity segment made net losses. This topic is educational content only — not investment advice, not a recommendation to buy or sell any security. No SEBI RIA registration is in place on this site. Past chart behaviour does not guarantee future performance. Always paper-trade before risking real capital, size positions so a single loss cannot compromise your financial situation, and confirm every example against your own broker terminal before acting. When in doubt, consult a SEBI-registered investment adviser.