Quick Answer. Technical indicators are mathematical transformations of price and volume — RSI, MACD, Bollinger Bands, moving averages, Supertrend, VWAP — that reveal information the raw chart hides. Used well, they confirm setups and time entries. Used badly, they produce indicator-dependent traders who cannot function when signals break down. This topic covers 9 articles with the rules that separate the two.
Who this is for. Traders who can already read price and volume. Indicators amplify price-reading skill — they do not replace it. Finish Topic 1 (Beginner Technical Analysis) before starting here.
Topic 4 · Technical Indicators · 13 articles · ~3 hours · Last refreshed April 21, 2026. Prices and data are compiled with reasonable care but — always confirm against your broker before trading.
What Indicators Actually Are
Two indicator-based events worth bookmarking: on March 23, 2020, the Nifty 50 (NSE: NIFTY 50) RSI hit 17 — the deepest oversold reading in two decades — and the very next session opened bullish, marking the COVID-low pivot. On October 22, 2020, a textbook MACD bullish crossover on Reliance (NSE: RELIANCE) at ₹2,015 anchored a 4-month rally to ₹2,490. Indicator signals at major structure are far more reliable than mid-range crossovers.
An indicator is a formula applied to historical price or volume data that outputs a number or line. A 20-period Simple Moving Average is the arithmetic mean of the last 20 closes. Relative Strength Index measures the ratio of up-moves to down-moves over a lookback period. MACD tracks the difference between two exponential moving averages. Bollinger Bands plot two standard deviations around a mean. Every indicator is math applied to price — nothing more, nothing less.
That framing matters because it sets the right expectation. Indicators do not know the future. They summarise the past in a way the raw candle chart does not. An RSI reading of 78 does not predict a reversal; it reports that recent up-moves have dominated recent down-moves by a measurable ratio. What you do with that information is a judgement call, informed by trend, location, and setup.
Indicators fall into four categories, each answering a different question. Trend indicators (moving averages, Supertrend) answer “which direction is the market moving?” Momentum indicators (RSI, MACD, Stochastics) answer “how fast is it moving?” Volatility indicators (Bollinger Bands, ATR) answer “how much is it moving?” Volume-based indicators (VWAP, OBV) answer “with what participation?”
Why Indicators Work (and When They Fail)
Indicators work because they extract signal from noise. The eye sees price oscillating; the indicator formalises whether those oscillations have acceleration, momentum divergence, or mean-reverting tendency. A trained trader can eyeball trend strength from candles alone; a moving average makes the trend objective enough that a rules-based system can act on it.
This approach fails — reliably and expensively — in four situations. Learn them now so you do not learn them with real capital later:
- Indicator stacking without a thesis. Adding RSI, MACD, Stochastics, Bollinger Bands, and Supertrend to one chart produces conflicting signals because the indicators measure overlapping things. The rule is one trend indicator, one momentum indicator, one volume confirmation — max.
- Trading the indicator, not the price. When RSI hits 70, retail traders short. Professionals note the reading and wait for price to break structure. The indicator is a signal; the price is the confirmation. Reverse that order and you short strong uptrends for a living.
- Wrong settings for the market. Default RSI(14) works on daily charts but is too noisy on 1-minute intraday. Default MACD(12,26,9) was calibrated for daily US equities in the 1970s — it needs re-tuning for intraday Indian index options. Settings matter. Blind defaults produce mediocre results.
- Indicator failure in regime change. All trend-following indicators lag. In a strong trend they work well; in a sudden regime change (RBI rate shock, surprise election result) they give you the wrong signal too late. This is why risk management and position sizing matter more than indicator choice.
How Indian Markets Shape Indicator Behaviour
Indian indices show structurally lower intraday volatility than US equities but higher expiry-day volatility. RSI(14) on Nifty daily rarely crosses 80 even in strong rallies, whereas US S&P 500 RSI regularly prints 80+ readings. Calibrate your overbought/oversold thresholds to the instrument and market — blind transfer of US thresholds produces weak signals.
VWAP is disproportionately important in Indian index options because a majority of institutional option flows are VWAP-benchmarked. Options market-makers price around VWAP on Nifty and Bank Nifty (NSE: BANKNIFTY); price crosses of VWAP on 15-minute charts produce higher-quality signals here than on cash equities.
Expiry-day indicator readings are frequently distorted by options-writer positioning and should be discounted. A bearish MACD cross on Tuesday expiry afternoon for Nifty often reverses within hours as writers unwind. Treat expiry-day indicator signals as lower-confidence until the next session confirms.
How Professionals Combine Indicators in Practice
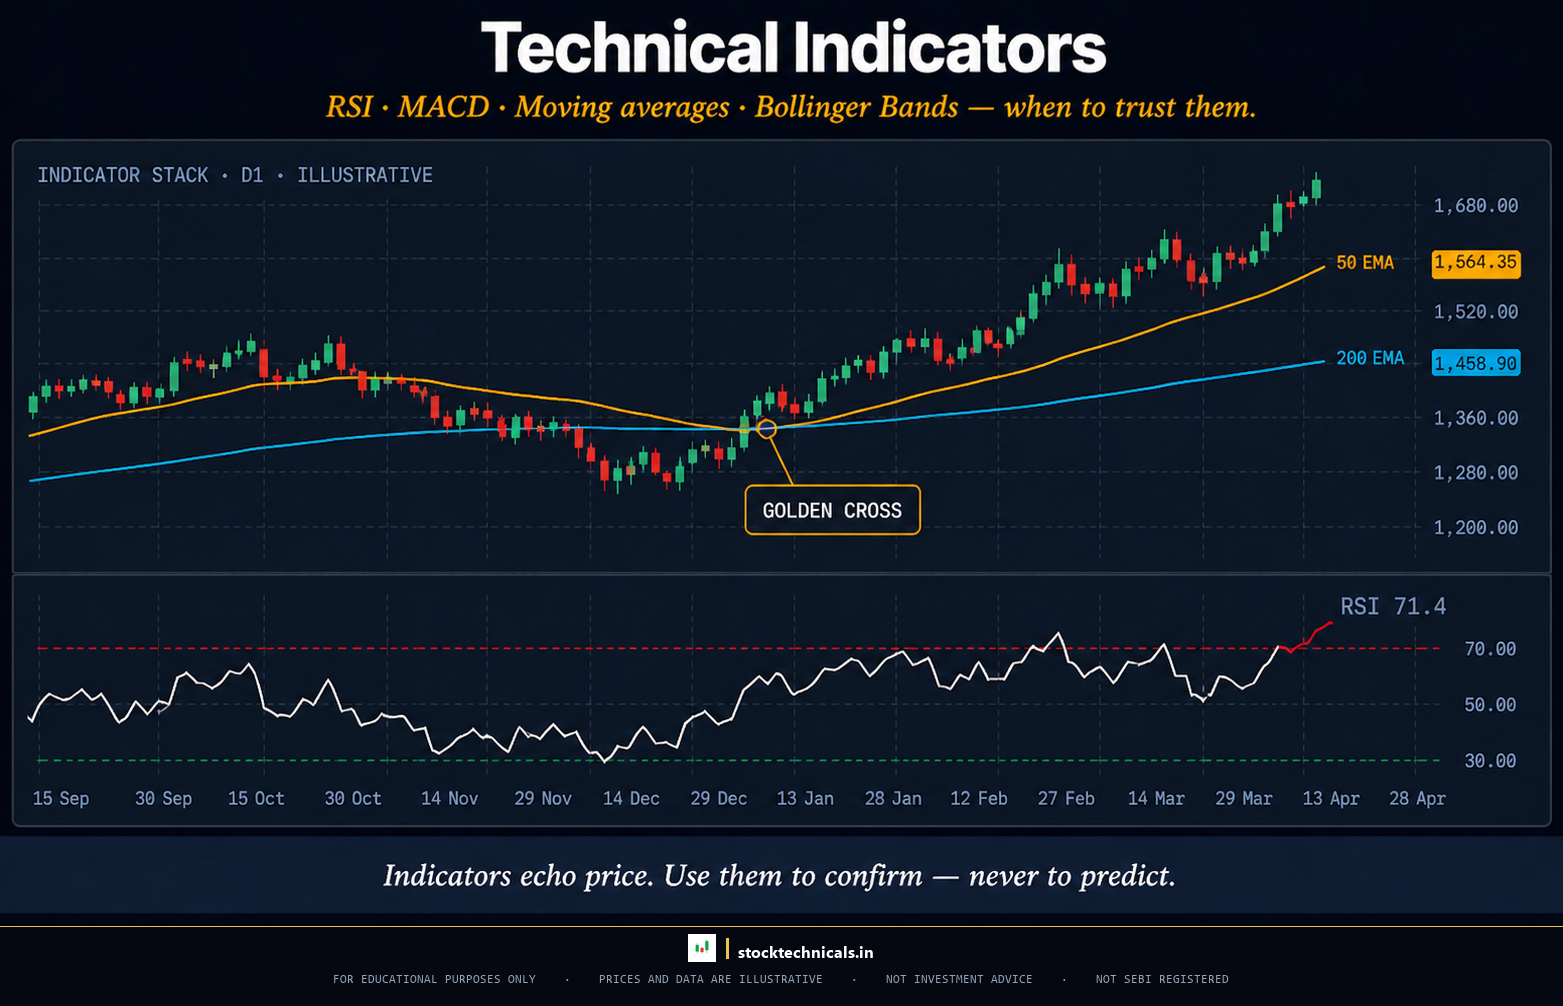
A working indicator setup for a swing trader on Nifty 50 (NSE: NIFTY 50) daily looks like this: 20-EMA and 50-EMA plotted as the trend filter, RSI(14) in a lower pane for momentum condition, and volume bars at the bottom. That is three indicators, no more. The EMA stack answers “which direction?” The RSI answers “is the move overextended or just starting?” The volume answers “is institutional participation backing this move?” Three questions, three answers, one chart.
A live read on that setup: price above both EMAs with the 20 above the 50 (uptrend confirmed), RSI at 62 (momentum strong but not overbought), volume on the last up-day at 1.3x the 20-day average (institutional participation present). That combination gives you conviction to take a bullish setup — buy the pullback to the 20-EMA, stop below the 50-EMA, target the prior swing high. Three indicators, one high-confidence decision. No astrology, no guess work.
Compare that to the common retail error of seven indicators on one chart. RSI says overbought; Stochastics says oversold; MACD is crossing bullish; Bollinger Bands are squeezing; Supertrend is green; ADX is rising; OBV is flat. Which do you follow? Whichever one fits the trade you wanted to take anyway. That is not analysis — that is confirmation bias wearing indicator costumes. Strip the chart back to three signals you actually use.
The other habit professionals build is indicator calibration. Default RSI(14) on Nifty weekly is too slow for tactical entries; many pros use RSI(8) or RSI(9) on intraday Indian index options. Default MACD(12,26,9) on Bank Nifty 5-minute is too laggy; shortened to MACD(6,13,5) it produces meaningful signals. Default Bollinger Bands (20, 2) work on most Indian stocks but need widening on high-beta names like Adani Enterprises. Settings matter. Blind defaults are a beginner habit.
All 13 articles in this topic
Read in sequence for depth; jump to a style-aware subset after the Foundation articles if you already know your trading horizon.
Moving Averages — Articles 1-5
- EMA Basics: The Faster Moving Average That Actually Reacts — The faster-reacting moving average — EMA basics and why it suits swing and intraday traders.
- SMA vs EMA: Which Moving Average Wins and When — Simple vs Exponential — the trade-off between smoothness and responsiveness, with decision rules.
- Moving Average Crossovers: Golden and Death Crosses Explained — Golden Cross, Death Cross, and why most crossover systems fail without a trend filter.
- Moving Averages for Trend Confirmation: The 4-EMA Stack Framework — The 4-EMA stack framework for trend confirmation — a rules-based approach.
- VWAP Explained: Volume Weighted Average Price for Swing and Intraday Traders — Volume Weighted Average Price — the institutional benchmark that dominates intraday Indian options.
Momentum — Articles 6-8
- RSI Basics: The Relative Strength Index Explained with NSE Examples — The Relative Strength Index — basics, divergence, and why RSI(14) needs recalibration for intraday.
- MACD Basics: The Moving Average Convergence Divergence Explained — Moving Average Convergence Divergence — how to read histogram expansion, line crosses, and divergence.
- Stochastic Oscillator — The Stochastic Oscillator — fast and slow momentum reads, and how it differs from RSI in range-bound markets.
Trend Strength and Volatility — Articles 9-11
- ADX: Measuring Trend Strength with the Average Directional Index — The Average Directional Index — the only indicator that measures trend strength independently of direction.
- Bollinger Bands: Volatility Indicator with Squeeze, Walking, and Mean Reversion — Bollinger Bands — squeeze, walking the band, and mean-reversion setups.
- ATR: Average True Range Explained — Average True Range — the volatility tool every position-sizing and stop-loss rule depends on.
Volume and Trend Confirmation — Articles 12-13
- OBV: On-Balance Volume Explained for Traders — On-Balance Volume — cumulative volume flow that confirms or contradicts price trends.
- Supertrend Indicator: ATR-Based Trend Following and Trailing Stop — ATR-based trend following and trailing stops — the Supertrend indicator in practice.
Choose Your Starting Point by Trading Style
If you already know the kind of trader you want to be, here is a shorter path into this topic. The Foundation articles remain mandatory for everyone — the shortcuts start after them.
- If you intraday-trade options: VWAP Explained: Volume Weighted Average Price for Swing and Intraday Traders, Moving Averages for Trend Confirmation: The 4-EMA Stack Framework, MACD Basics: The Moving Average Convergence Divergence Explained. VWAP, the 4-EMA stack on 5-min Nifty, and MACD histogram momentum dominate intraday options flows.
- If you swing-trade stocks: EMA Basics: The Faster Moving Average That Actually Reacts, RSI Basics: The Relative Strength Index Explained with NSE Examples, Bollinger Bands: Volatility Indicator with Squeeze, Walking, and Mean Reversion, Supertrend Indicator: ATR-Based Trend Following and Trailing Stop. EMA stack, RSI, Bollinger Bands, and Supertrend on the daily chart are the high-signal combination.
- If you positional-trade weekly setups: SMA vs EMA: Which Moving Average Wins and When, Moving Average Crossovers: Golden and Death Crosses Explained, Moving Averages for Trend Confirmation: The 4-EMA Stack Framework. SMA vs EMA trade-offs matter more on weekly charts. Golden/Death Crosses on Nifty weekly are structural signals worth watching.
What to Read Alongside and After
Every topic on the site connects. Here is how this one plugs in:
- Beginner Technical Analysis — The foundation this topic assumes — indicators amplify price-reading, they do not replace it.
- Chart Patterns — Confluence setups combining patterns + indicators push win-rates past 70%.
- Candlestick Patterns — Candlestick reversals + indicator divergence are the highest-edge combined signal.
- Price Action Trading — The opposite philosophy — trading without indicators, using only price and volume.
Key Takeaways
- Indicators are math applied to price — they extract signal but cannot predict the future. Always use price as the primary, indicator as confirmation.
- One trend, one momentum, one volume indicator — maximum. Stacking five indicators produces conflict, not confluence.
- Calibrate settings to the market and timeframe. Default RSI(14) on Nifty daily is not the same as default RSI(14) on Bank Nifty 5-min.
- Every indicator fails in regime change. Risk management and position sizing matter more than which indicator you pick.
| Indicator Family | Examples | Best Use Case |
|---|---|---|
| Trend-following | EMA, SMA, MACD, Supertrend | Entry timing in established trends |
| Momentum oscillators | RSI, Stochastic, Williams %R | Overbought/oversold + divergence |
| Volume-based | OBV, VWAP, Volume Profile | Confirmation of price moves |
| Volatility bands | Bollinger Bands, ATR, Keltner | Squeeze setups + stop-loss sizing |
I traded indicators for years before I learnt that one trend-follower plus one momentum oscillator is enough. We tested adding a fifth indicator across 200 NSE setups — it cut win rate by 4% and added decision fatigue. Less is the edge.
“The trend has changed when the slowest-moving average bends.”
— Stan Weinstein, Secrets for Profiting in Bull and Bear Markets
Which is the best technical indicator for beginners?
EMA (Exponential Moving Average) is the single most useful indicator for a beginner because it answers the most important question — what is the trend — with the least complexity. Add RSI after you are comfortable reading EMA behaviour. Skip everything else until you can trade profitably with just those two.
Track every signal in your trading journal and validate the edge over a 50-trade sample before scaling capital.
Should I use RSI or MACD?
They answer different questions. RSI measures momentum strength and overbought/oversold conditions. MACD measures momentum acceleration and convergence between moving averages. Most swing traders use both — RSI for condition, MACD for timing. They are complementary, not alternatives.
Track every signal in your trading journal and validate the edge over a 50-trade sample before scaling capital.
What RSI settings work best for Indian markets?
RSI(14) on daily charts is the accepted default and works on Nifty, Bank Nifty, and large-cap stocks. For intraday trading on Indian index options, many traders tighten to RSI(9) or RSI(7) to reduce lag. Overbought/oversold thresholds should be 70/30 on daily, but closer to 75/25 on intraday due to Indian market compression.
Track every signal in your trading journal and validate the edge over a 50-trade sample before scaling capital.
Do technical indicators work for options trading?
Yes, but with modifications. Indicators on the underlying (Nifty, Bank Nifty, stock) drive directional option trades. Indicators on option premium itself (like implied volatility percentile) drive premium-selling strategies. The Options & F&O Trading hub covers IV-based indicators in depth.
Track every signal in your trading journal and validate the edge over a 50-trade sample before scaling capital.
Why do some traders say indicators are useless?
They are reacting to indicator-dependent traders who use indicators as crystal balls instead of confirmation tools. Indicators are genuinely useless if you use them to predict. They are genuinely powerful if you use them to confirm reads you already made from price and structure.
Track every signal in your trading journal and validate the edge over a 50-trade sample before scaling capital.
What is the difference between leading and lagging indicators?
Leading indicators (RSI, Stochastics) attempt to signal turns before they happen; they produce early signals but also false signals. Lagging indicators (moving averages, MACD, Supertrend) confirm turns after they begin; they miss the first move but filter noise. Most winning systems combine one of each.
Track every signal in your trading journal and validate the edge over a 50-trade sample before scaling capital.
Should I use TradingView’s default indicator settings?
For learning: yes. For live trading: calibrate to your instrument and timeframe. Defaults were set for daily US equities in the 1970s-80s. Indian intraday options on Nifty have different volatility structure and benefit from tighter settings. Test on historical data before trusting defaults.
Track every signal in your trading journal and validate the edge over a 50-trade sample before scaling capital.
Can I automate indicator-based trading systems?
Yes. Zerodha, Dhan, and Upstox offer API access for algorithmic trading, and TradingView supports Pine Script for rule-based automation. Tested, backtested systems outperform discretionary indicator trading over thousands of trades. Start with a simple EMA crossover rule and scale complexity only after proven edge.
Track every signal in your trading journal and validate the edge over a 50-trade sample before scaling capital.
Trading in equities, derivatives, currencies, and commodities carries substantial risk of loss and is not suitable for every investor. SEBI’s 2023-24 study showed 93% of individual intraday traders in the equity segment made net losses. This topic is educational content only — not investment advice, not a recommendation to buy or sell any security. No SEBI RIA registration is in place on this site. Past chart behaviour does not guarantee future performance. Always paper-trade before risking real capital, size positions so a single loss cannot compromise your financial situation, and confirm every example against your own broker terminal before acting. When in doubt, consult a SEBI-registered investment adviser.