
Quick Answer: Volume is the total number of shares or contracts traded in a given period. Rising price with rising volume confirms the move is genuine. Rising price with falling volume warns of weakness. Volume validates every breakout, breakdown, and trend continuation.
Key Takeaways
- Volume measures market participation and conviction behind every price move
- Always compare volume to the 20-day moving average — never use absolute numbers
- Price up + volume up = healthy advance; price up + volume down = warning signal
- Breakouts require at least 1.5x average volume for confirmation
- Delivery percentage (NSE data) separates institutional conviction from intraday noise
- OBV and VWAP are the two most important volume indicators for traders
Price tells traders what happened. VOLUME — the total number of shares or contracts traded during a specific period — tells traders how convinced the market was about that move. A stock rallying 5% on 10x its average volume is a fundamentally different event from the same stock rallying 5% on half its normal volume. The first signals institutional conviction backed by real capital. The second might be a handful of retail orders pushing a thin order book around.
Quick Answer: Volume is the total number of shares or contracts traded in a given period, and it measures the conviction behind every price move. Rising price with rising volume confirms a genuine move; rising price with falling volume warns of weakness. On NSE, volume plus the delivery percentage (shares held overnight) from the daily bhavcopy reveals whether an advance is backed by real buyers or just intraday speculation.
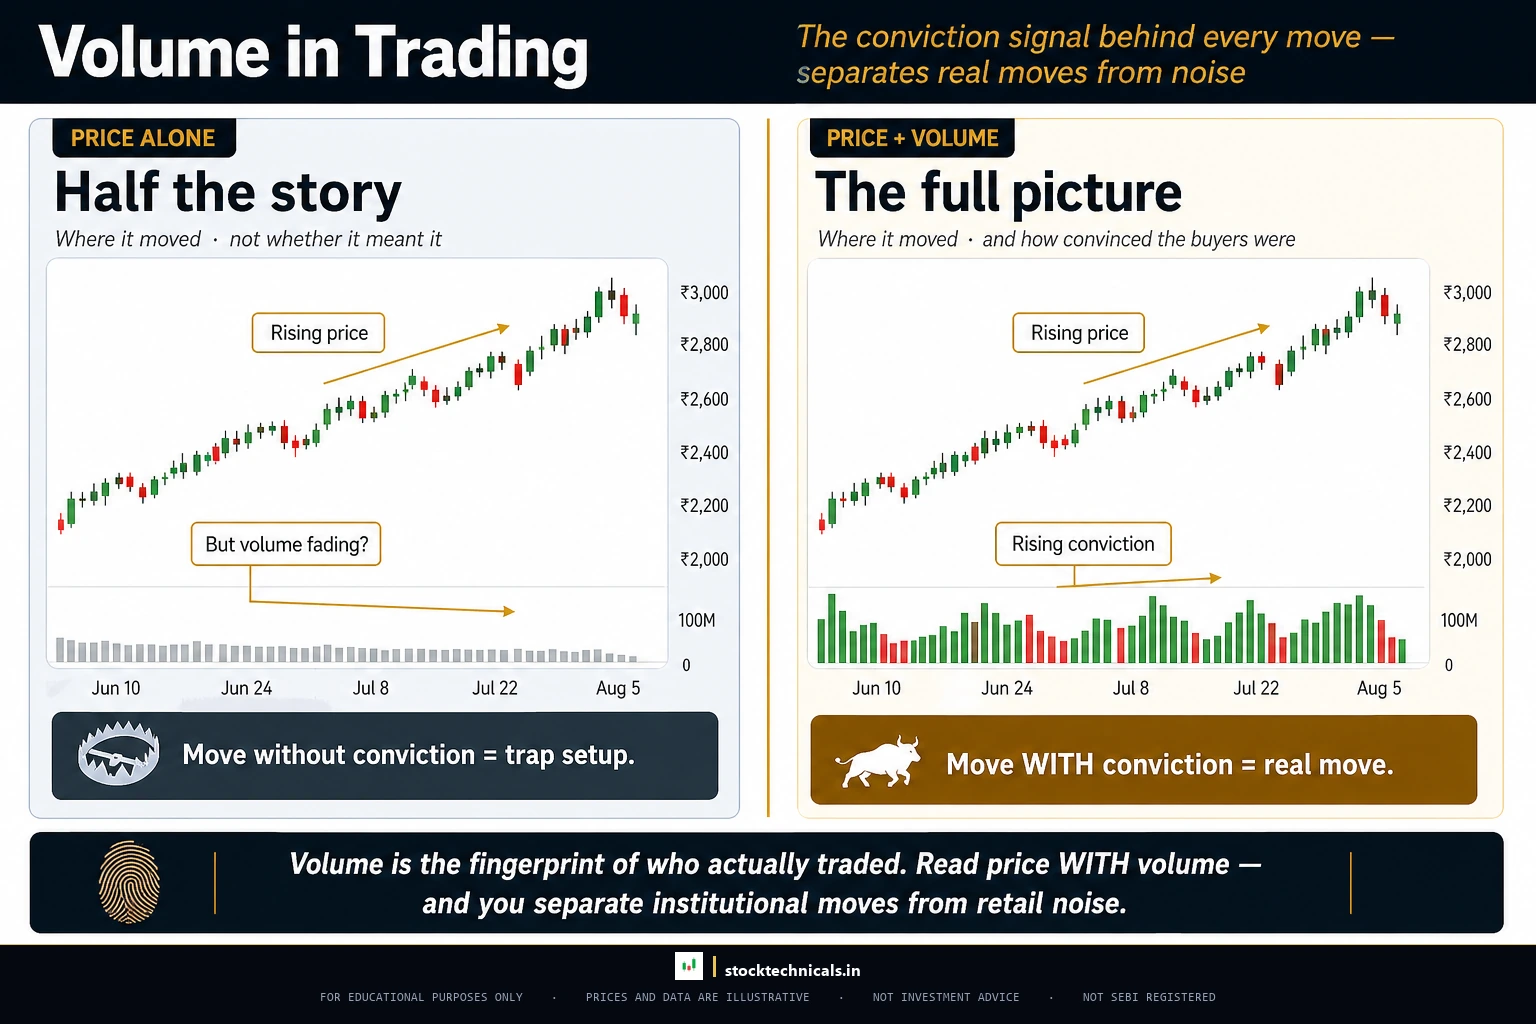
Every candlestick on a chart has a volume bar beneath it. Most beginners ignore those bars entirely. That single habit separates traders who get trapped in false moves from traders who wait for confirmation before committing capital.
This article breaks down everything traders need to know about volume — from reading the basics to spotting divergences, confirming breakouts, and understanding the unique delivery-volume data that NSE provides. All examples use real price and volume data from NSE-listed stocks.
What Is Volume and Why Does It Matter

VOLUME is the total number of shares (in equities) or contracts (in F&O) that change hands during a given period — one minute, one hour, one day, one week. If 50 lakh shares of Reliance Industries (NSE: RELIANCE) traded on a particular day, that day’s volume is 50,00,000.
Volume represents participation. High volume means many market participants — institutions, proprietary desks, HNIs, retail traders — agreed that it was worth transacting at that price level. Low volume means the price moved with little conviction.
Think of volume as the weight behind a punch. A stock breaking above resistance on 3x its average volume is a heavyweight knockout. The same stock crossing the same level on 30% of its average volume is a light tap that the market can easily reverse.
Where Volume Appears on Charts
On any standard candlestick chart, volume bars appear along the bottom of the chart. Each bar corresponds to one candle above it:
- Green (or hollow) volume bars — the closing price was higher than the opening price for that period
- Red (or filled) volume bars — the closing price was lower than the opening price
The height of each volume bar shows the relative number of shares traded. Taller bars mean more volume. On TradingView, volume bars are colour-coded automatically and scale dynamically with the chart.
Volume Is Relative, Not Absolute
A stock like HDFC Bank that regularly trades 4-5 crore shares daily will have a “high volume” day at 15+ crore shares. A mid-cap stock trading 2 lakh shares daily will have a “high volume” day at 8 lakh shares.
This is why raw volume numbers are meaningless without context. Traders compare each day’s volume to a 20-day simple moving average of volume — the most common benchmark. The standard rule:
- Volume above 1.5x the 20-day average = noteworthy
- Volume above 2x the 20-day average = significant
- Volume above 3x the 20-day average = exceptional event (earnings, news, institutional activity)
On October 25, 2017, On October 25, 2017, State Bank of India traded 26.27 crore shares — 10.4x its 20-day average volume — on the day the government announced a ₹2.11 lakh crore recapitalization package for public-sector banks. The stock closed +16.35% at ₹296.10 (previous close ₹254.45), with an intraday peak near ₹317, the largest single-day gain for SBI since its 1994 listing per contemporary reports. That volume confirmed the move was backed by institutional conviction, not a retail-driven spike.
How to Read Volume Bars on a Chart

Reading volume is not complicated, but it requires discipline. Traders must look at volume bars in context — never in isolation.
The Three Questions
Every time a trader looks at a candle, three volume questions should follow:
Is today’s volume higher or lower than the 20-day average? This determines whether the move has conviction or not. A breakout on below-average volume deserves scepticism.
Is volume expanding or contracting over the last several sessions? Expanding volume during a trend confirms that fresh money is entering. Contracting volume suggests the move is running out of fuel.
Does volume confirm or contradict the price action? Price rising with rising volume is confirmation. Price rising with falling volume is a warning. This is the single most important skill in volume analysis.
Setting Up Volume on a Chart
On TradingView, volume is usually enabled by default. If not:
- Open any chart, click “Indicators” at the top
- Search “Volume” and select it
- The volume bars appear beneath the candlestick chart
- Add “Volume MA” (set to 20 periods) for the benchmark average line
On Zerodha Kite, volume bars are visible by default below the candlestick chart. The Studies menu allows adding volume-related overlays like OBV and VWAP. For a detailed walkthrough of setting up charts for the first time, see the TradingView setup guide.
Volume-Price Relationship: The Four Scenarios
The relationship between price movement and volume creates four distinct scenarios. Understanding these four combinations is the foundation of all volume analysis.
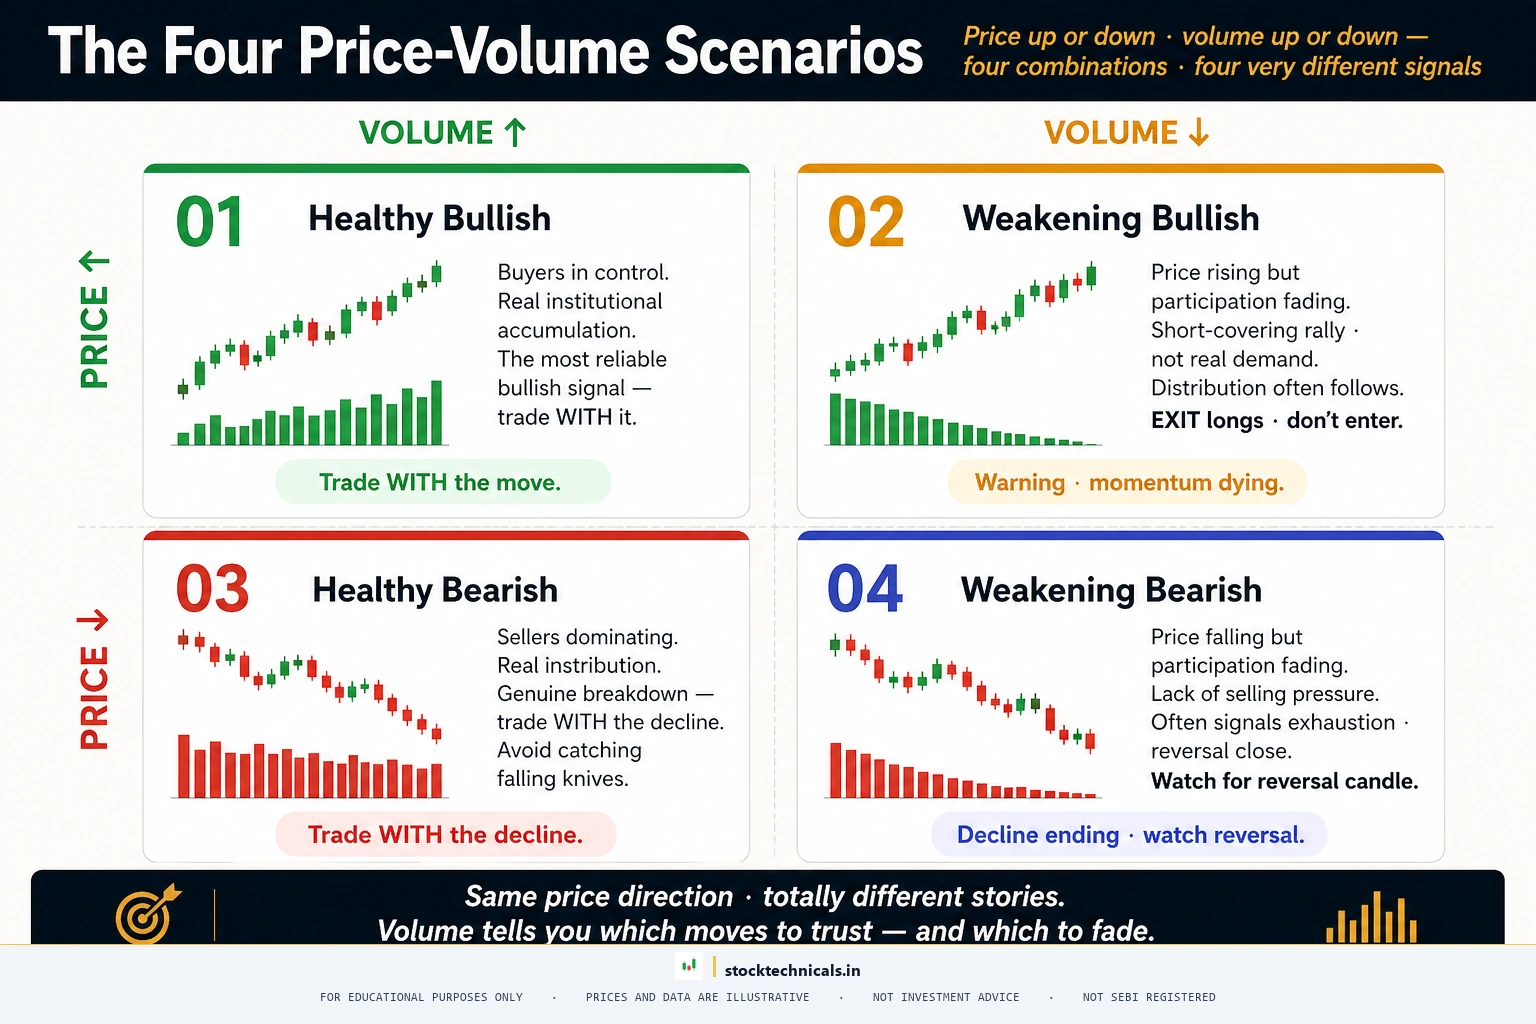
Price Up + Volume Up — Healthy Advance
When price rises and volume rises along with it, the advance is healthy and likely to continue. More buyers are stepping in at higher prices, confirming that the market believes the move is justified.
example: On February 22, 2017, Reliance Industries surged 10.97% to ₹297.93 on volume of 2.95 crore shares — 6.4x its 20-day average. This was the day Jio’s subscriber numbers and revenue trajectory became clear to the market. The volume confirmed that institutions were taking massive positions, not just retail traders chasing momentum. Reliance continued rallying for months after this signal.
This is the most bullish volume-price combination. Traders using breakout strategies look specifically for this pattern to confirm entry signals.
Price Up + Volume Down — Weak Rally, Warning Sign
When price rises but volume is declining, the advance lacks conviction. Fewer participants are willing to buy at each new high. This pattern often appears in the late stages of a rally before a reversal.
Think of it as a car climbing a hill while the engine loses power. The car might still be moving upward, but the momentum is fading.
This scenario is a VOLUME DIVERGENCE — a bearish warning signal. Traders who spot this divergence tighten their stop losses or begin taking partial profits. More on divergence in the section below.
Price Down + Volume Up — Panic Selling or Capitulation
When price drops sharply on high volume, it signals intense selling pressure. This can mean one of two things depending on context:
In a downtrend: Heavy selling continues as more holders give up. This often happens near the bottom — the final washout of weak hands before a reversal. It is known as CAPITULATION.
At support levels: If price drops to a known support level on high volume but closes near the high of the day, it can signal institutional buying. The volume represents a transfer of shares from weak hands (retail panic sellers) to strong hands (institutional accumulators).
Price Down + Volume Down — Orderly Decline, Low Urgency
When price drifts lower on declining volume, there is no panic. Sellers are not aggressive; buyers simply are not showing up. This pattern often appears during normal pullbacks within an uptrend — the kind that offers buying opportunities.
Low-volume pullbacks are the friend of trend-followers. They indicate that the sell-off is a rest period rather than a genuine reversal. When volume picks up again in the direction of the original trend, the pullback is likely over.
Volume Confirms Trends — The Core Principle

CHARLES DOW established this principle over a century ago, and it remains one of the six tenets of Dow Theory: volume should confirm the trend. In a healthy uptrend, volume should expand on rallies (up days) and contract on declines (pullback days). In a healthy downtrend, volume should expand on sell-offs and contract on relief rallies.
| Signal | High Volume | Low Volume |
|---|---|---|
| Breakout | Strong confirmation | Possible false breakout |
| Uptrend | Healthy momentum | Fading interest |
| At Resistance | Distribution possible | Quiet test |
| Sharp Decline | Capitulation near | May continue |
| Consolidation | Institutional accumulation | Indecision |
How to Spot a Healthy Trend Using Volume
Look at a 30-50 day stretch of any trending stock. Overlay the 20-day volume moving average. If the stock is in an uptrend and volume bars on green candles are consistently taller than volume bars on red candles, the trend has strong structural support.
Volume Dry-Up Signals a Trend Pause
When volume contracts to below 50% of the 20-day average for several consecutive sessions during a trend, the trend is pausing. This does not automatically mean the trend is reversing — it means participants are waiting. The next expansion in volume will reveal the direction of the next move.
Traders who understand timeframes monitor volume across multiple periods. A daily chart might show declining volume while a weekly chart still shows healthy participation — this context prevents premature exits.
Volume Divergence: The Early Warning Signal
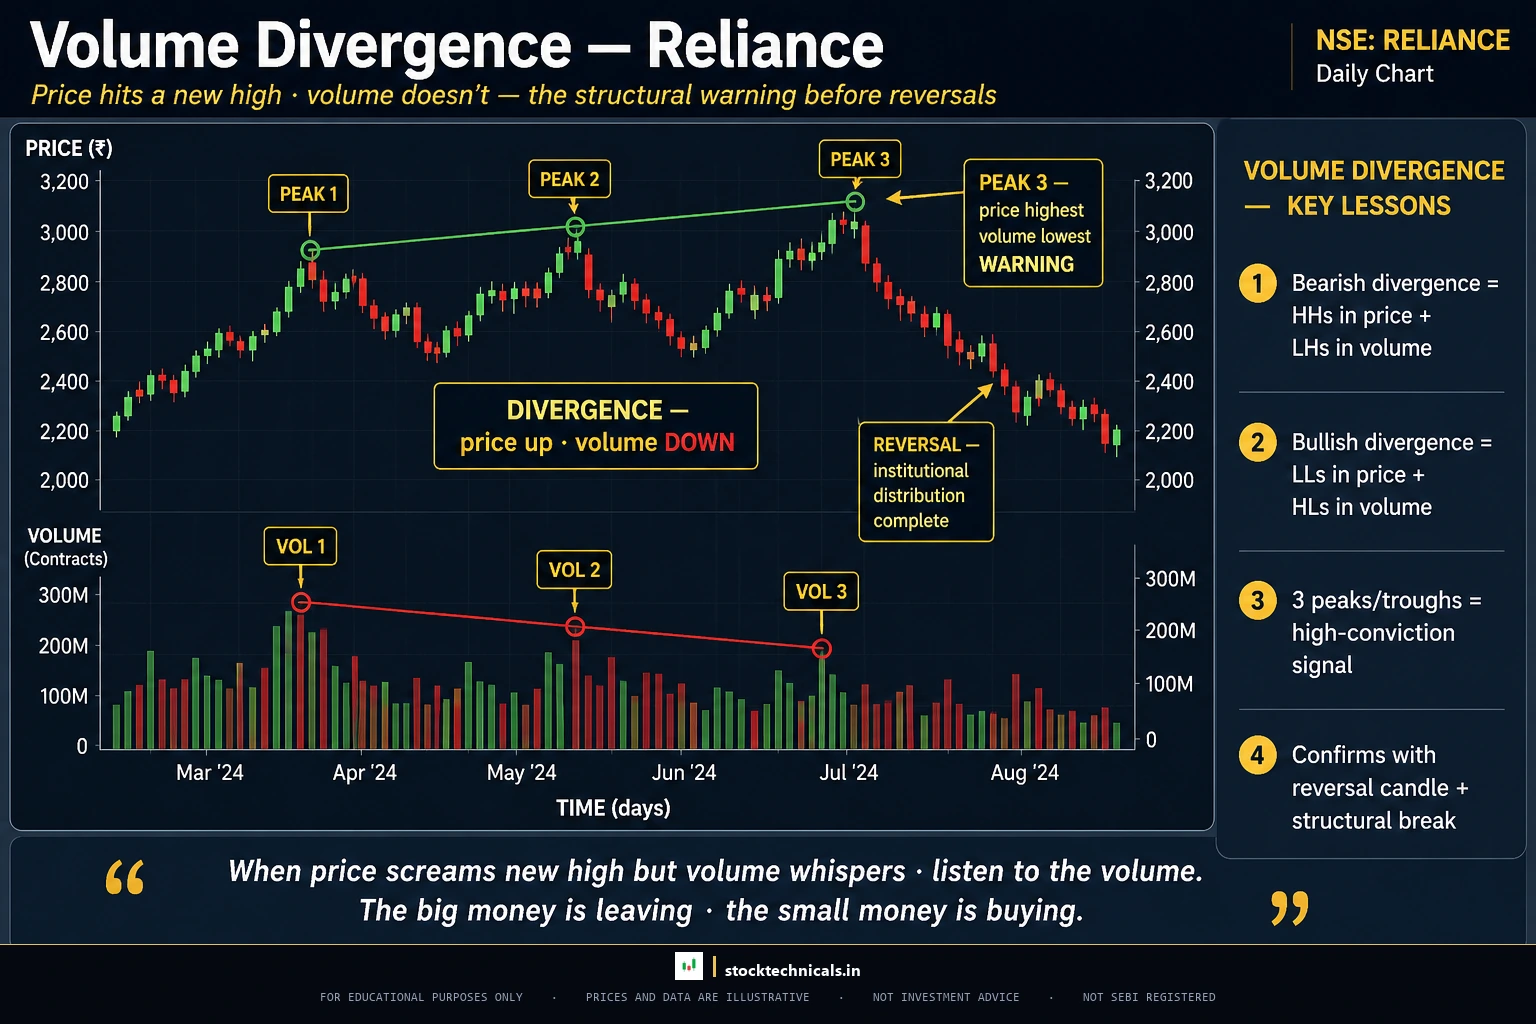
VOLUME DIVERGENCE occurs when price makes a new high (or new low) but volume fails to confirm. This is one of the most reliable warning signals in technical analysis.
Bearish Volume Divergence
Price makes a higher high, but volume on that push is lower than the volume on the previous high. This means fewer participants are willing to buy at the new price level. The rally is losing steam.
Bullish Volume Divergence
Price makes a lower low, but volume on that drop is lower than the volume on the previous low. This means selling pressure is drying up. Fewer holders are willing to dump shares at these levels.
Bullish volume divergence near support zones is a strong setup for reversal trades. Combined with bullish candlestick patterns like a hammer or morning star, it becomes a high-probability entry signal.
Volume on Breakouts — Separating Real from Fake
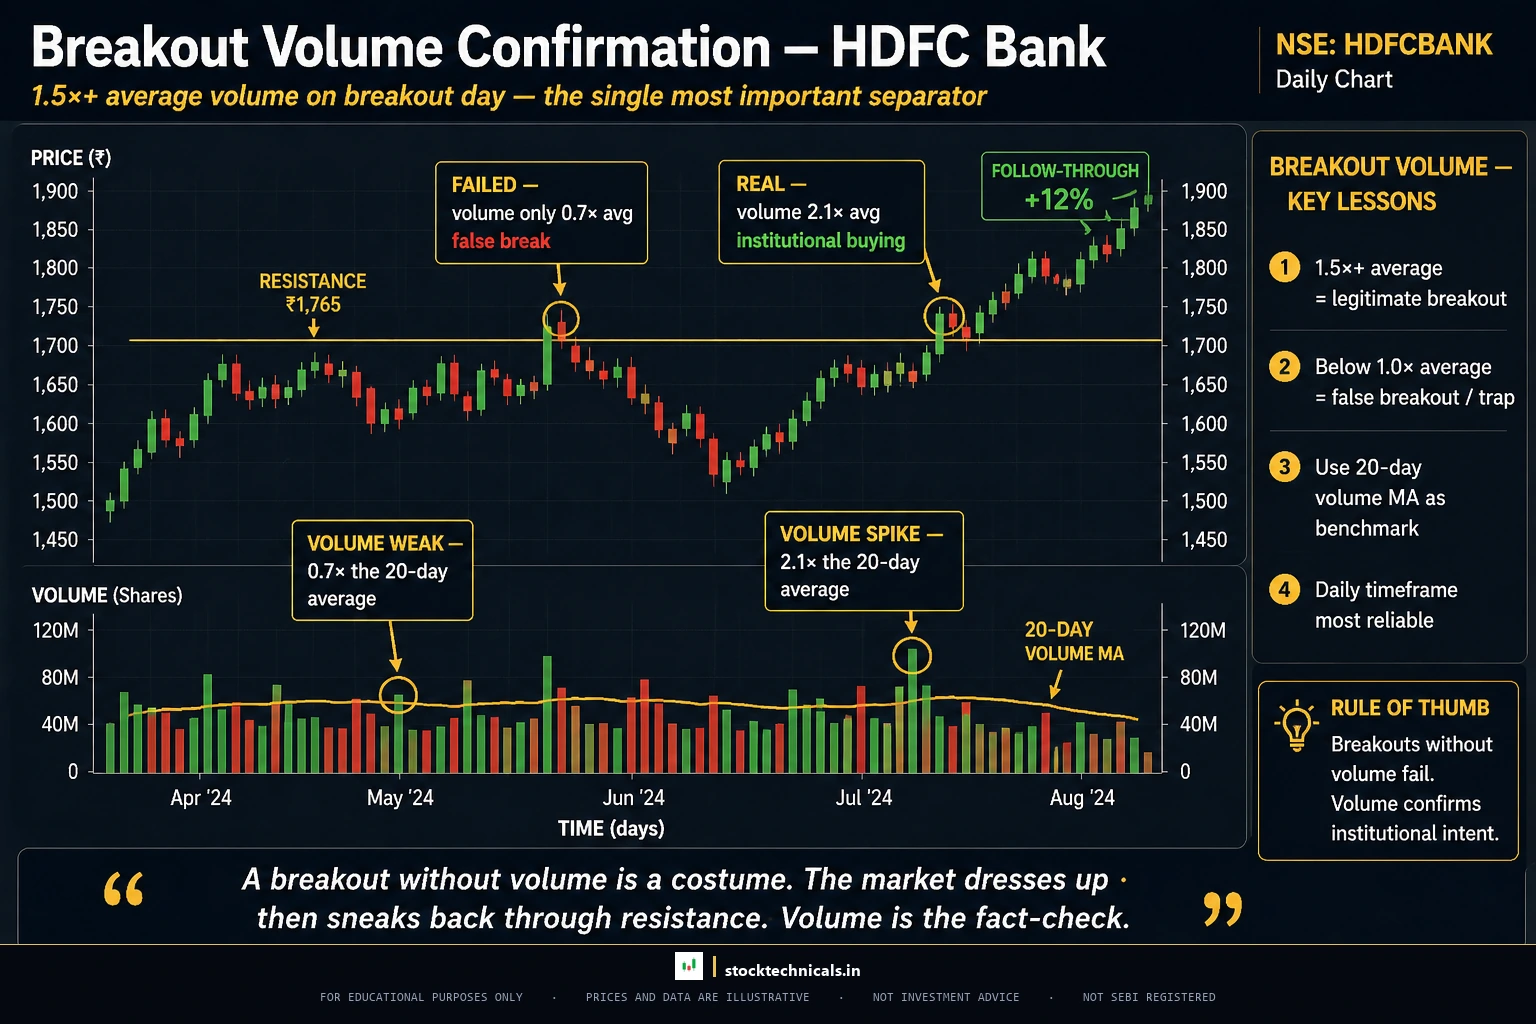
This is where volume analysis earns its keep. A stock breaking above resistance or below support generates a signal. But the quality of that signal depends almost entirely on the volume accompanying it.
The Volume Confirmation Rule
A legitimate breakout should have volume at least 1.5x the 20-day average on the breakout candle itself. The ideal breakout shows 2-3x average volume. Anything less deserves scepticism.
On August 13, 2019, Reliance Industries broke above a multi-month consolidation zone, closing at ₹629 — a 9.7% move on volume of 9.71 crore shares (4.2x the 20-day average). This was a textbook volume-confirmed breakout. The stock went on a multi-year run from that level.
Compare this to breakouts on low volume — those often result in false breakouts where price pokes above resistance, triggers buy orders, and then reverses back below, trapping breakout buyers.
What Good Breakout Volume Looks Like
- Day 1 (breakout): Volume at least 1.5x average — this is non-negotiable
- Day 2-3 after breakout: Volume should remain above average (not necessarily as high as Day 1)
- Retest on low volume: If price pulls back to the breakout level on declining volume, this is bullish — sellers are not aggressive enough to push price back
- Worst scenario: High-volume breakout followed immediately by high-volume selling back below the level. That is a failed breakout and a trap.
Delivery Volume vs Traded Volume
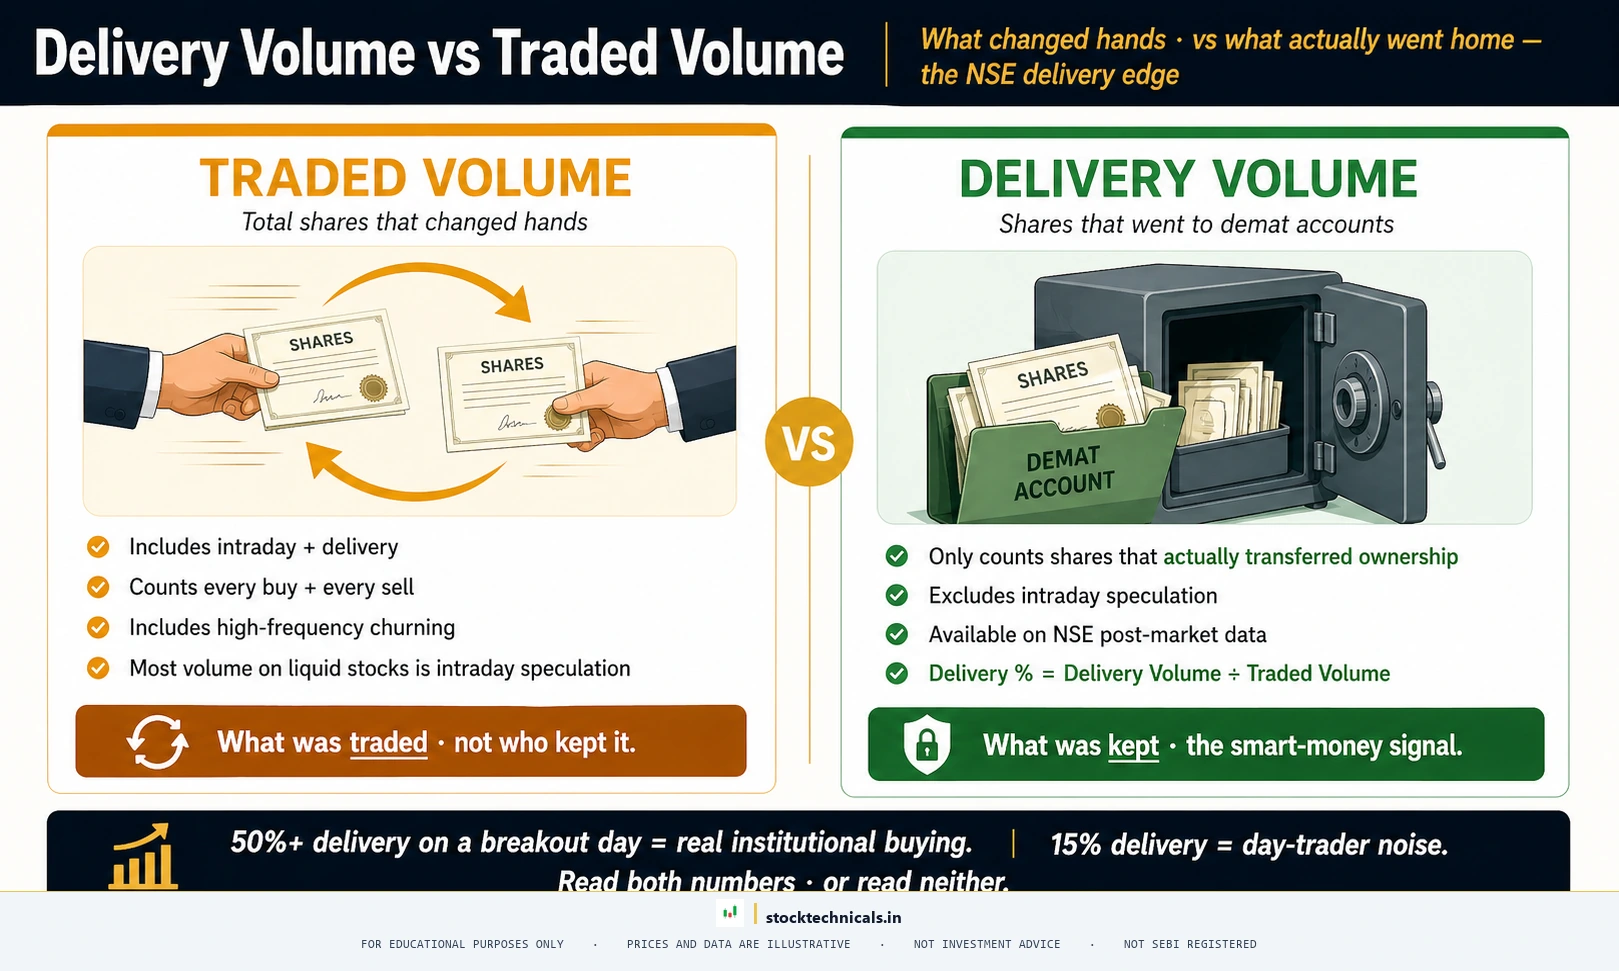
This section covers a concept unique to Indian markets. NSE provides data that most global exchanges do not: the DELIVERY PERCENTAGE — the proportion of total traded volume that actually resulted in shares changing hands (delivered to demat accounts) versus shares that were bought and sold on the same day (intraday).
What Is Delivery Volume
TRADED VOLUME is the total number of shares that changed hands. This includes both intraday traders (who buy and sell within the same session) and delivery-based investors (who hold beyond the session).
DELIVERY VOLUME is the subset of traded volume where shares were actually delivered to the buyer’s demat account. If 1 crore shares of ITC traded in a day and 45 lakh were delivered, the delivery percentage is 45%.
How to Use Delivery Data
- Breakout + high delivery percentage = strong conviction. Real money is betting on the move lasting.
- Breakout + low delivery percentage = scepticism warranted. The volume might evaporate at the close.
- Sell-off + high delivery percentage = genuine distribution. Institutions or large investors are dumping shares.
- Sell-off + low delivery percentage = intraday panic. The sell-off might not sustain into the next session.
NSE publishes delivery data daily. Brokers like Zerodha also show delivery percentage in their market depth and trade history sections.
Volume Indicators Every Trader Should Know
Raw volume bars are powerful, but several indicators transform raw volume data into more actionable signals. Here are the most important ones.
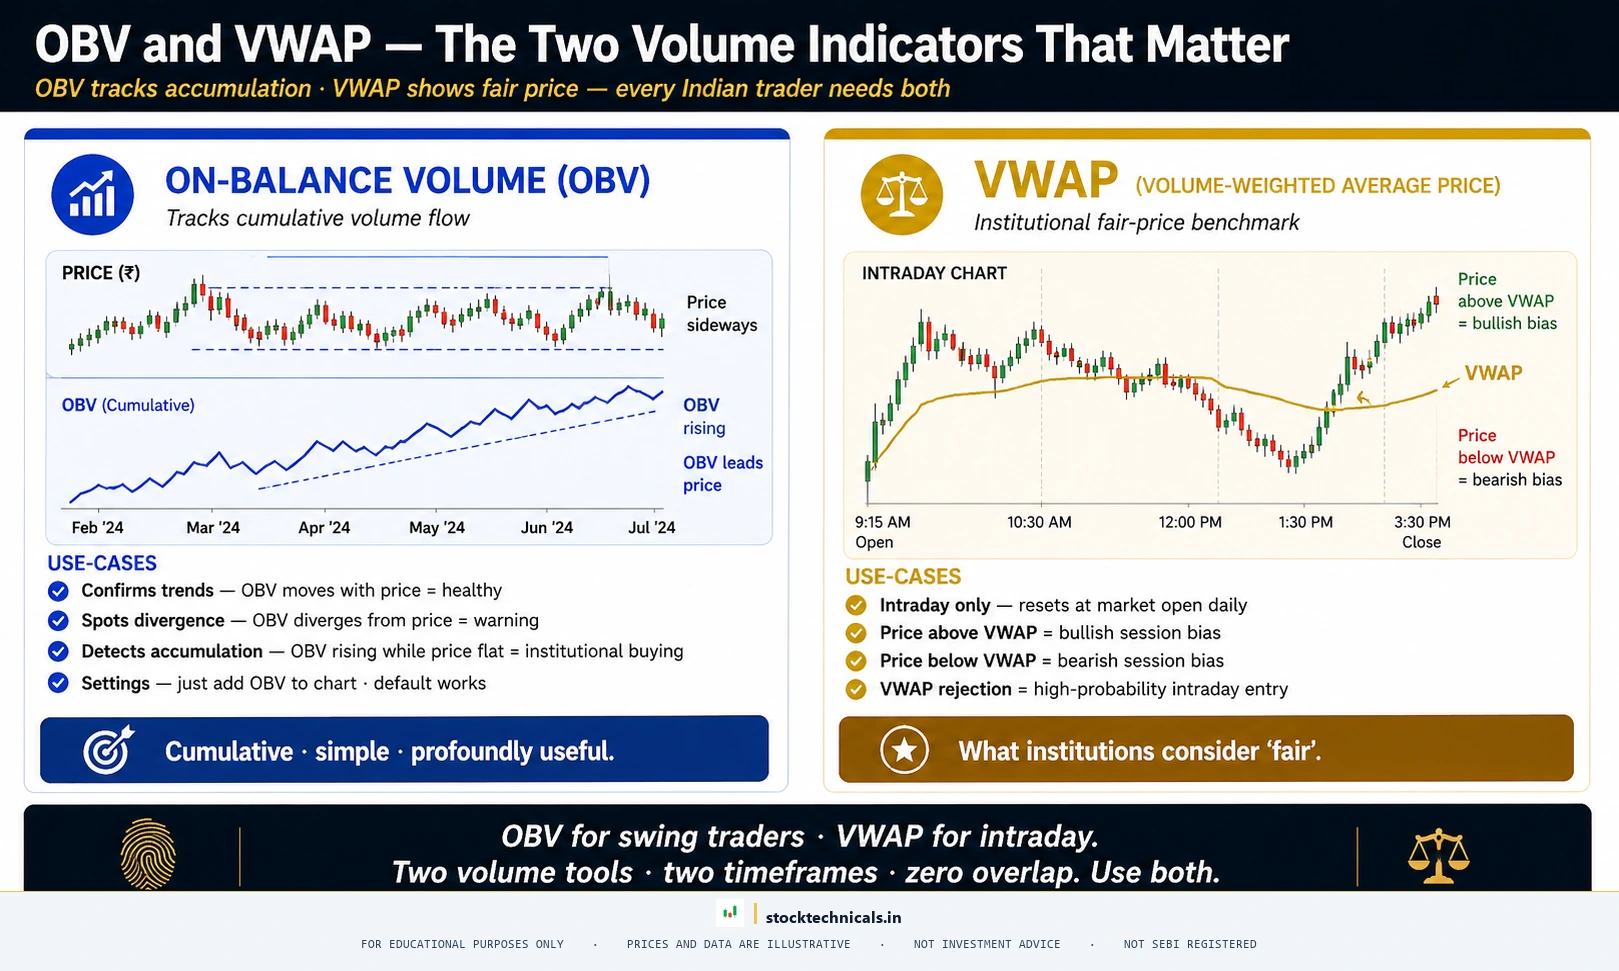
OBV — On-Balance Volume
ON-BALANCE VOLUME (OBV) is a cumulative indicator created by Joseph Granville. The calculation is simple: if today’s close is higher than yesterday’s close, add today’s volume to the running OBV total. If lower, subtract it.
The absolute number does not matter. What matters is the direction of OBV relative to price. OBV confirms the trend when both price and OBV make higher highs. OBV divergence warns of reversal when price makes a new high but OBV makes a lower high.
OBV is especially useful for spotting hidden accumulation: periods where smart money buys shares without pushing the price up significantly. In such cases, OBV trends higher while the stock chart looks flat — a classic early warning that a breakout is building beneath the surface. The opposite — OBV falling while price holds up — signals distribution, where large holders are quietly exiting.
VWAP — Volume Weighted Average Price
VWAP (Volume Weighted Average Price) is the average price of a stock weighted by volume throughout the trading day. It resets at 9:15 AM on NSE and builds throughout the day.
VWAP tells traders the fair price of the stock for that session. Institutional traders use VWAP as a benchmark — a fund manager buying 10 lakh shares wants to execute at or below VWAP. This institutional behaviour creates natural support and resistance at the VWAP level.
For a complete breakdown of VWAP strategies, see the VWAP guide.
Volume Across Different Timeframes
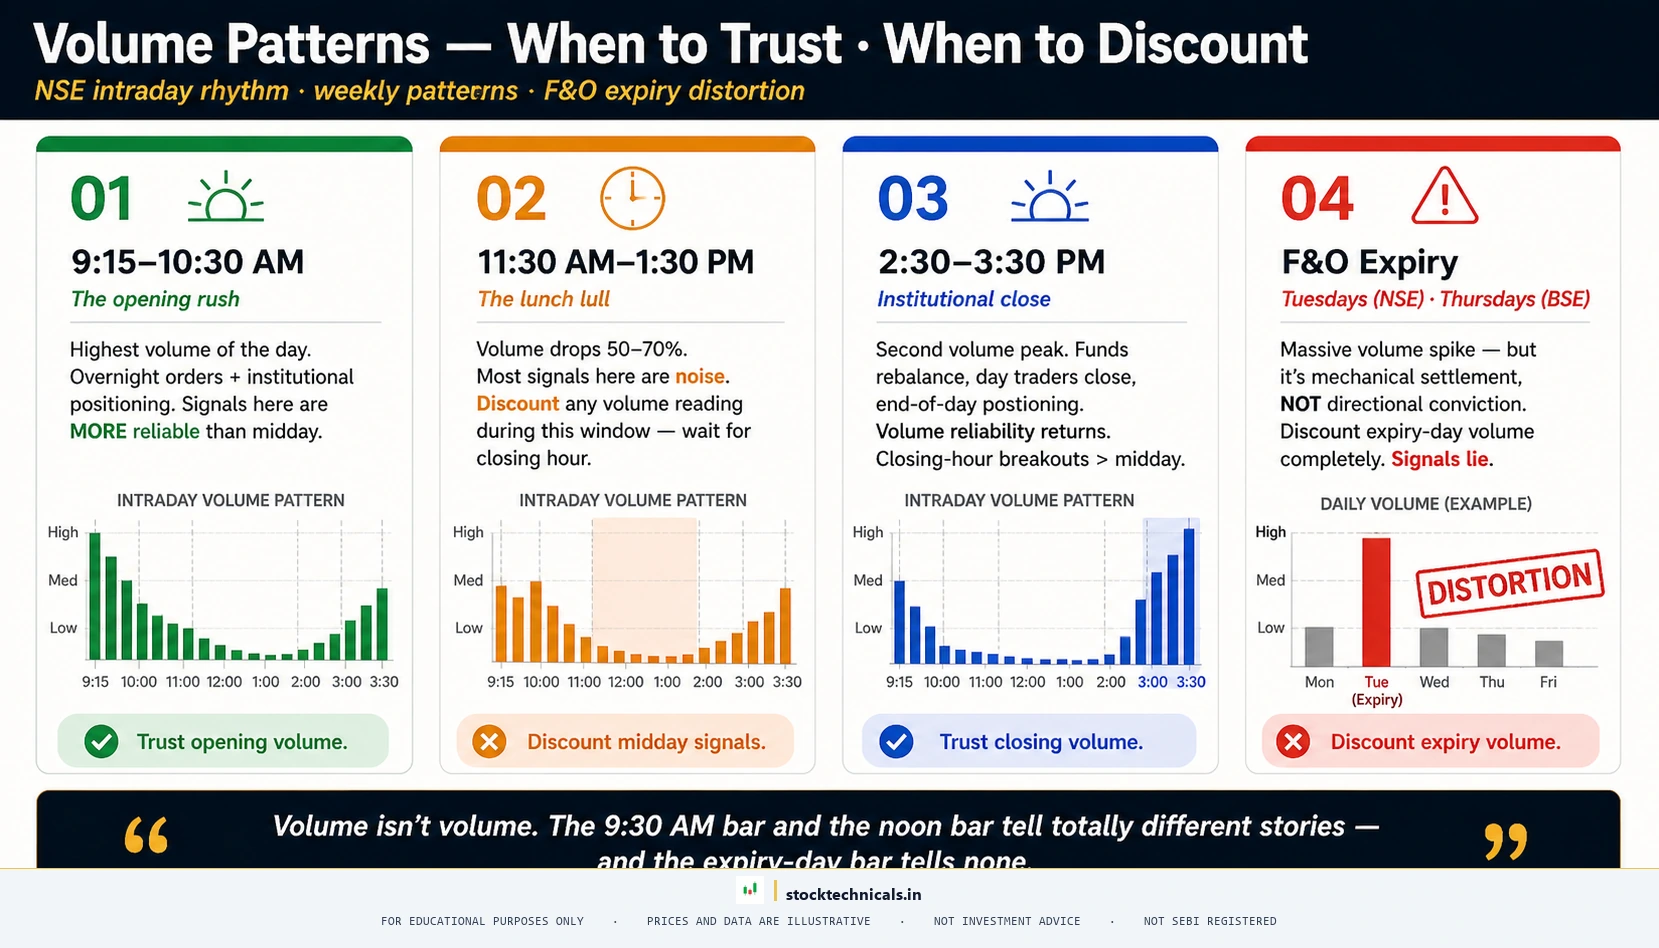
Volume behaves differently across timeframes. Understanding this prevents false signals.
Intraday Volume Patterns on NSE
- 9:15-10:00 AM — Highest volume of the day. Opening session absorbs overnight news, global cues, and institutional program trades.
- 10:00 AM-1:00 PM — Volume gradually declines. Mid-morning is typically the quietest period.
- 1:00-2:30 PM — Volume picks up slightly. Post-lunch positioning begins.
- 2:30-3:30 PM — Volume surges again. Intraday position squaring, institutional block trades, F&O expiry positioning (NSE Tuesday, BSE Thursday since Sept 2025).
For intraday traders, a breakout signal at 9:30 AM has different significance from the same signal at 12:30 PM simply because of the natural volume distribution. Morning breakouts on high volume are more reliable because the high participation provides genuine price discovery.
Volume on F&O Expiry Days — Handle with Caution
Weekly F&O expiry days on Indian exchanges spike volume in index constituent stocks dramatically. The volume is not driven by directional conviction — it comes from options settlement, rollover activity, and short covering. Traders should flag expiry dates and discount volume signals that occur on them.
Per the SEBI circular effective September 1, 2025, the expiry schedule has changed:
- NSE (Nifty 50, Bank Nifty, FinNifty): Weekly expiry now on Tuesday (previously Thursday for over 25 years)
- BSE (Sensex, Bankex): Weekly expiry now on Thursday
- Monthly expiry: Last Tuesday of the month for NSE contracts, last Thursday for BSE contracts
Traders should flag expiry dates in their calendar and discount volume signals that occur on those days. The NSE website publishes the expiry calendar well in advance.
Common Volume Mistakes That Cost Money
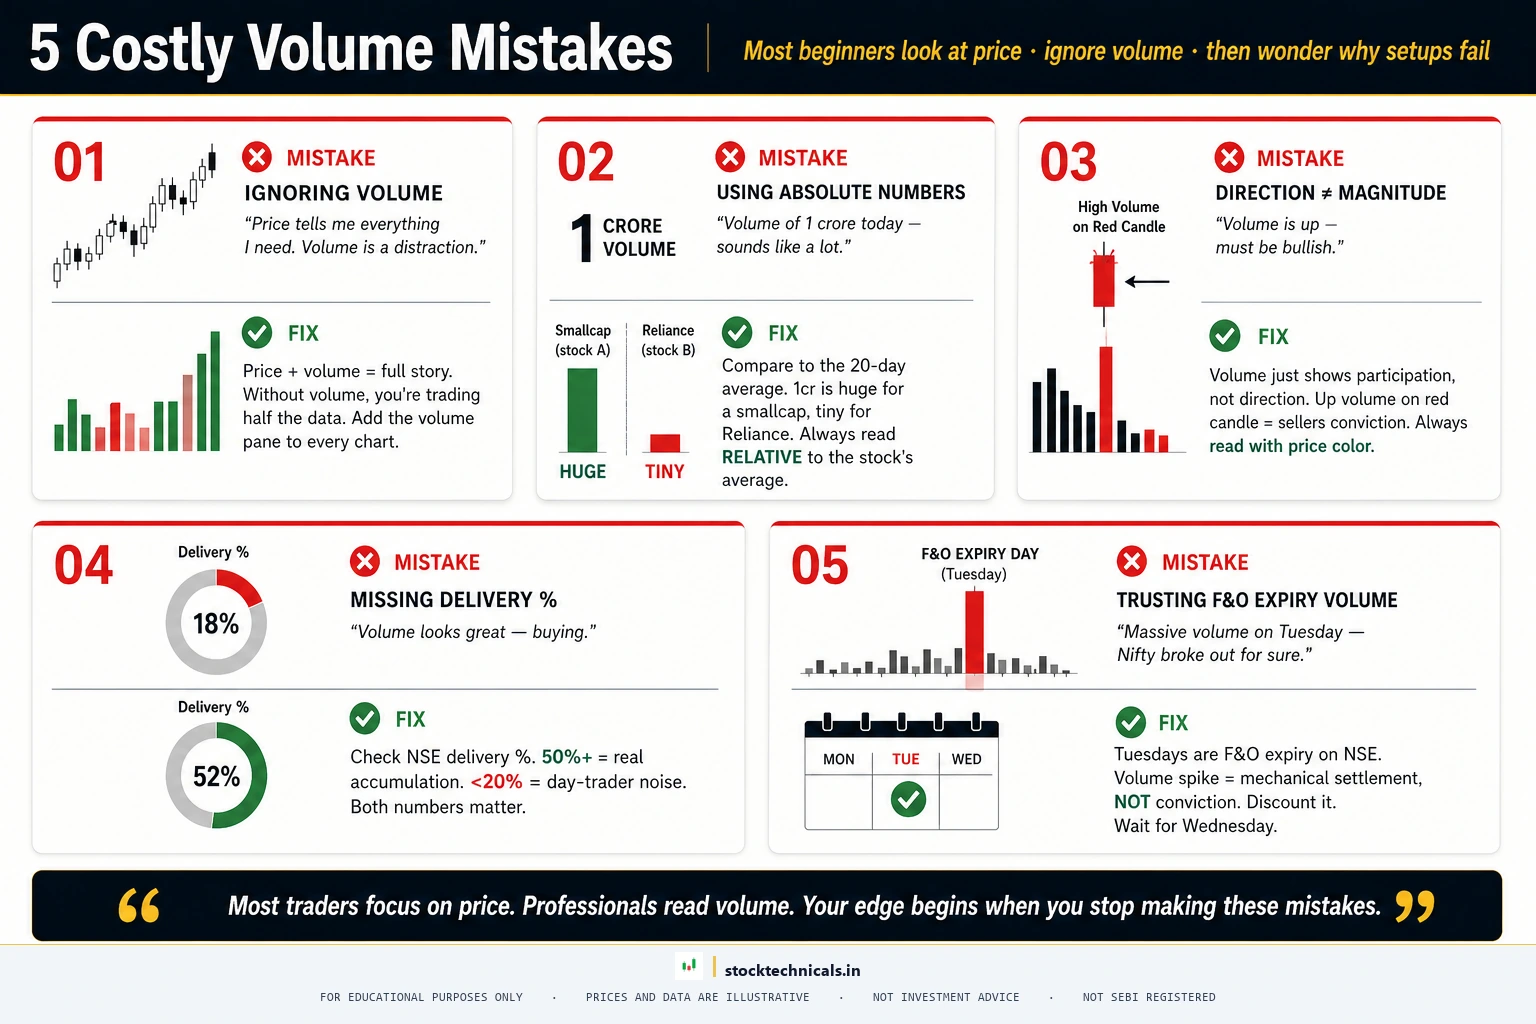
- Ignoring volume entirely — The most common mistake. Many beginners focus exclusively on price patterns without checking conviction.
- Looking at absolute numbers — Volume must always be compared to the 20-day average. 50 lakh shares sounds impressive until the average is 80 lakh.
- Confusing high volume with good volume — A stock crashing 10% on 5x volume is bearish high volume. Direction matters.
- Ignoring delivery percentage — A 3x volume day with 15% delivery is speculative noise, not institutional conviction.
- Expecting instant reactions — Volume divergence unfolds over days or weeks, not the same session.
- Not filtering expiry days — F&O expiry volume spikes are mechanical, not directional.
When Volume Analysis Does Not Work
Volume is powerful but not universal. Five scenarios deserve caution before applying any of the rules above:
- Spot indices (Nifty 50, Bank Nifty, Sensex): Indices themselves have no native volume — only their futures contracts and constituent stocks do. If a platform shows zero volume on a spot-index chart, that is not an error. Use Nifty futures or the sum of constituent volumes to read participation on the benchmark.
- ETFs and mutual-fund-like instruments: ETFs often show low native volume even when underlying flow is heavy. AMC creation and redemption happens off-screen through the issuer. Focus on the underlying basket volume instead.
- Thinly traded small-caps and illiquid stocks: When the 20-day average itself is artificially low (single-digit lakh shares), one unusual order can make volume jump 5-10x without meaning anything. Delivery percentage and bid-ask depth matter more than volume ratio in illiquid names.
- Circuit filter days: When a stock hits upper or lower circuit on NSE, trading halts or locks and the traded volume no longer reflects genuine price discovery. Discount any volume signal on a locked-circuit day — the buyers or sellers were trapped, not informed.
- Block deal or bulk deal sessions: A single institutional cross-trade can inflate daily volume by 20-50% without reflecting broader participation. Check the NSE bulk/block deal tape before reading an anomalous volume spike as bullish or bearish.
In every case the rule is the same: when the structure of the instrument makes volume unreliable, use delivery percentage, bid-ask depth, or open interest (for F&O) instead.
Volume and Price Action Together
The strongest trade setups combine volume analysis with price action signals. Three high-probability combinations:
- Breakout + Volume Spike + Strong Close: A stock breaking above resistance on 2x+ average volume with a candle that closes in its upper 25% range is one of the most reliable long entries in technical analysis.
- Support Test + High Volume + Hammer Candle: A stock dropping to support on high volume but forming a hammer candlestick signals that buyers aggressively absorbed selling pressure.
- Trendline Break + Volume Expansion + Retest: A stock breaking below a rising trendline on expanding volume, followed by a retest on declining volume, is a textbook shorting setup.
Interactive Tool: Volume Signal Analyzer
Instead of reading a checklist, pressure-test an actual volume signal. Enter today’s volume ratio, price direction, delivery percentage, close quality, and event context — the analyzer returns an A/B/C/F grade with specific action recommendations and a breakdown of what is working and what is not.
Volume Signal
Analyzer
Grade today’s volume signal across 5 factors and see if it deserves a trade
Pressure-Test Today’s Volume Signal
Five factors separate tradeable volume from meaningless noise. Answer each, get a grade from A to F, and see exactly what to do next.
Volume Quality Cheat Sheet
Reference table for every scoring factor the analyzer uses. Keep this open while looking at any NSE chart.
| Factor | Weak | Acceptable | Strong | Why it matters |
|---|---|---|---|---|
| Volume ratio | Under 1x | 1x to 1.5x | 1.5x to 3x+ | Below 1.5x means fewer participants than normal — conviction is missing |
| Price direction | Flat or mid-range | Directional inside range | Range breakout / breakdown | Big volume without a big move suggests distribution or absorption |
| Delivery % | Under 20% | 20 to 40% | 40%+ | High delivery means shares moved to real holders, not intraday noise |
| Close quality | Lower 25% of day range | Middle of range | Upper 25% | A strong close confirms buyers controlled the final hour of trade |
| Event context | F&O expiry | Index rebalance | Normal or genuine news | Expiry volume is mechanical, not directional — discount it |
Volume Signal Quiz
Five questions built from real NSE scenarios. Click an answer to see why it is right or wrong.
Building a Volume Analysis Routine
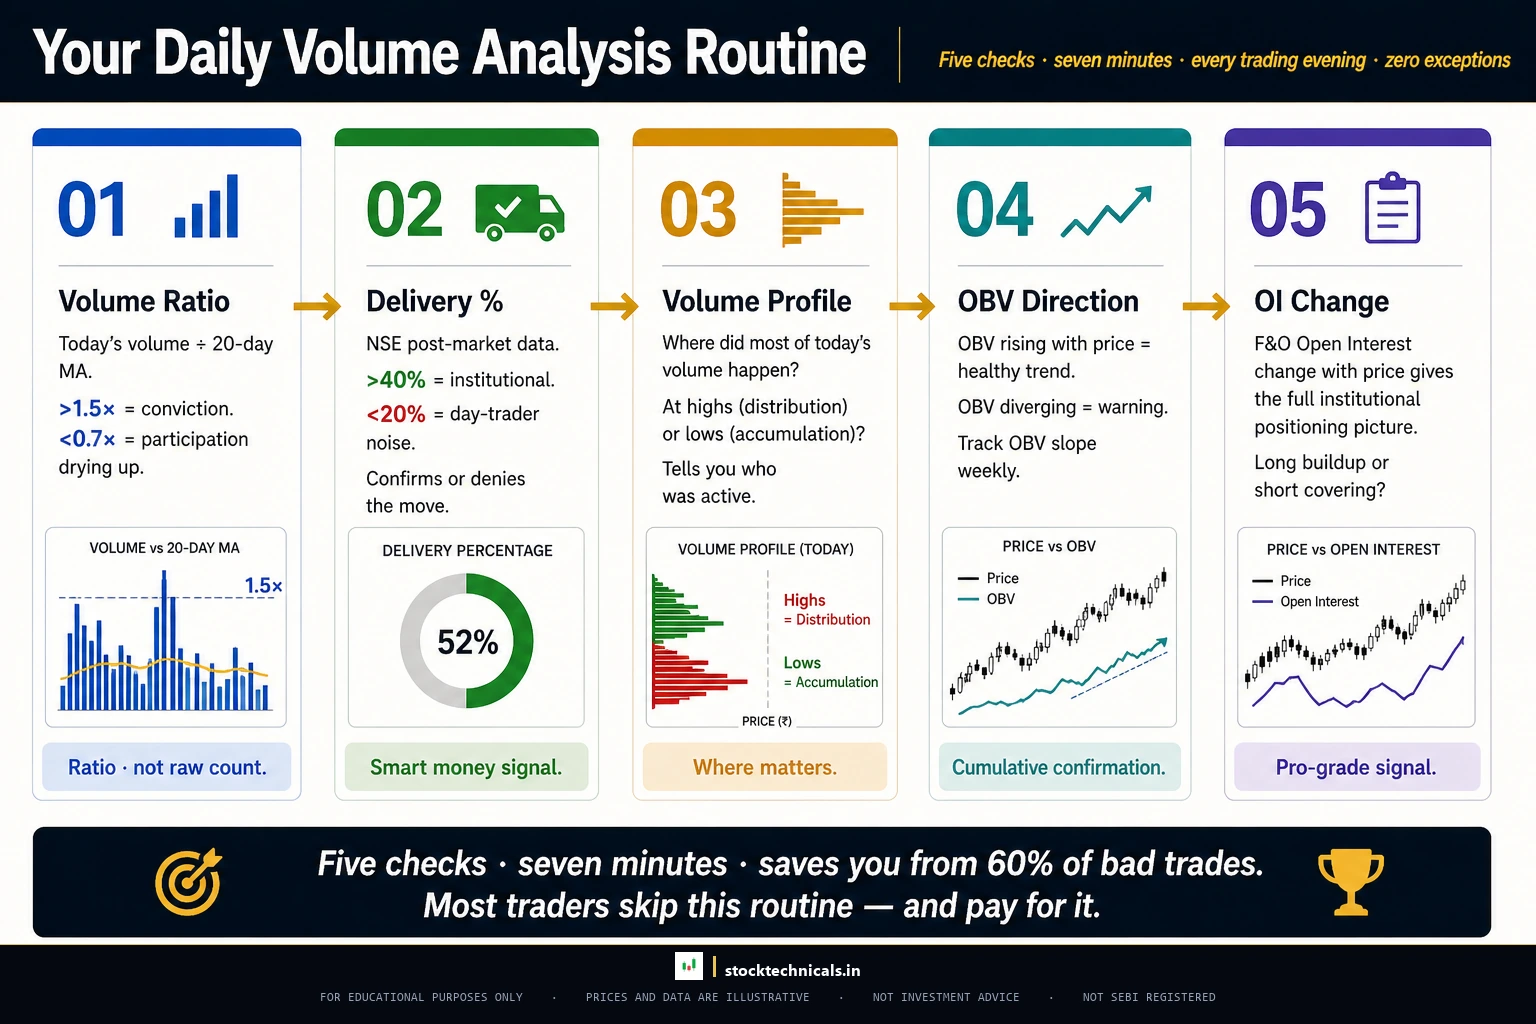
Effective volume analysis requires a consistent daily process. Before 9:15 AM, check previous day’s volume leaders. During the session, verify 1.5x thresholds before entries and watch VWAP. After 3:30 PM, review delivery percentage data and update OBV analysis on key positions.
The uncomfortable truth: Volume analysis will not make losing trades profitable. No indicator does that. What volume analysis does is help traders avoid the worst trades — the low-volume breakouts that trap buyers, the divergence signals that precede major reversals. In a market where 93% of intraday traders lose money (SEBI data), avoiding bad trades is more valuable than finding good ones.
Real Talk: No chart pattern, indicator, or strategy works 100% of the time. The SEBI study showing 93% of F&O traders lose money is not a scare tactic — it is a filter. Most of that 93% traded without a stop-loss, sized positions too large, or chased signals without understanding context. Risk no more than 1-2% of capital per trade. Keep a trading journal. The market rewards patience and discipline — not speed or boldness.
Quick Quiz: Test Your Volume Knowledge
Five questions to pressure-test what you just learned.
1. You are tracking a stock with a 20-day average volume of 40 lakh shares. Today it traded 55 lakh shares. Is this considered a meaningful volume event?
2. Price makes a new 52-week high but volume is lower than the previous high. What is this called?
3. A stock shows 3x average traded volume but delivery percentage is only 12%. What should a trader conclude?
4. Which tool gives a trader a per-session fair-price benchmark that institutions actively reference for execution quality?
5. During a healthy uptrend, volume should ideally be higher on which type of days?
I traded volume confirmation for two years before I trusted it more than price action alone. The day I watched Reliance reverse on a single below-average breakout candle, the rule clicked.
What is a good volume for trading stocks?
There is no universal number. Volume is relative to each stock’s own average. A stock trading 2x or more its 20-day average volume shows significant activity. For liquid large-cap NSE stocks, daily volumes in the crore range are typical — but what matters is the ratio to the 20-day average, not the absolute number.
Can volume predict stock price movement?
Volume alone does not predict direction, but it confirms the quality of a price move. Rising prices on rising volume are more sustainable than rising prices on falling volume. Volume divergence warns of potential reversals days or weeks before they happen.
What is the difference between traded volume and delivery volume?
Traded volume includes all transactions — both intraday (squared off same day) and delivery (held overnight or longer). Delivery volume is the subset that actually transferred to buyer demat accounts. High delivery percentage suggests institutional or investment-grade buying rather than speculation.
Why does volume increase during market opening and closing?
The opening session (9:15-10:00 AM on NSE) absorbs overnight news and global cues. Institutions execute large program trades at the open. The closing session (2:30-3:30 PM) sees intraday position squaring, institutional block trades, and index rebalancing activity.
What does it mean when a stock goes up on low volume?
A price increase on below-average volume suggests weak buying conviction. The rally may not sustain because fewer participants are supporting the higher price. This is a cautionary signal, especially near resistance levels — the classic setup for a failed rally.
Is high volume good or bad for a stock?
It depends on context. High volume on a price increase confirms bullish strength. High volume on a price decrease confirms bearish pressure. High volume itself is neutral — the direction of the accompanying price move determines whether it is positive or negative.
How do institutional traders use volume?
Institutions use VWAP (Volume Weighted Average Price) as a benchmark for execution quality. They aim to buy below VWAP and sell above VWAP. They also watch delivery percentage to gauge whether moves have genuine investment backing versus speculative activity.
What is OBV and how does it help?
On-Balance Volume (OBV) is a cumulative indicator that adds today’s volume on up days and subtracts it on down days. It reveals hidden accumulation (OBV rising while price is flat) and distribution (OBV falling while price holds up), providing early signals of trend changes that price action alone might miss.
Should beginners focus on volume or indicators first?
Volume should come before complex indicators. Volume is raw market data — the number of shares traded. Indicators like RSI and MACD are derived calculations that can lag. Learning to read volume gives traders a direct connection to market activity.
Where can volume data be accessed for free?
TradingView shows real-time volume on any chart. NSE India publishes daily volume and delivery data in the bhavcopy. Broker platforms like Zerodha Kite, Angel One, Groww, and Dhan all display volume data by default on their charts.
Start Reading Volume on Monday Morning
Volume analysis is not a separate skill — it is a filter that sits on top of every trade setup. Every time a trader looks at a candlestick pattern, a breakout, a trendline touch, or a support test, the first question should be: what is volume saying about this move?
Start with these three habits this week:
- Add a 20-period volume moving average to every chart in TradingView. Make the benchmark visible on every screen.
- Before entering any trade, verify volume is at least 1.5x the 20-day average on the signal candle.
- Check delivery percentage on the NSE bhavcopy for every swing position before the next day’s open.
Do these three things consistently for one month and volume will become as automatic as reading price. That is when it starts filtering out the low-quality trades that drain accounts.
The Bottom Line on Volume
Volume is the conviction signal behind every price move, and ignoring it is the fastest way to get trapped in false breakouts and distribution rallies. Every candlestick on a chart has a volume bar beneath it that answers one question: did real buyers and sellers agree with this move, or was it thin-air drift? Rising price on rising volume confirms a genuine advance; rising price on fading volume warns that the move is running on fumes. The rule is the same on a Nifty 50 breakout, a Reliance pullback entry, or a Bank Nifty reversal candle — no volume, no trust.
The next step is making volume a required check before every trade. Open Zerodha Kite, Dhan, or Angel One, add the 20-day volume moving average to the pane, and cross-check the delivery percentage in the NSE daily bhavcopy before any swing entry. Full-size trades only when volume is 1.5 to 3 times the 20-day average with a strong close and healthy delivery. Below that threshold, it is either noise or a trap — skip the trade and wait for the next signal that the market actually backs with capital.
Volume is the loudest vote cast in the market. Price tells you where; volume tells you whether the conviction is real. Per the SEBI FY24-25 study, 91 percent of individual equity F&O traders lost money — trading without volume confirmation is trading blind.
Continue Learning
Build on volume analysis with the complete beginner learning path: What is Technical Analysis · How to Read Stock Charts · Types of Stock Charts · Technical Analysis vs Fundamental Analysis · Timeframes in Trading · What is a Trend? · Trendlines · Candlestick Charts · Bullish Candlestick Patterns · Bearish Candlestick Patterns · Doji Candles · Candlestick Anatomy · VWAP Explained · EMA Basics · RSI Basics · Dow Theory
Keep learning. Stay disciplined. Trade what the chart shows, not what the gut feels.
— OrsLeo