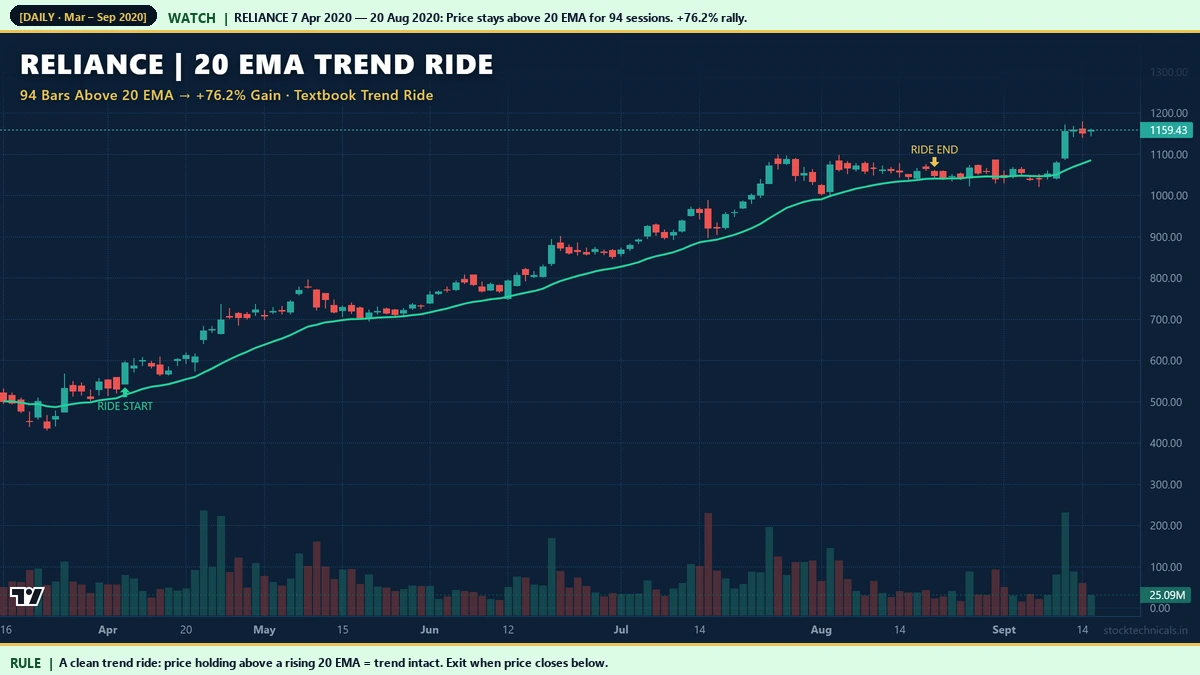
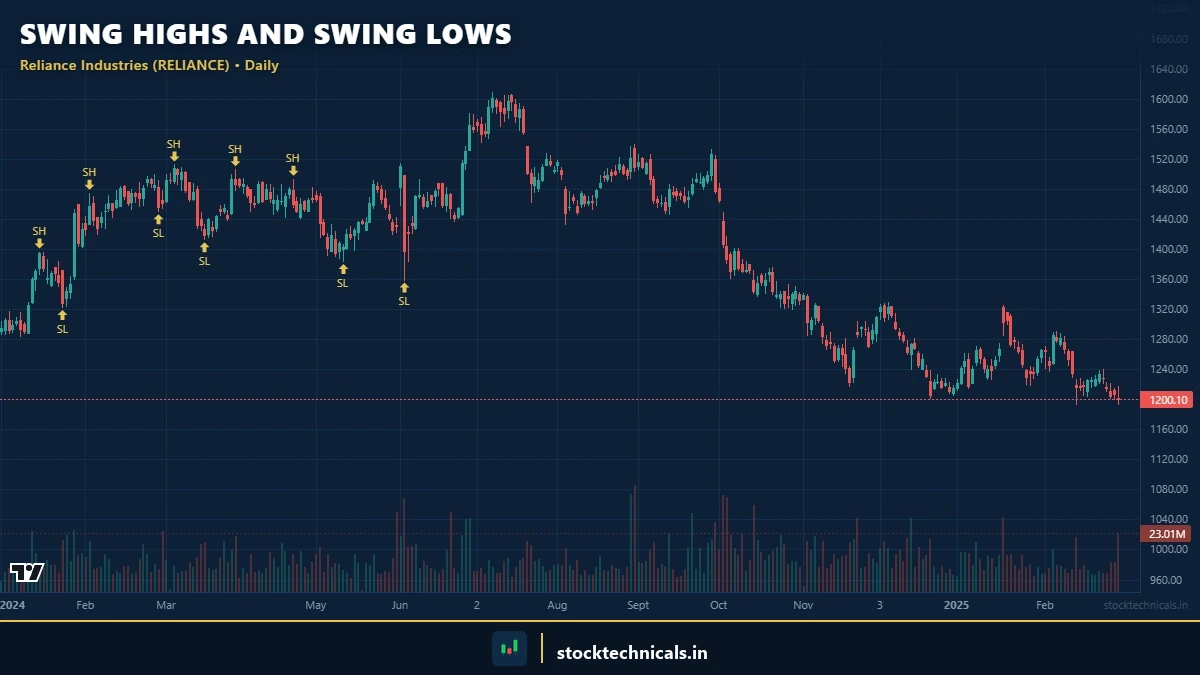
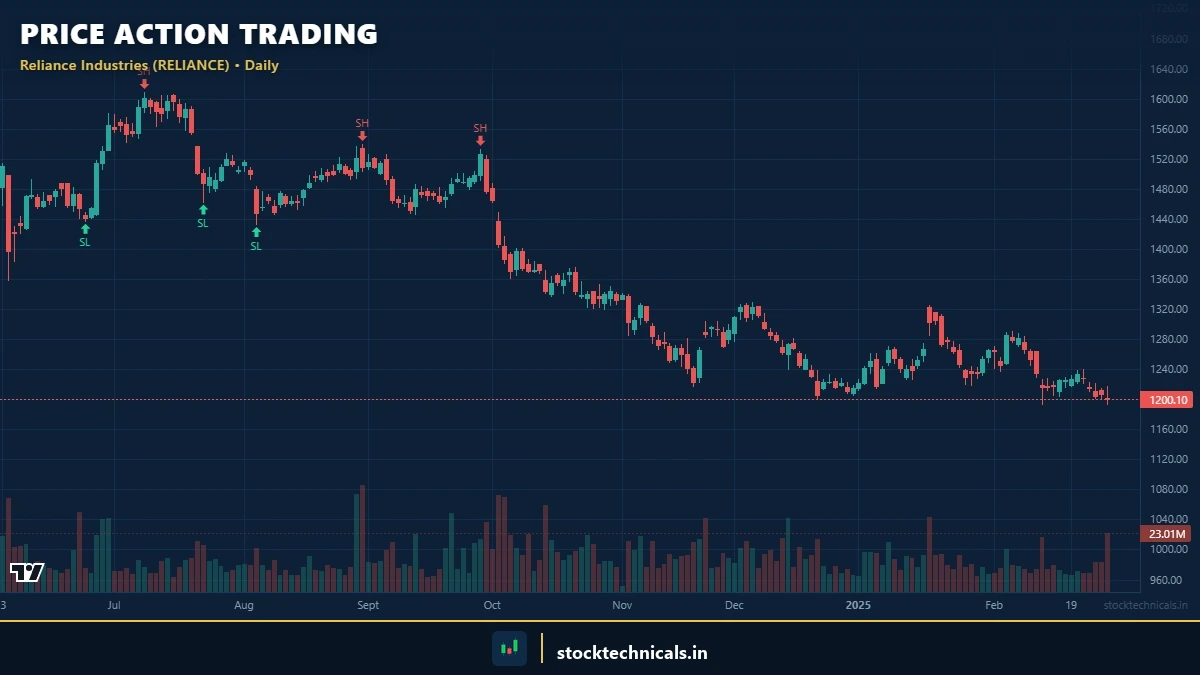
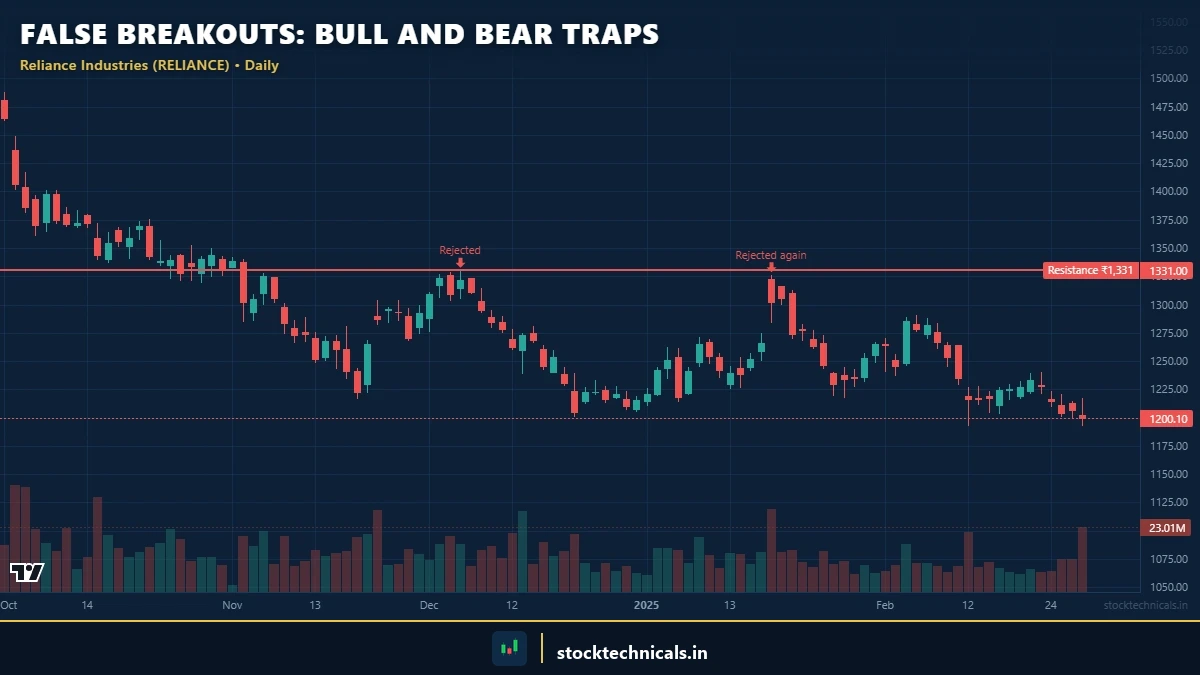
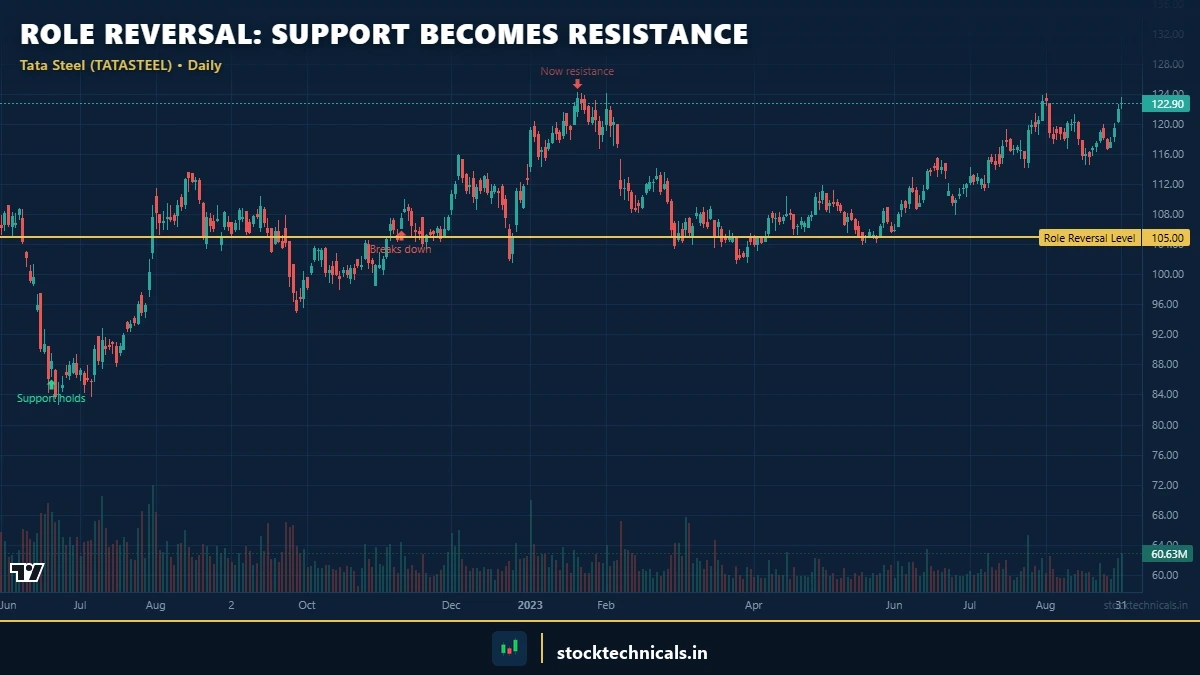
Head and Shoulders Pattern: 7 Verified NSE Examples with Trade Plans

Adani Ports 2022 2023 head and shoulders top pattern 35 percent decline after neckline break

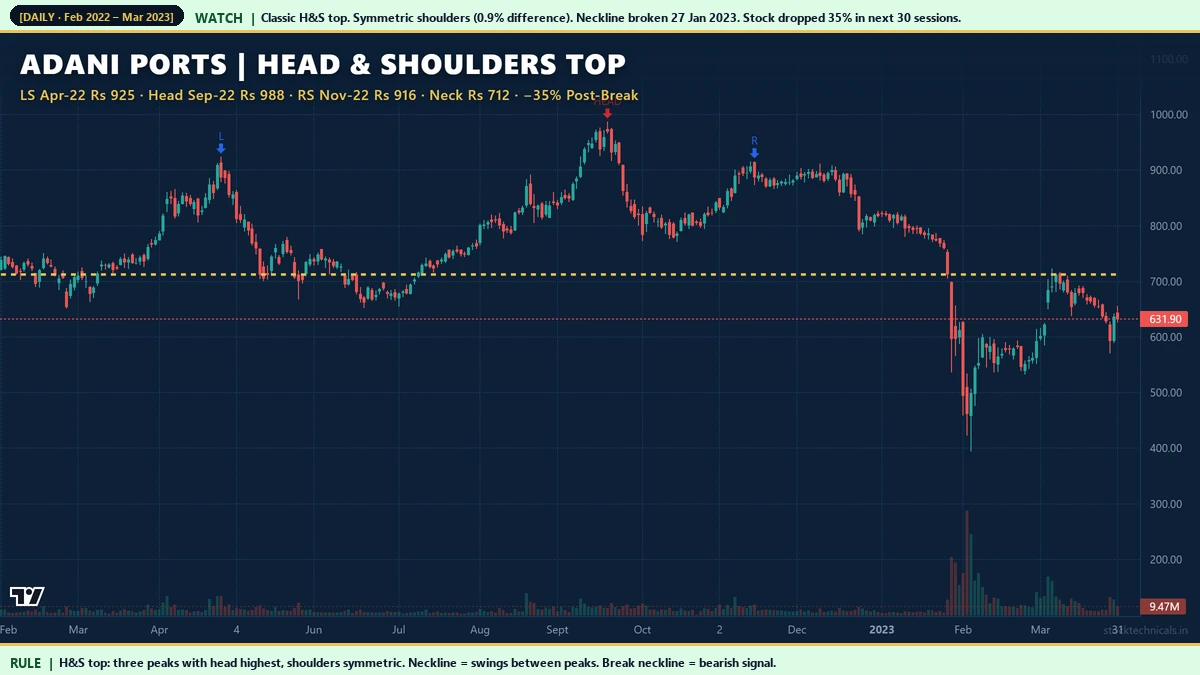
The Head and Shoulders pattern is the most widely recognised reversal pattern in technical analysis. Three price peaks, with a higher peak in the middle and two lower peaks on either side, connected by a neckline drawn through the intervening swing lows. When price breaks below the neckline on volume, the pattern is considered confirmed … Read more

Swing Highs and Swing Lows: Building Market Structure

Featured - StockTechnicals.in

Every candlestick chart tells a story. But without knowing how to read the rhythm of peaks and valleys, that story stays hidden. SWING HIGHS and SWING LOWS are the structural anchors that make price action readable. They define trends, signal reversals, and give traders objective reference points for entries and exits. Think of swing points … Read more

False Breakouts: How to Avoid Bull and Bear Traps

Featured - StockTechnicals.in

Quick Answer: A false breakout occurs when price breaks a key level but immediately reverses, trapping traders on the wrong side. A bull trap breaks above resistance then drops. A bear trap breaks below support then rallies. Confirm breakouts by waiting for a candle close beyond the level with strong volume. Key Takeaways A FALSE … Read more