Supply and Demand Zones

Featured - StockTechnicals.in

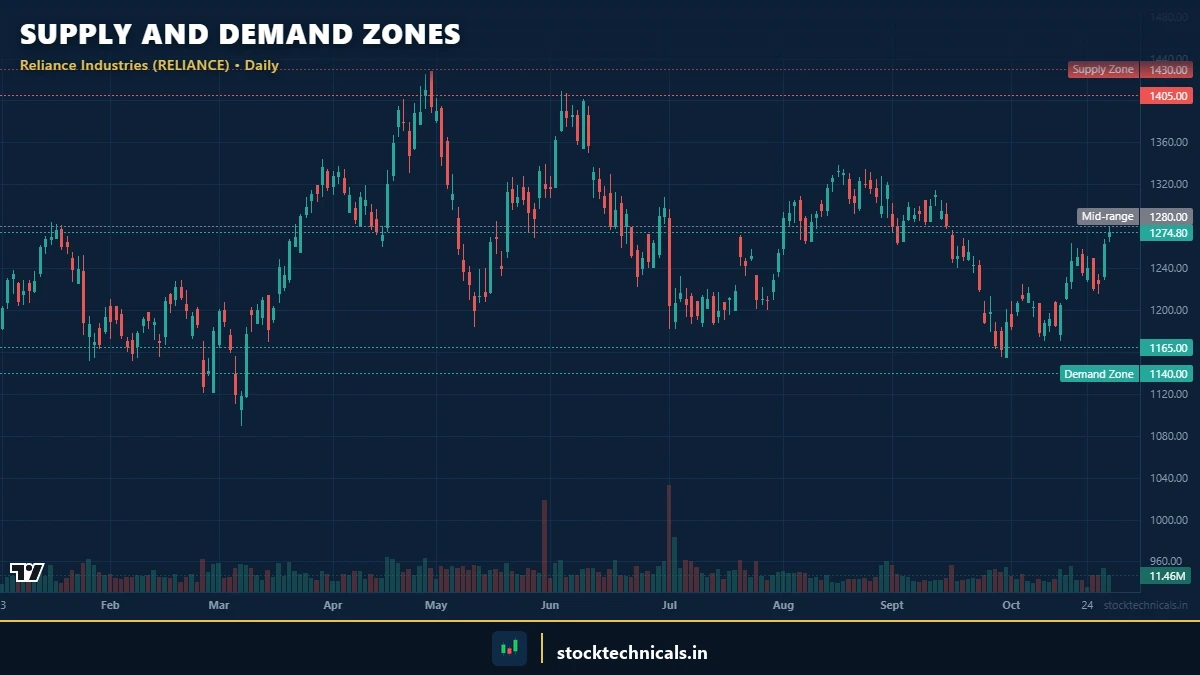
Quick Answer: Supply zones are price areas where aggressive selling previously caused a sharp drop — future rallies into these zones often reverse. Demand zones are where aggressive buying caused a sharp rally. Unlike support and resistance, supply and demand zones focus on the origin of the move, not where price bounced. Key Takeaways SUPPLY … Read more

Dynamic vs Static Support and Resistance

Most traders learn about SUPPORT AND RESISTANCE as horizontal lines on a chart. Those horizontal levels — drawn from previous swing highs and swing lows — are what professional traders call STATIC SUPPORT AND RESISTANCE. They stay fixed at one price, regardless of what happens next. Key Takeaways Static levels are horizontal; dynamic levels move … Read more

How to Draw Support and Resistance Levels

Quick Answer: Draw support and resistance by identifying clusters of swing highs and lows where price has reversed multiple times. Use zones (not exact lines) — typically 0.5-1% wide. Start with higher timeframes (weekly, daily), mark obvious levels, then refine on lower timeframes. Zones with high volume are the most significant. Key Takeaways SUPPORT AND … Read more

Support and Resistance

Published: January 28, 2026 · Last refreshed: April 27, 2026. Prices and data are compiled with reasonable care but — always confirm against your broker before trading. Historical reference charts are evergreen. Quick Answer: Support and resistance are horizontal price levels where buyers or sellers have historically stepped in with enough conviction to stall a … Read more

Three White Soldiers and Three Black Crows Explained

Most candlestick patterns are single-candle signals. A doji here, a hammer there — useful, but they represent one session of market activity. THREE WHITE SOLDIERS and THREE BLACK CROWS are different. These patterns span three full trading sessions, and that extended timeframe is exactly what makes them more reliable than almost any single-candle formation. When … Read more

Marubozu Candlestick Pattern: The Naked Candle That Signals Dominance

The Marubozu — meaning “bald” or “shaven” in Japanese — is a candlestick with NO wicks (or nearly none). It shows complete dominance by one side for the entire session. Unlike most candlestick patterns which signal REVERSALS, the Marubozu is primarily amomentum CONTINUATION pattern. When it appears in a strong uptrend, it signals buyers are … Read more

Shooting Star vs Inverted Hammer

The shooting star and inverted hammer are arguably the most fascinating candlesticks in technical analysis — they have theexact same shape but signalopposite directions based entirely on where they form. At the top of an uptrend, this candle is a shooting star (bearish reversal). At the bottom of a downtrend, the same candle becomes an … Read more

Morning Star and Evening Star Patterns with Chart Examples

The morning star and evening star are three-candle reversal patterns that rank among the most reliable in candlestick analysis. Independent pattern research ranks the These three-candle patterns tend to be more reliable than two-candle patterns because they tell a more complete reversal story: trend confirmation, exhaustion, and reversal confirmation across three sessions of evidence. But … Read more

Engulfing Patterns: Bullish and Bearish Setups for Trading

The engulfing pattern is one of the most recognisable two-candle reversal signals in technical analysis. But there is a critical distinction between an engulfing pattern that LOOKS correct geometrically and one that actually signals a reversal. This article shows the difference using real NSE data, verified against strict trend and follow-through criteria. According to That … Read more