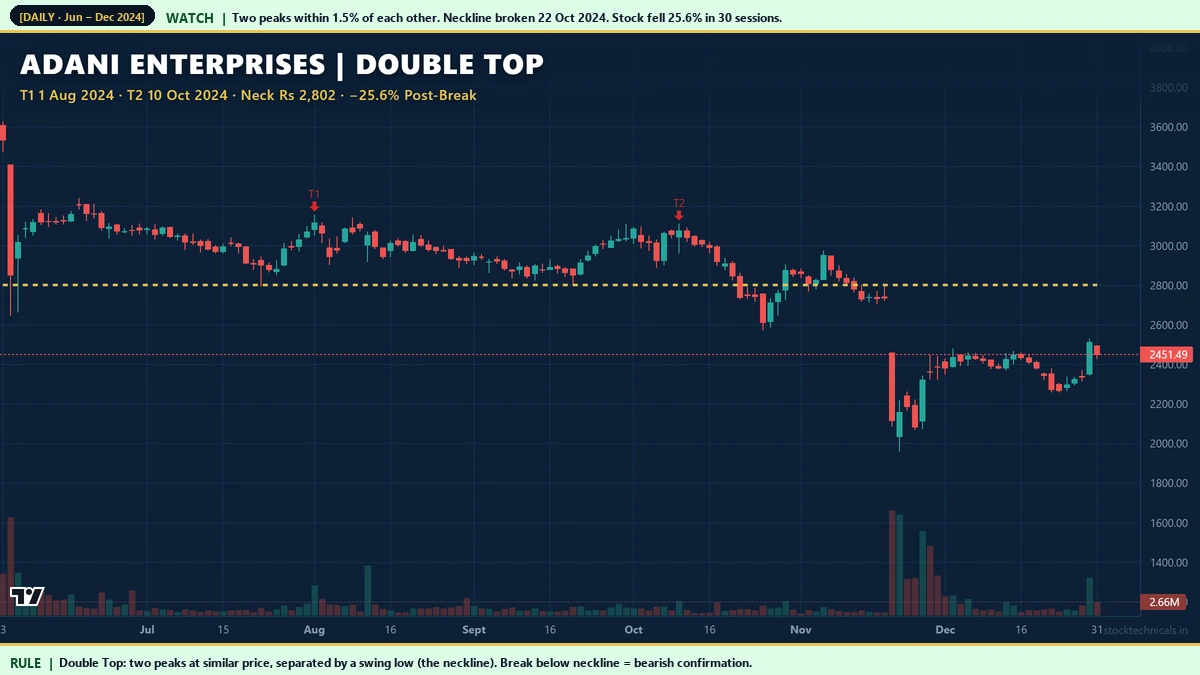
RSI Basics: The Relative Strength Index Explained with NSE Examples
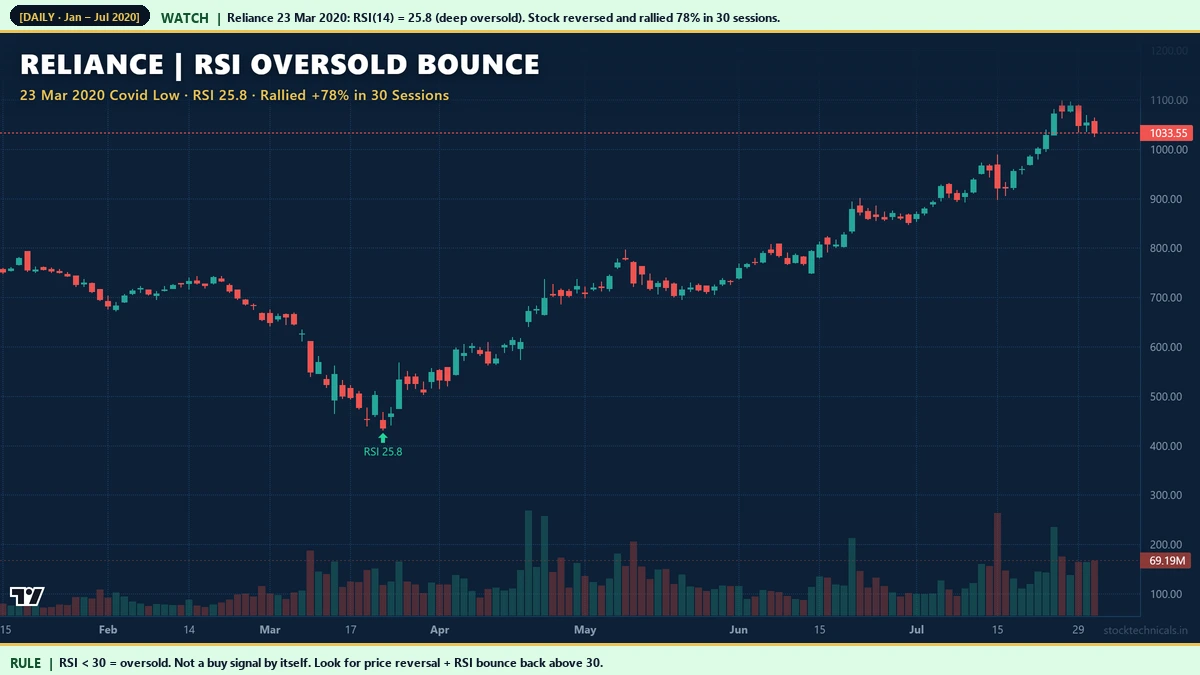
The Relative Strength Index (RSI) is a momentum oscillator that measures how fast and how far prices have moved recently. Developed by J. Welles Wilder in 1978, it ranges from 0 to 100 and is one of the most widely used indicators in technical analysis. Readings above 70 suggest overbought conditions; readings below 30 suggest … Read more