Quick Answer: ATR (Average True Range) measures how much a stock typically moves per period, combining intraday gaps and regular high-low ranges. Use it to place volatility-adjusted stops (1.5-2× ATR) and size positions consistently (Risk ÷ ATR). It never tells direction — only magnitude.
Published February 26, 2026 · Last refreshed April 27, 2026. Prices and data are compiled with reasonable care but — always confirm against your broker before trading.
Key Takeaways
- Use ATR for stop loss placement at 1.5-2× ATR below support — not arbitrary fixed distances or flat percentages.
- Size positions via Risk-per-trade ÷ ATR, keeping ₹ loss consistent across high and low volatility periods.
- ATR contains no directional signal. It measures volatility magnitude only — always combine with price action or trend confirmation.
- ATR squeeze (volatility at 20-30 day lows) often precedes explosive breakouts. Wait for ATR spike + price confirmation before entry.
- Stick with ATR(14) across timeframes — the period Welles Wilder designed. Works on 1-minute, 5-minute, hourly, and daily charts identically.

ATR: Average True Range Explained
Introduction
Volatility is the heartbeat of markets. When volatility spikes, your stop losses need wider room to breathe. When volatility crashes, you can afford tighter stops. But how do you measure volatility objectively?
This is where ATR (Average True Range) comes in.
ATR is one of the most underrated indicators in technical analysis—especially for beginners. While most traders focus on trend indicators like EMA and momentum indicators like RSI or MACD, they often neglect volatility measurement. Big mistake.
Here’s why ATR matters: ATR tells you how much a stock typically moves in one period. If ATR is ₹2.50, the stock is moving an average of ₹2.50 per candle (or per day, depending on your timeframe). This simple number unlocks three powerful uses:
- Stop loss placement — Place stops 1.5x ATR below recent support, not at arbitrary prices
- Position sizing — Risk ₹500 per trade? Divide by ATR to find how many shares to buy
- Trade setup filtering — Skip low-ATR periods; trade during ATR expansion
Most beginners ignore ATR and then wonder why their stop losses get massacred in a choppy market, or why their position sizes blow up their account. ATR solves both problems.
In this guide, you’ll learn exactly how ATR works, how to calculate it, and most importantly, how to use it to place smarter stops and size positions correctly. We’ll use examples from Nifty 50, Bank Nifty (NSE: BANKNIFTY), and Indian stocks like Reliance, TCS, and HDFC Bank.
By the end, you’ll understand why ATR is just as important as support/resistance levels. You’ll also see how ATR works alongside other indicators like Bollinger Bands, ADX, and Supertrend (which actually uses ATR under the hood).
Let’s start.
What is ATR (Average True Range)?

ATR stands for Average True Range. It was created by J. Welles Wilder Jr., the legendary technician who also invented RSI, ADX, and several other indicators you’ll learn about soon.
Here’s the core idea: Most traders measure volatility using the distance from high to low. But that’s incomplete. Imagine yesterday’s close was ₹450, and today the market opens at ₹448 and then rallies to ₹460. The high-to-low distance is only ₹12 (460 – 448). But the true volatility was bigger: the market moved from ₹450 (yesterday’s close) down to ₹448, then up to ₹460—a bigger swing than 12 points shows.
This is where True Range comes in.
True Range: The Three Scenarios
True Range (TR) is the greatest distance across three scenarios:
- Current High − Current Low
– Simple high-to-low range for today
- Current High − Previous Close
– Measures how far today’s high is from yesterday’s close (upside gap)
- Previous Close − Current Low
– Measures how far today’s low is from yesterday’s close (downside gap)
You pick the largest of these three. That’s one period’s True Range.
Example (Nifty 50):
- Yesterday’s close: ₹21,500
- Today’s high: ₹21,580
- Today’s low: ₹21,460
Scenario 1: High − Low = 21,580 − 21,460 = ₹120
Scenario 2: High − Prev Close = 21,580 − 21,500 = ₹80
Scenario 3: Prev Close − Low = 21,500 − 21,460 = ₹40
True Range = 120 (the largest)
Now, ATR is simply the average of True Range over the last N periods (usually 14 periods). If True Range for the past 14 days is: 120, 115, 118, 95, 110, 105, 125, 130, 108, 112, 115, 120, 118, 122—the ATR would be roughly 114.
That’s it. ATR is the 14-period average of True Range.
What ATR Tells You
- High ATR = Volatility is high. The stock is moving large amounts per candle.
- Low ATR = Volatility is low. The stock is moving small amounts per candle.
- ATR doesn’t show direction — It only shows magnitude. A stock with ATR of ₹5 could be rising or falling; ATR only tells you it’s moving ₹5 on average.
How ATR is Calculated
Let’s walk through a real calculation with a Bank Nifty example.
Step-by-Step Calculation
Day 1:
- Previous Close: ₹45,000
- High: ₹45,150
- Low: ₹44,900
TR = MAX(45,150 − 44,900, 45,150 − 45,000, 45,000 − 44,900) = MAX(250, 150, 100) = 250
Day 2:
- Previous Close: ₹45,100
- High: ₹45,300
- Low: ₹45,050
TR = MAX(45,300 − 45,050, 45,300 − 45,100, 45,100 − 45,050) = MAX(250, 200, 50) = 250
Day 3:
- Previous Close: ₹45,200
- High: ₹45,280
- Low: ₹45,010
TR = MAX(45,280 − 45,010, 45,280 − 45,200, 45,200 − 45,010) = MAX(270, 80, 190) = 270
…[continue for 14 days]…
ATR (first 14 days) = Sum of TR / 14
Once you have the first 14-day ATR, subsequent ATRs use a smoothed average (Wilder’s smoothing formula):
ATR(today) = [ATR(yesterday) × 13 + TR(today)] / 14
This smoothing prevents ATR from spiking too dramatically on one big candle.
The Formula
In plain English:
- Calculate True Range for each day (max of 3 scenarios)
- Average the first 14 True Range values
- For each subsequent day, apply Wilder’s smoothing: (Previous ATR × 13 + Today’s TR) / 14
Fortunately, every platform (TradingView, Zerodha Kite, etc.) calculates this automatically. You don’t need to do math by hand. But understanding the calculation helps you interpret what ATR actually means.
Reading ATR Values
High ATR vs Low ATR
High ATR Example (Nifty 50 during earnings season):
- ATR = ₹180 on 15-minute chart
- Average candle movement = ₹180 (high volatility)
- Wide intraday swings, sharp reversals
- Stop losses need wider placement
Low ATR Example (Nifty 50 during quiet consolidation):
- ATR = ₹35 on 15-minute chart
- Average candle movement = ₹35 (low volatility)
- Choppy, sideways movement, small ranges
- Stop losses can be tighter; more range-bound trading
What ATR Doesn’t Tell You
- Direction. A stock could be in a ₹500 uptrend with ATR = ₹4 (tight consolidation during uptrend), or in a ₹500 downtrend with ATR = ₹4. ATR only shows volatility magnitude.
- Which way it will break. Low ATR (squeeze) often means a big move is coming, but ATR won’t tell you if it’s up or down. You need price action, support/resistance, or trend confirmation.
Using ATR for Stop Loss Placement
This is where ATR becomes a game-changer.
Most beginners place stop losses at “nice round numbers” (₹500, ₹1,000) or at some arbitrary percentage below entry. But volatility matters. If a stock is moving ₹50 per candle on average, a stop loss ₹20 below entry will get whipsawed. If a stock is moving ₹2 per candle, a stop loss ₹20 below entry is too wide.
ATR solves this with a simple rule:
Place your stop loss 1.5x to 2x ATR below (or above) your entry, relative to recent support/resistance.
The ATR Trailing Stop Method
Setup:
- Identify a support level (or recent swing low)
- Check the ATR on your timeframe
- Place stop loss at: Support − (1.5 × ATR)
Example with TCS (Tata Consultancy Services):
- Current price: ₹3,400
- Recent swing low (support): ₹3,360
- ATR(14, daily): ₹35
Stop loss = 3,360 − (1.5 × 35) = 3,360 − 52.5 = ₹3,307.50
This is volatility-adjusted. If TCS has a wild intraday spike down (but bounces off support), your stop won’t get hit. But if TCS closes below ₹3,307.50, you’re out.
Aggressive vs Conservative Stops
- Aggressive: Stop = Support − (1.0 × ATR) — gets hit more often, smaller losses
- Conservative: Stop = Support − (2.0 × ATR) — holds through noise, bigger losses if wrong
Most traders use 1.5x ATR as a sweet spot.
Example: Reliance Industries
Let’s say you’re long Reliance at ₹2,850.
- Recent support: ₹2,810
- ATR(14, 1H chart): ₹18
Your ATR-based stop = 2,810 − (1.5 × 18) = 2,810 − 27 = ₹2,783
If Reliance gaps down 1%, it might hit ₹2,820, but your stop is at ₹2,783. You stay in the trade. If Reliance breaks ₹2,783 and closes below it, the breakout is real—you exit.
Using ATR for Position Sizing
This is the second major use of ATR: sizing your position based on volatility and your risk tolerance.
The Formula
Number of Shares = Risk Per Trade / ATR
Where:
- Risk Per Trade = How much you’re willing to lose on one trade (e.g., ₹500)
- ATR = Current ATR value in rupees
- Number of Shares = How many shares to buy
Example: ₹50,000 Account
Setup:
- Account size: ₹50,000
- Risk per trade: 1% = ₹500
- Entry: HDFC Bank at ₹1,850
- Stop loss: 1.5 × ATR below entry
- ATR(14, daily): ₹12
Calculation:
- Distance from entry to stop = 1.5 × 12 = ₹18
- Number of shares = 500 / 18 = 27.77 shares → round to 27 shares
Position size = 27 × ₹1,850 = ₹49,950
If your stop hits, you lose: 27 × 18 = ₹486 (approximately your ₹500 risk)
If HDFC rallies 2% (₹37), you gain: 27 × 37 = ₹999
This position size is automatically adjusted for volatility. If ATR doubles (volatility spikes), your share count halves. If ATR halves (volatility drops), your share count doubles. Your risk per trade stays constant.
Why This Matters
Without ATR sizing, beginners often buy the same number of shares regardless of volatility. In a high-ATR period (wide swings), they get stopped out at a loss. In a low-ATR period (tight range), they’re underlevered and miss gains. ATR sizing keeps your loss size consistent.
ATR Squeeze: When Volatility Collapses
One of the most powerful setups in trading is the ATR squeeze — when volatility contracts sharply before expanding.
What Happens
- ATR falls to 20-30 day lows — Market is consolidating, choppy, quiet
- Usually lasts 1-4 weeks — Traders get bored, volume dries up
- Suddenly ATR spikes — Big breakout in one direction (up or down)
Trading the Squeeze
The setup:
- Identify when ATR is at 3-month lows (very quiet market)
- Wait for ATR to spike above the average (big move is starting)
- Enter in the direction of the breakout (price action + ATR spike confirms)
- Place stop below/above the consolidation zone
This works because: Low volatility periods are psychological equilibrium. When equilibrium breaks, the move is often sharp. Banks, funds, and algorithms all break out together.
Real Setup on Bank Nifty
- Bank Nifty consolidates for 3 weeks
- ATR drops from ₹250 to ₹80 (squeeze)
- Suddenly ATR spikes to ₹320 (expansion)
- Price breaks above resistance with strong candles
- You enter long with stop at 2x ATR below breakout candle
How to Set Up ATR on TradingView and Zerodha Kite
TradingView Setup
- Open any chart (Nifty 50, Bank Nifty, or your stock)
- Click “Indicators” (top-right toolbar)
- Search “ATR” → Click “Average True Range”
- Default settings: Period = 14 (this is correct)
- ATR appears as a sub-chart below your main price chart
Recommended Settings:
- Period: 14 (default, proven by Welles Wilder)
- Type: Use default (line or histogram)
- Timeframe: Same as your trading timeframe (1H, daily, 15m, etc.)
Zerodha Kite Setup
- Open Kite Web or App
- Go to your chart (Nifty 50, Reliance, etc.)
- Click “Indicators” (top of chart)
- Search “ATR” → Select “Average True Range”
- Set Period to 14
- Click “Apply”
Note: Zerodha Kite displays ATR as a histogram below the price chart.
Timeframe Guide
| Timeframe | Best For | ATR Interpretation |
|---|---|---|
| 1-minute | Ultra-short scalping | Moves in ₹0.50-₹5 range |
| 5-minute | Scalp + short intraday | Moves in ₹5-₹30 range |
| 15-minute | Intraday swing | Moves in ₹20-₹80 range |
| Hourly | Intraday + short-term swing | Moves in ₹50-₹200 range |
| Daily | Swing + position | Moves in ₹100-₹500+ range |
| Weekly | Position + long-term | Moves in ₹500-₹5000+ range |
Use the same ATR period (14) across all timeframes. The absolute ATR values will differ (1-minute ATR is smaller than daily ATR), but the 14-period smoothing is consistent.
Combining ATR with Other Indicators
ATR doesn’t trade alone well. Its best use is alongside other indicators for confirmation.
ATR + Supertrend
Supertrend actually uses ATR internally. Supertrend = (High + Low)/2 ± (Multiplier × ATR)
So when you use Supertrend, you’re already using ATR. No need to add both (it’s redundant).
ATR + Bollinger Bands
Bollinger Bands = Moving Average ± 2 Standard Deviations
Both measure volatility but differently:
- ATR = Average movement per period (simple, universal)
- Bollinger Bands = Standard deviation of price (statistical spread)
Use together:
- High ATR + Price touching upper Bollinger Band = Strong uptrend with high volatility
- Low ATR + Price consolidating between bands = Tight range, squeeze setup
- Low ATR → Price breaks band = Potential explosive move
ATR + RSI
RSI = Momentum (overbought/oversold)
ATR = Volatility
Use together:
- RSI > 70 (overbought) + Low ATR = Possible pullback in tight range
- RSI > 70 + High ATR = Strong uptrend, RSI signal is less reliable
- RSI < 30 (oversold) + ATR spiking = Capitulation selling, potential reversal
- RSI < 30 + Low ATR = Boredom, not fear
ATR + Breakout Strategy
Breakout = Price crossing previous highs/lows
Use together:
- Breakout through resistance + ATR spiking = Confirmed breakout (high odds)
- Breakout through resistance + ATR falling = False breakout likely (low odds)
- Breakout on low ATR = Breakout may not sustain; wait for ATR expansion
5 Rules for Using ATR

Here are the core rules every trader should follow:
Use ATR for Stop Loss, Not Direction
ATR tells you volatility, not direction. Don’t think “High ATR = Price will go up.” Use ATR only for stop placement and position sizing.
Adjust Stops for Volatility
Don’t use fixed stop loss percentages. Use 1.5x ATR below support for a volatility-adjusted stop. This prevents whipsaws in high-ATR periods and keeps stops tight in low-ATR periods.
Size Positions by Risk/ATR
Don’t buy the same number of shares in all markets. Size based on Risk Per Trade / ATR. This keeps your loss constant across different volatility regimes.
Use ATR Squeeze as a Setup Filter
Low ATR (squeeze) followed by ATR spike = breakout opportunity. But wait for price confirmation before entering. ATR alone doesn’t tell you direction.
Combine ATR with Trend or Price Action
Never trade based on ATR alone. Use ATR + support/resistance levels, ATR + trend confirmation, or ATR + price action. ATR is a supporting indicator, not a standalone signal.
ATR Checklist: Before Every Trade
Before you enter any trade, ask yourself:
Pre-Trade ATR Checklist:
- [ ] Have I checked today’s ATR value (or current timeframe ATR)?
- [ ] Is my stop loss at least 1.5x ATR away from entry, near support/resistance?
- [ ] Have I calculated position size as Risk Per Trade / ATR?
- [ ] Is ATR currently high or low compared to the past 20 days?
- [ ] If ATR is very high, am I willing to tolerate wider swings?
- [ ] If ATR is very low, am I watching for an ATR spike (breakout)?
- [ ] Does ATR confirm my price action setup (e.g., ATR spike on breakout)?
- [ ] Have I avoided overlevering just because ATR is low?
Common ATR Mistakes
Using ATR to Predict Direction
Wrong: “ATR is rising, so price will go up.”
Right: “ATR is rising, so volatility is increasing. I need wider stops and must confirm entry with price action or trend.”
Ignoring ATR Entirely in Your Trading
Wrong: Using fixed stop losses (e.g., ₹50 below entry) in all market conditions.
Right: Adjusting stops based on volatility (ATR-based stops).
Trading on ATR Squeeze Without Breakout Confirmation
Wrong: “ATR is at 20-day lows, so I’ll buy now in anticipation of breakout.”
Right: “ATR is at 20-day lows. I’ll wait for ATR to spike AND price to break above resistance, then enter.”
Over-Leveraging When ATR is Low
Wrong: “ATR is low, so volatility is low. I can buy more shares to maximize gains.”
Right: “ATR is low. I’ll keep my position size normal (Risk Per Trade / ATR). Low ATR doesn’t mean the move will be bigger; it means the market is quiet.”
Using Different ATR Periods Across Timeframes
Wrong: Using ATR(14) on daily chart, ATR(20) on hourly chart, ATR(5) on 5-minute chart.
Right: Using ATR(14) consistently across all timeframes. The absolute values differ, but the period stays the same.
ATR vs Bollinger Bands vs Standard Deviation
Let’s compare three volatility tools:
| Feature | ATR | Bollinger Bands | Standard Deviation |
|---|---|---|---|
| What it measures | Average true movement per period | Price bands around MA (2 SD) | Statistical spread of price |
| Easy to interpret | Yes (₹ amount) | Yes (visual bands) | Moderately (raw SD value) |
| Best for stop loss | Yes | Yes | No |
| Best for position sizing | Yes | No | No |
| Useful for trend | Indirectly (ATR spike) | Yes (price near bands) | No |
| Lag | Minimal | Moderate | Moderate |
| Most popular | High (Welles Wilder) | Very high (Bollinger) | Moderate (statistical) |
Bottom line: ATR is simpler and more directly useful for stop loss + position sizing. Bollinger Bands are better for identifying breakout zones and squeeze reversals. Use both, but ATR should be your foundation.
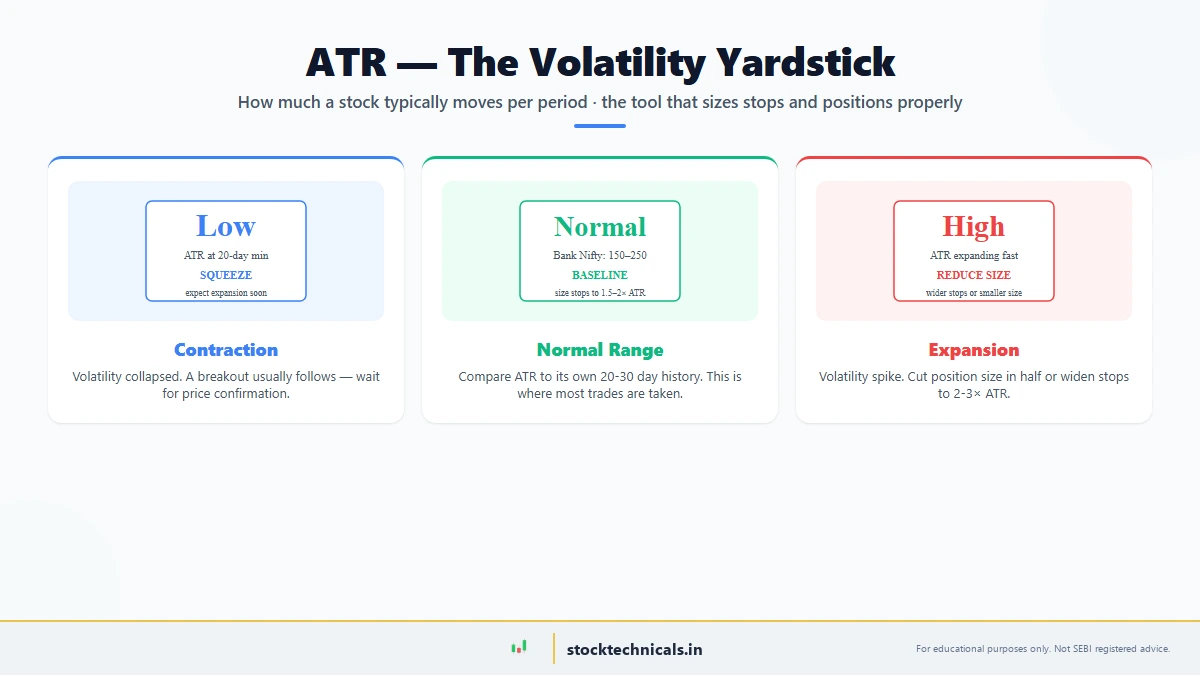
What is a good ATR value?
No universal good value — it depends on stock and timeframe. Bank Nifty daily: 150-250 normal, 350+ expanding. Nifty 50 daily: 80-150 normal. Compare ATR to its own 20-30 day history. High relative to past = expanding volatility. Low relative to past = contracting volatility.
Should I use ATR(14) or a different period?
Stick with ATR(14) — the period Welles Wilder designed and proven across all markets and timeframes. Some traders use ATR(10) for speed or ATR(20) for extra smoothing, but 14 is the standard. Don’t overthink the period.
Can I use ATR on intraday charts (5-min, 15-min)?
Yes. ATR works on 1-minute, 5-minute, 15-minute, hourly, and daily charts equally well. Absolute values differ (5-min ATR is smaller than daily ATR), but the principle and interpretation remain identical. The 1.5-2× ATR stop rule applies at any timeframe.
How do I trade rising ATR?
Rising ATR confirms volatility is increasing — usually supporting breakouts or strengthening trends. Never trade rising ATR alone. Wait for price confirmation (support break, resistance break, or trend alignment) before entering. Consider widening stops to 2-3× ATR when ATR is expanding fast.
Does ATR work on crypto and forex, or only Indian stocks?
ATR is universal. It works on stocks, indices (Nifty, Bank Nifty), crypto, forex, and commodities. Welles Wilder designed it for all markets. The principle — volatility-adjusted stops and sizing — applies anywhere price data exists.
Your Next Step
You now understand how to measure volatility with ATR, place smarter stops, and size positions correctly. ATR is a foundational tool that every trader should use.
Next, we’ll explore On-Balance Volume (OBV) — an indicator that reveals hidden buying and selling pressure using volume. OBV tells you whether volume is supporting or rejecting your price move, which ATR can’t.
Read next: On-Balance Volume: Reading Hidden Buying and Selling Pressure
Self-Assessment Quiz
Test the understanding of volatility-adjusted stops, position sizing, and ATR squeeze.
Test Your Knowledge
Q1: What does ATR measure?
Q2: A common ATR multiple for stop-loss placement is:
Q3: The Welles Wilder default ATR period is:
Q4: Rising ATR signals:
Q5: ATR squeeze (volatility at 20-30 day lows) usually precedes:
The Bottom Line on ATR
ATR is one of the most underrated volatility tools for Indian traders managing Nifty, Bank Nifty, and individual stocks. It solves two problems retail traders face: stops get whipsawed in choppy markets, and position sizes blow up during volatility spikes. A volatility-adjusted stop (1.5× ATR below support) prevents both. Combined with ATR-based position sizing (Risk ÷ ATR), loss per trade stays constant regardless of market conditions. Result: disciplined trading that scales risk to conditions instead of fighting them.
ATR measures volatility, never direction. High ATR does not mean price will rise — it means bigger swings are coming. Never trade ATR squeezes without waiting for actual price-breakout confirmation. Use stop losses and position sizing on every trade, and never risk more than 1-2% of account per position.
Related Articles
- What is Technical Analysis?
- RSI Basics: Understanding the Relative Strength Index
- MACD Basics: Moving Average Convergence Divergence Explained
- ADX: Measuring Trend Strength with the Average Directional Index
- Bollinger Bands: The Complete Beginner’s Guide
- Supertrend Indicator: How It Works and How to Use It
- EMA Basics: What Every Trader Must Know About Exponential Moving Averages
- Support and Resistance: The Complete Guide
- What is a Trend?
- Price Action Basics
- How to Draw Support and Resistance Levels
End of Article