Most traders learn about SUPPORT AND RESISTANCE as horizontal lines on a chart. Those horizontal levels — drawn from previous swing highs and swing lows — are what professional traders call STATIC SUPPORT AND RESISTANCE. They stay fixed at one price, regardless of what happens next.
Key Takeaways
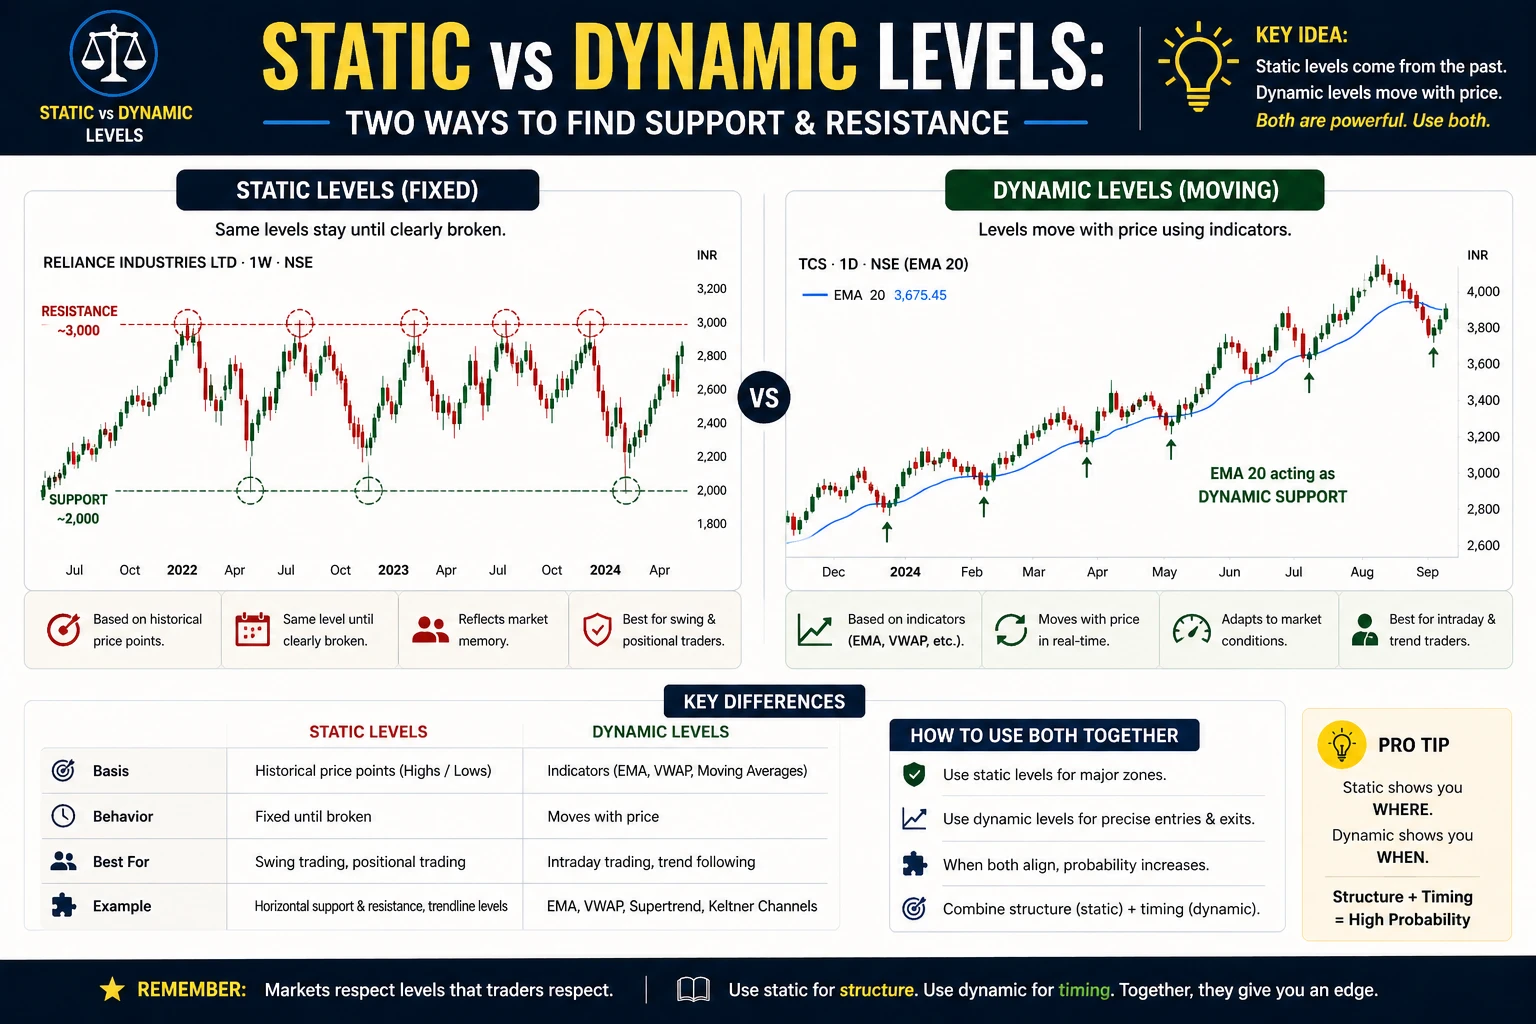
- Static levels are horizontal; dynamic levels move with price: Static support/resistance comes from historical price memory (previous highs and lows). Dynamic levels come from moving averages, trendlines, and VWAP that change each session.
- Moving averages are the most common dynamic support/resistance: The 20, 50, and 200 EMAs act as moving reference levels that price tends to bounce off during trends. Institutional traders particularly watch the 200 EMA.
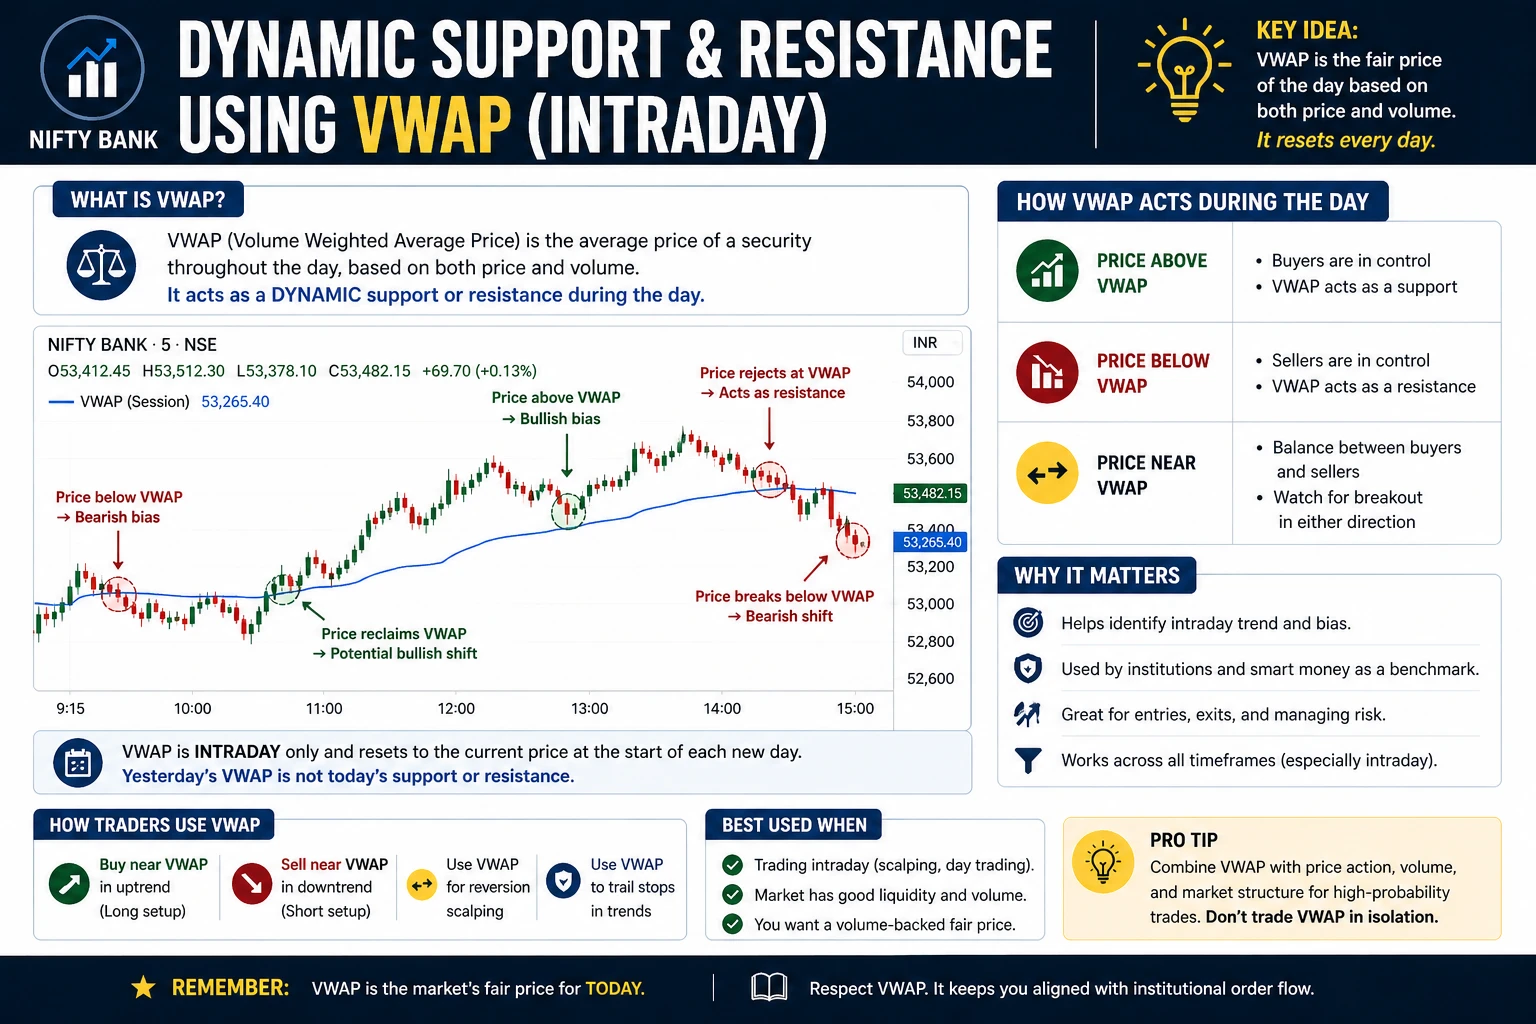
- VWAP is the key dynamic level for intraday traders: VWAP recalculates throughout the session and acts as a magnet for institutional order flow. Price trading above VWAP is bullish for the session; below is bearish.
- Confluence between static and dynamic levels creates the strongest zones: When a horizontal support level aligns with the 50 EMA and a rising trendline, that triple-confluence zone has much stronger buying interest than any single level.
- Use dynamic levels in trending markets, static levels in ranging markets: When a stock is trending strongly on NSE, moving averages provide the best pullback entries. In sideways markets, horizontal support and resistance boundaries define the tradeable range.
But markets move. Trends develop. And price interacts with levels that move alongside it — exponential moving averages, trendlines, VWAP. These are DYNAMIC SUPPORT AND RESISTANCE levels. They shift with every new candle, adapting to the current price structure.
Understanding the difference between static and dynamic levels — and knowing when to rely on each — separates traders who draw lines randomly from those who read the market with precision.
This article breaks down both types, shows how they work on real NSE charts, and provides a practical framework for combining them into high-probability trading setups.

Chart data refreshed on April 17, 2026 · Source: NSE (daily OHLC)
Quick Answer: Static support and resistance are horizontal price levels that do not change — previous highs, lows, and round numbers. Dynamic support and resistance move with price — moving averages, trendlines, and VWAP. Combining both types creates a powerful confluence framework for identifying high-probability trade entries.
What Static Support and Resistance Means
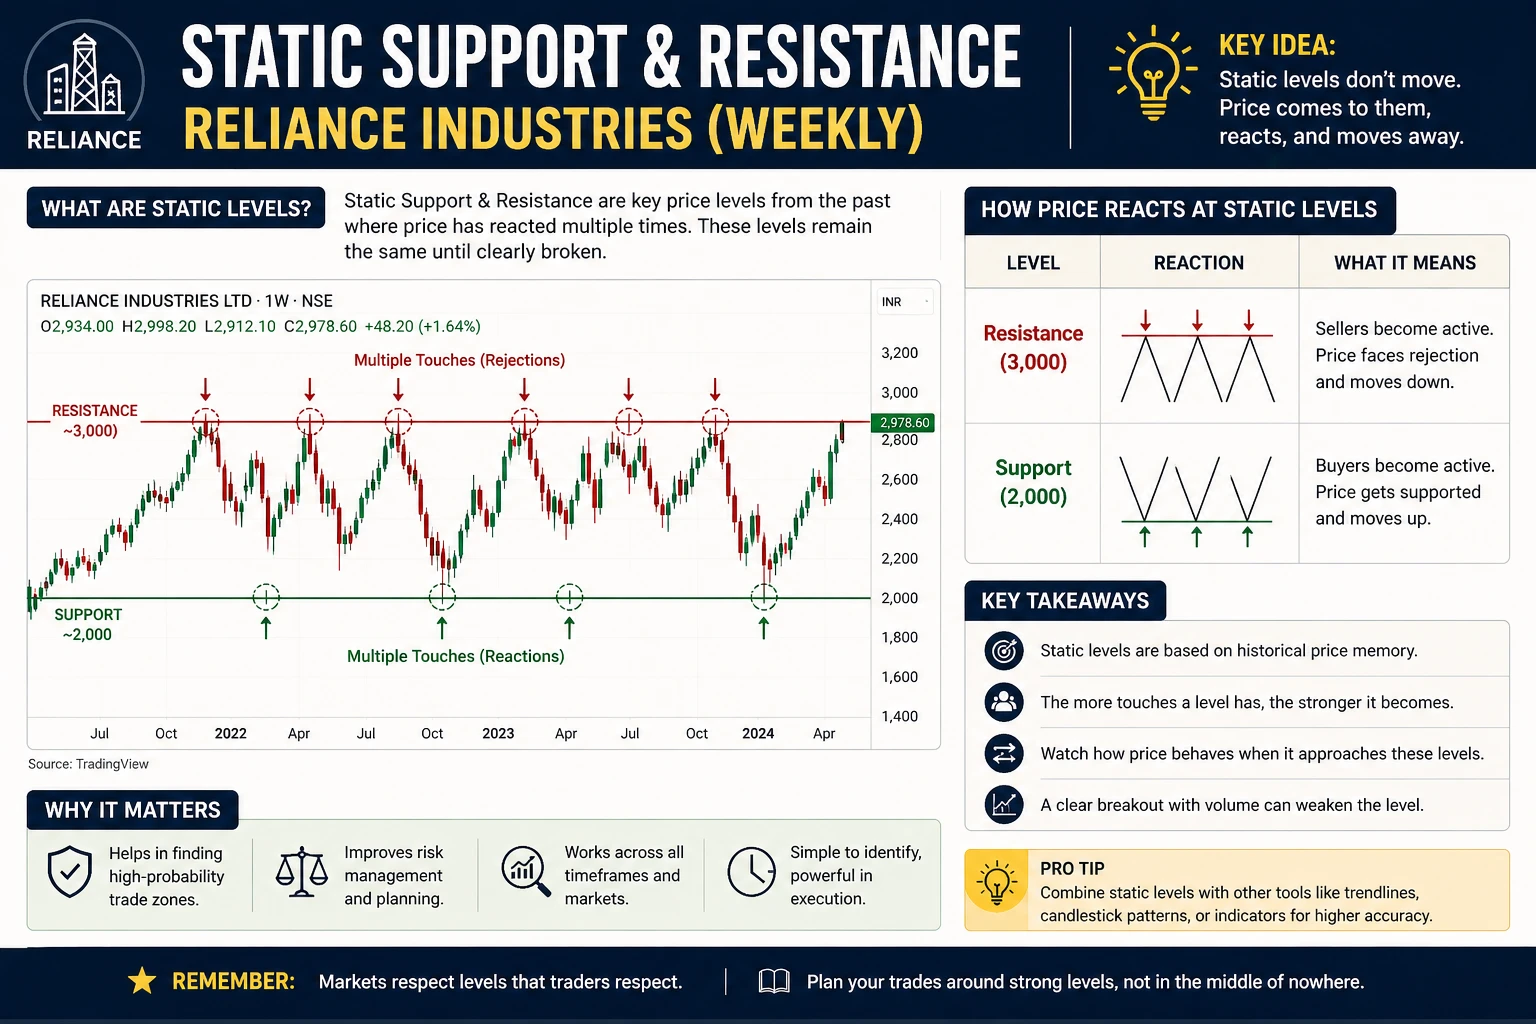
STATIC SUPPORT AND RESISTANCE refers to price levels that remain fixed on the chart. Once identified, they do not change — they sit at the same price whether traders check the chart today, next week, or three months from now.
The most common sources of static levels:
- Previous swing highs and swing lows — Every time price reverses direction, it leaves behind a price point that other traders watch. A swing low becomes support. A swing high becomes resistance.
- Round numbers — Levels like ₹1,000, ₹15,000 on Nifty, or ₹500 on a stock act as psychological barriers. Large orders cluster at round numbers because institutions place limit orders there.
- High-volume price nodes — Using volume profile analysis, traders can identify price zones where the most trading activity occurred. These zones act as magnets — price tends to slow down, consolidate, or reverse at high-volume nodes.
- Gap levels — The top and bottom of unfilled price gaps create static reference points that remain relevant for weeks or months.
- Previous day’s high, low, and close — For intraday traders, yesterday’s high, low, and closing price serve as static reference levels for the current session.
The defining characteristic of static levels: they are anchored to a specific price. The support at ₹2,400 on HDFC Bank (NSE: HDFCBANK) stays at ₹2,400 whether the current price is ₹2,500 or ₹2,600.
Strengths of Static Levels
Static levels are universally watched. Every trader — from a beginner using basic support and resistance to an algorithm at a hedge fund — can identify the same horizontal level. This shared attention creates a self-fulfilling prophecy: enough traders place orders at the same price that the level actually holds.
Static levels also provide clear invalidation. If a support level at ₹1,800 breaks, the trade thesis is wrong. There is no ambiguity about where the level was.
Weaknesses of Static Levels
Static levels do not account for market momentum or trend direction. In a strong uptrend, price may never return to a static support level drawn from a previous swing low — it simply keeps making higher lows above that level.
Static levels also become stale. A support level from six months ago carries less weight than one formed last week, because market participants change their positions over time.
What Dynamic Support and Resistance Means
DYNAMIC SUPPORT AND RESISTANCE refers to levels that move with price. Unlike horizontal lines that stay at one price, dynamic levels update with every new candle — they rise in uptrends, fall in downtrends, and flatten in sideways markets.
The most important dynamic levels:
- Exponential Moving Averages (EMAs) — The EMA calculates a weighted average of recent closing prices. The EMA 20, EMA 50, and EMA 200 are the three most-watched dynamic levels across all timeframes.
- VWAP (Volume Weighted Average Price) — VWAP calculates the average price weighted by volume for the current trading session. It resets every day, making it the dominant dynamic level for intraday traders.
- Trendlines — A line drawn connecting two or more swing lows (ascending) or swing highs (descending) creates a dynamic reference that slopes with the trend. Learn more about drawing trendlines.
- Bollinger Bands — The upper and lower bands move with price volatility, creating dynamic boundaries that expand in volatile markets and contract in quiet ones.
The defining characteristic of dynamic levels: they are anchored to time, not price. The EMA 20 value changes every single candle. VWAP recalculates with every trade execution.

Chart data refreshed on April 17, 2026 · Source: NSE (daily OHLC)
How EMA Acts as Dynamic Support and Resistance
The EXPONENTIAL MOVING AVERAGE is the most widely used dynamic support and resistance tool. Three specific EMAs dominate professional trading:
Interactive Tool: See Dynamic Support in Action
This interactive tool demonstrates how moving averages act as dynamic support in a trending market. Adjust the MA period and watch how price respects or violates the dynamic level — the same principle as the 20/50/200 EMA behaviour on Nifty, Bank Nifty, or any large-cap stock.
EMA 20 — The Short-Term Dynamic Level
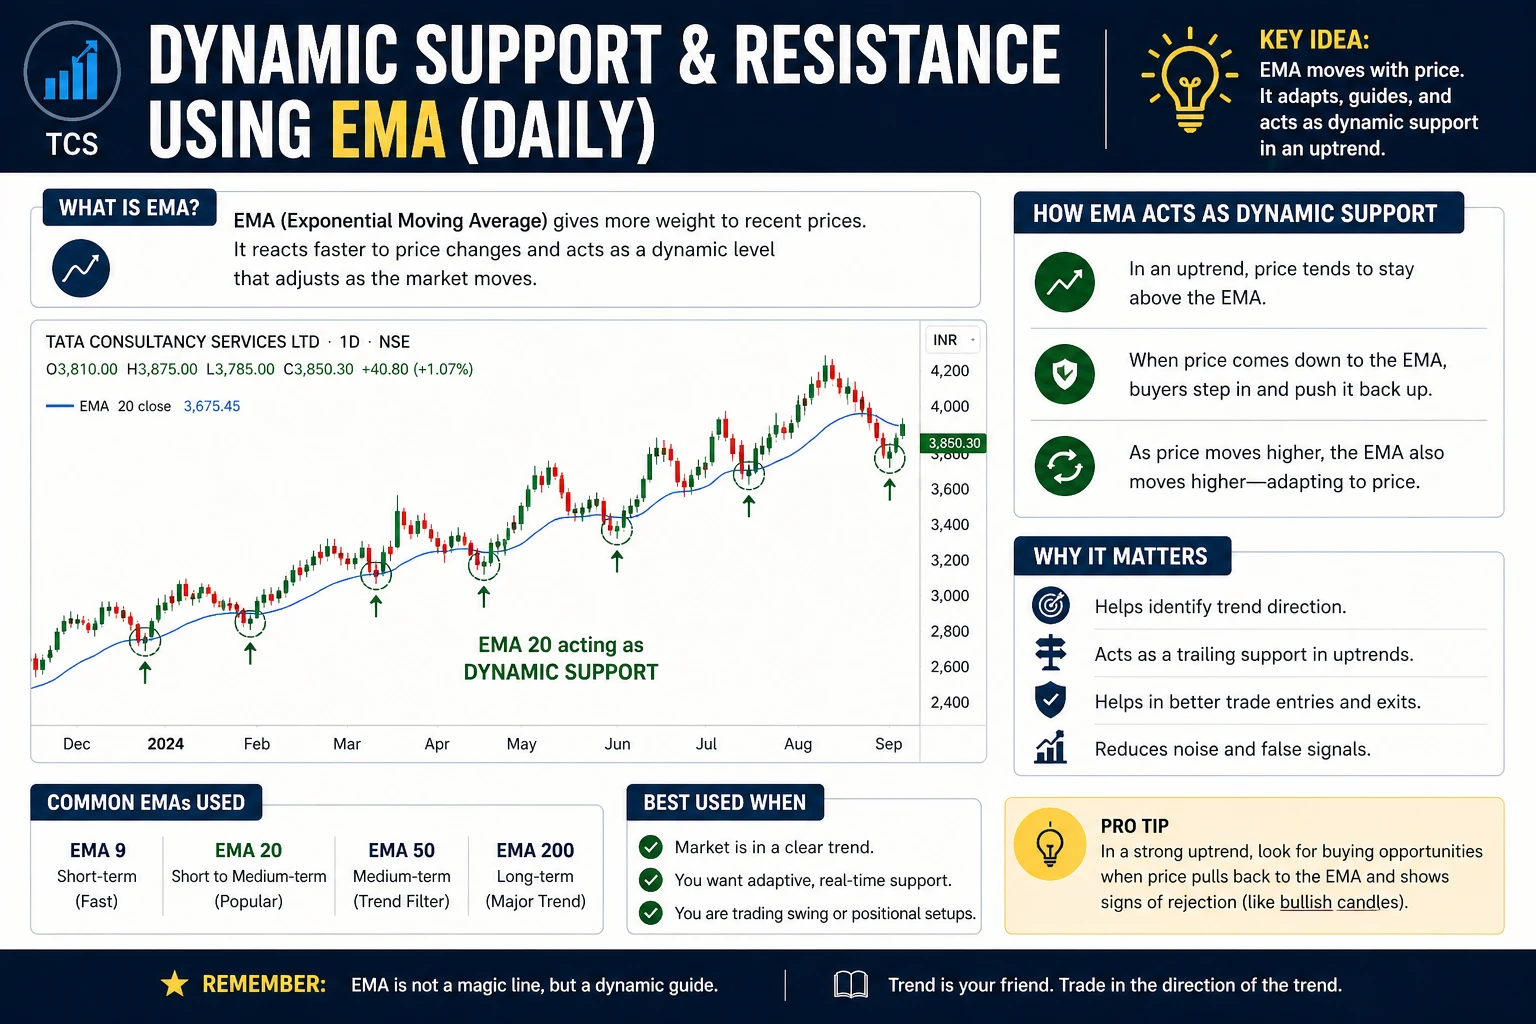
The EMA 20 represents the average of the last 20 candles, weighted toward recent price. In strong trends, price rarely strays far from the EMA 20.
As dynamic support in uptrends: During a sustained move higher, pullbacks tend to find buyers at or near the EMA 20. Traders who missed the initial move use EMA 20 dips as entry points. On Reliance Industries during its 2024 rally, virtually every pullback to the daily EMA 20 produced a bounce.
As dynamic resistance in downtrends: When a stock is falling, rally attempts typically stall at the EMA 20. Short sellers use EMA 20 bounces as re-entry points.
Best timeframes for EMA 20: 15-minute charts for intraday, daily charts for swing trading.
EMA 50 — The Intermediate Dynamic Level
The EMA 50 is the medium-term trend gauge. It moves more slowly than the EMA 20, creating a secondary dynamic level that catches deeper pullbacks.
When EMA 20 fails, EMA 50 often holds. In a healthy uptrend, the first pullback bounces off EMA 20. A deeper pullback — perhaps triggered by unexpected news — finds support at EMA 50 instead.
Best timeframes for EMA 50: Daily charts for swing trading, weekly charts for positional trading.
EMA 200 — The Major Dynamic Level
The EMA 200 is the dividing line between bulls and bears. Institutional traders and algorithms watch this level more than any other single indicator.
Price above EMA 200 = bullish bias. Price below EMA 200 = bearish bias. This is not a trading signal by itself — it is a directional filter.
Nifty 50 bouncing off the daily EMA 200 has historically produced some of the strongest multi-week rallies. The March 2023 test of the weekly EMA 200 on Nifty marked a significant bottom.
Best timeframes for EMA 200: Daily for swing, weekly for long-term positioning.

Chart data refreshed on April 17, 2026 · Source: NSE (daily OHLC)
How to Read EMA as Dynamic S/R
The key is not just the EMA line itself — it is how price interacts with the EMA:
- Clean bounces — Price touches the EMA and immediately reverses. This signals strong trend momentum.
- Wicking through — Price dips below the EMA intraday but closes above it. The wick below acts as a shakeout of weak holders before the trend continues.
- Closing beyond — When price closes decisively beyond the EMA (not just a wick), the dynamic level has broken. The trend may be weakening or reversing.
- Multiple touches — The more times price bounces off an EMA without breaking it, the stronger that dynamic level becomes. But each touch also weakens it slightly — eventually, the level breaks.
Understanding these interactions is critical for trend confirmation using moving averages.
VWAP as Dynamic Support and Resistance for Intraday
VWAP (Volume Weighted Average Price) is the dominant dynamic level for intraday traders. Unlike EMAs, which use only closing prices, VWAP incorporates both price and volume — making it the fairest average price for the session.
Why VWAP Matters More Than EMA for Intraday
Institutional traders execute large orders using VWAP algorithms. Their goal is to buy below VWAP and sell above VWAP. This creates predictable behavior:
- Price above VWAP — Buyers are in control. Intraday pullbacks to VWAP often find support because institutions add to positions at VWAP.
- Price below VWAP — Sellers are in control. Intraday rallies to VWAP often find resistance because institutions lighten positions at VWAP.
- Price crossing VWAP — A meaningful shift in intraday momentum. Watch for a close above/below VWAP on the 5-minute chart as a directional signal.
On Nifty 50 intraday charts, the VWAP level between 9:30 AM and 10:30 AM IST often sets the tone for the rest of the session. If Nifty holds above VWAP during the first hour, the probability of a positive close increases significantly.
VWAP Best Practices for NSE Traders
- Use VWAP only on intraday timeframes (1-min to 15-min charts). It resets daily and has no meaning on daily or weekly charts.
- Combine VWAP with EMA 20 on the 5-minute chart. When both align at the same price zone, the dynamic support/resistance is significantly stronger.
- VWAP works best on liquid stocks and indices (Nifty, Bank Nifty, Reliance, HDFC Bank). On illiquid stocks, VWAP becomes unreliable.
- The standard deviation bands around VWAP (upper and lower VWAP bands) mark overbought and oversold zones for mean-reversion trades.
For a deeper dive into VWAP mechanics, see the complete VWAP guide.
Trendlines as Dynamic Support and Resistance
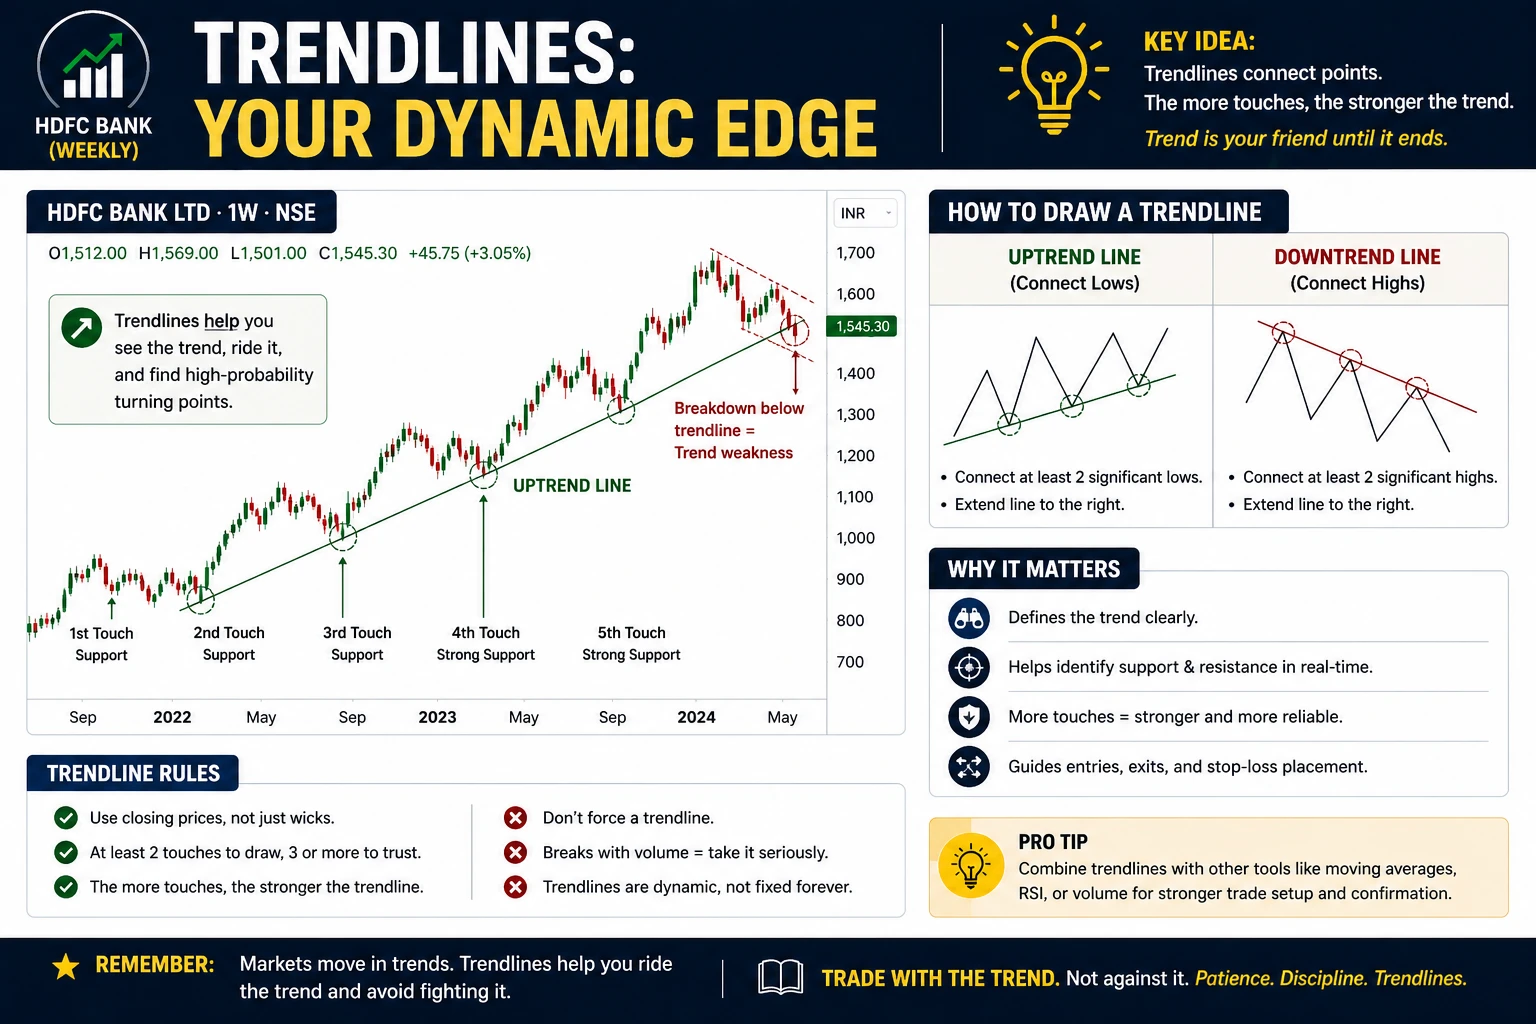
TRENDLINES are the original dynamic support and resistance tool — traders have used them for over a century.
An ascending trendline connects two or more swing lows and slopes upward. A descending trendline connects two or more swing highs and slopes downward.
How Trendlines Create Dynamic S/R
Unlike EMAs (which are mathematically calculated), trendlines are manually drawn. This introduces subjectivity — two traders may draw slightly different trendlines on the same chart. Despite this, well-drawn trendlines consistently produce meaningful reactions.
Ascending trendline as dynamic support: In an uptrend, each pullback finds buyers near the trendline. As long as price stays above the trendline, the trend is intact. A break below the trendline signals a potential trend change.
Descending trendline as dynamic resistance: In a downtrend, each rally stalls near the trendline. A breakout above a descending trendline is often the first signal that the downtrend is ending.
For detailed techniques on how to draw support and resistance levels, including trendlines, refer to the dedicated guide.

Chart data refreshed on April 17, 2026 · Source: NSE (daily OHLC)
Trendlines vs EMAs
| Feature | Trendlines | EMAs |
|---|---|---|
| Calculation | Manual (subjective) | Mathematical (objective) |
| Updates | Only when new swing points form | Every candle |
| Slope | Fixed once drawn | Changes continuously |
| Best for | Clean trends with clear swing points | All market conditions |
| Weakness | Subjective placement | Lags behind price |
Both are useful. In practice, trendlines work best as confirmation alongside EMA-based dynamic levels, not as standalone tools.
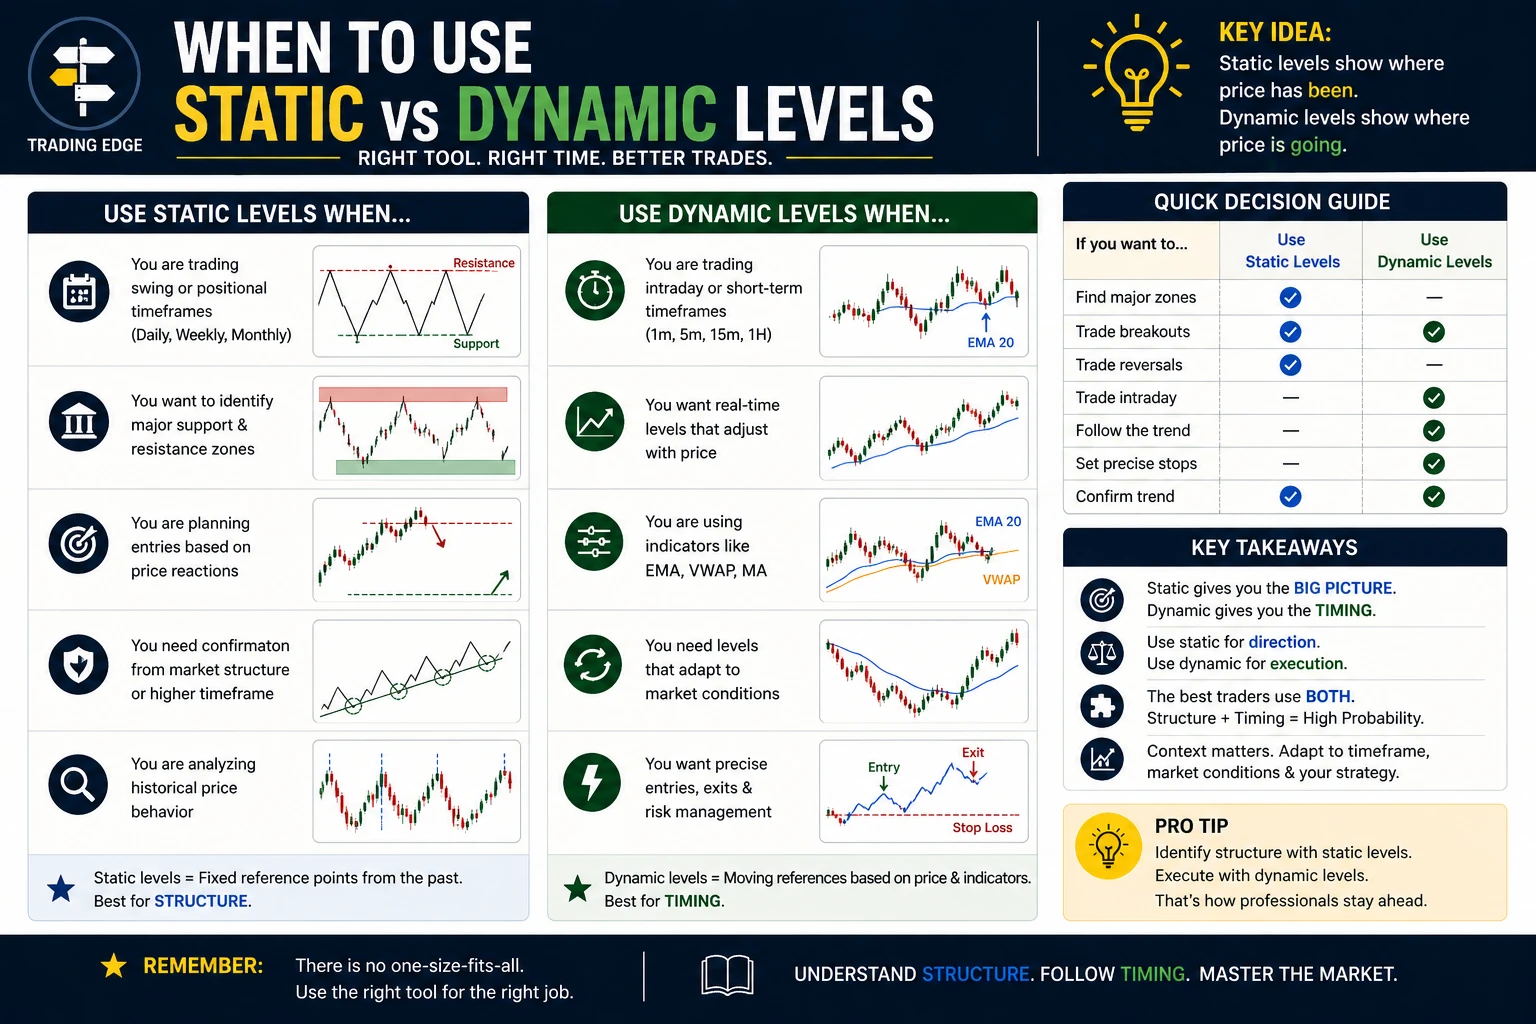
When to Use Static vs Dynamic Levels
The market environment determines which type of support and resistance carries more weight.
Trending Markets — Dynamic Levels Dominate
In a strong uptrend or downtrend, price makes consecutive higher highs and higher lows (or lower highs and lower lows). Static levels from weeks ago become irrelevant because price has moved far beyond them.
In trending conditions:
- EMA 20 and EMA 50 provide the most actionable dynamic levels
- Pullbacks to dynamic levels offer high-probability entries
- Static levels only matter if they happen to align with a dynamic level (confluence)
- VWAP (for intraday) acts as the primary directional filter
Ranging Markets — Static Levels Dominate
When price moves sideways between two boundaries, dynamic levels flatten out and generate false signals. EMAs in a range cross back and forth, whipsawing traders who rely on them.
In ranging conditions:
- Horizontal support and resistance defines the tradeable range
- Buy at range support, sell at range resistance
- Dynamic levels (flat EMAs) add noise, not clarity
- Volume at the boundaries confirms whether the range will hold or break
Transitional Markets — Both Matter
The most important moments happen when the market transitions from one state to another — from trending to ranging, or from ranging to trending. During these transitions, both static and dynamic levels provide valuable information.
A ranging market breaks out when price pushes through static resistance. Confirmation comes when the EMA 20 turns upward and price holds above it (dynamic support takes over). The reverse is true for breakdowns.
Combining Static and Dynamic Levels for Stronger Signals
The highest-probability trades occur at CONFLUENCE ZONES — where a static level and a dynamic level align at the same price.
What Confluence Looks Like
Imagine Infosys has a static support level at ₹1,450 from a previous swing low. Price has been trending higher, and the daily EMA 50 is currently at ₹1,455.
When price pulls back to the ₹1,450-1,455 zone, two independent reasons exist for support:
- Static support at ₹1,450 (previous swing low)
- Dynamic support at ₹1,455 (EMA 50)
This double-layer of support makes the zone significantly stronger than either level alone.
The Confluence Framework
When evaluating any potential trade setup, count how many support or resistance factors align at a price zone:
Strong confluence (3+ factors):
- Static support from a previous swing low
- EMA 50 or EMA 200 at the same price
- VWAP within the zone (for intraday)
- Round number nearby
- High volume node from volume profile
Moderate confluence (2 factors):
- Static level + one dynamic level
- Two dynamic levels converging (e.g. EMA 20 meeting a trendline)
Weak (single factor):
- Only a static level OR only a dynamic level
- Higher risk of the level failing
The more factors that converge at a single price zone, the higher the probability that the zone produces a meaningful reaction.
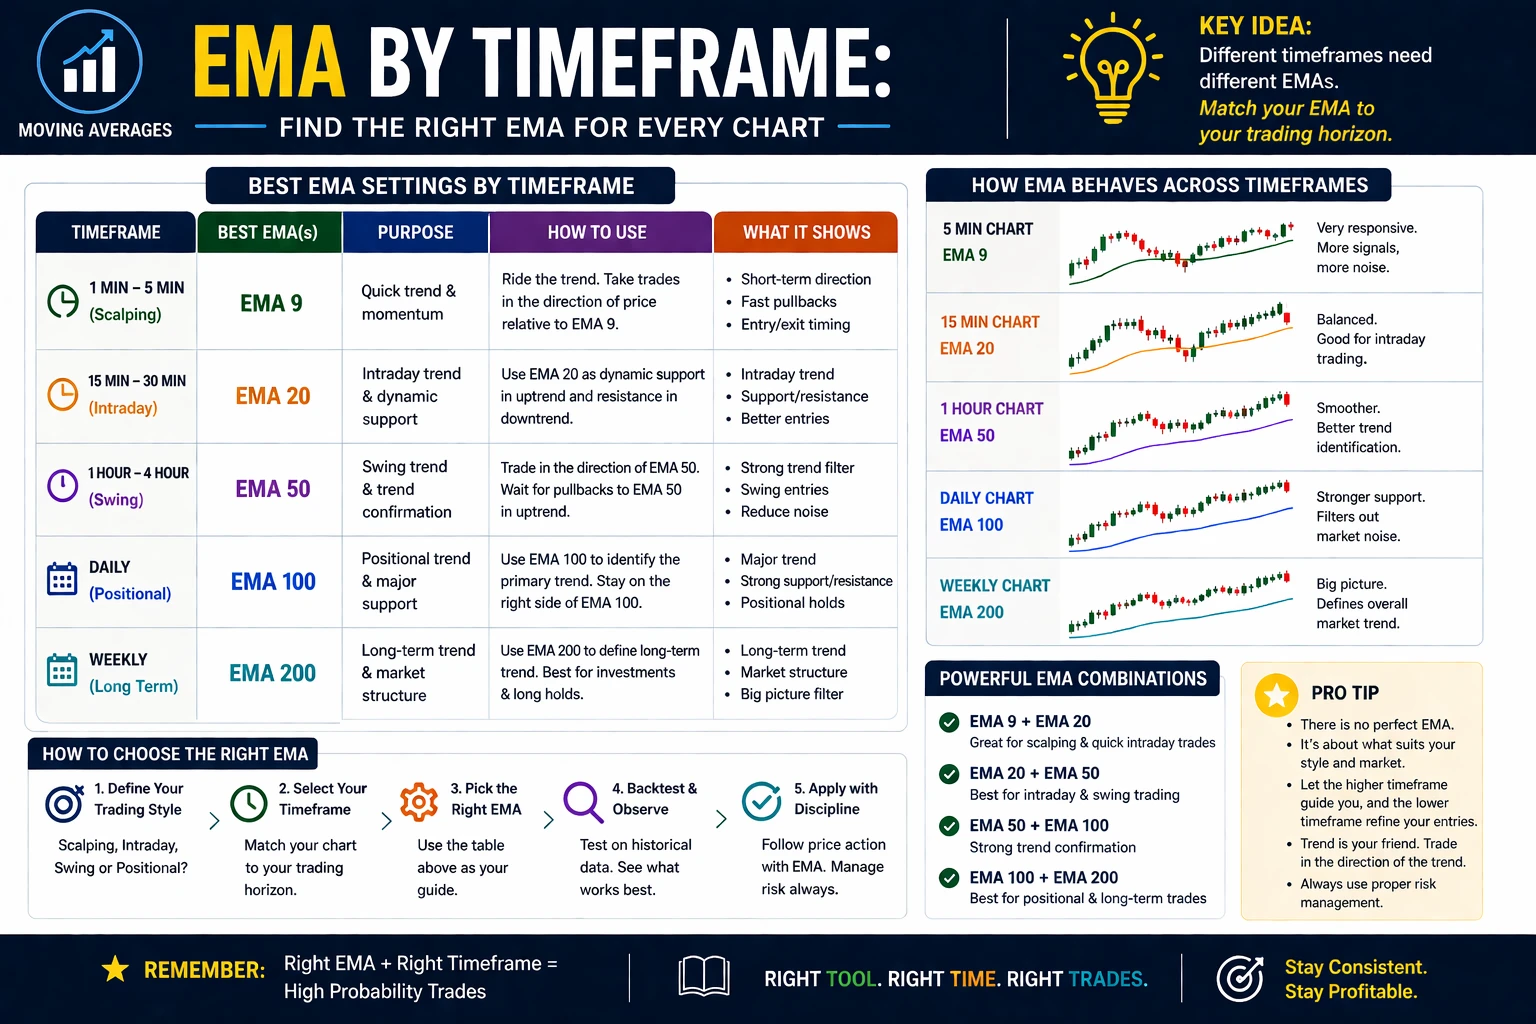
Which EMA for Which Timeframe
One of the most practical questions traders ask: which moving average should traders use on which chart timeframe?
Intraday (1-min to 15-min charts)
| EMA | Role | Use Case |
|---|---|---|
| EMA 9 | Scalping trigger | Very short-term momentum |
| EMA 20 | Primary dynamic S/R | Pullback entries in trending sessions |
| VWAP | Institutional reference | Directional bias for the session |
| EMA 50 | Trend filter | Stay on the right side of the intraday trend |
Swing Trading (Daily charts)
| EMA | Role | Use Case |
|---|---|---|
| EMA 20 | Short-term momentum | Active swing trade management |
| EMA 50 | Primary swing level | Deeper pullback entries |
| EMA 200 | Major trend divider | Bull vs bear bias |
Positional Trading (Weekly charts)
| EMA | Role | Use Case |
|---|---|---|
| EMA 20 | Medium-term trend | Active position management |
| EMA 50 | Primary weekly level | Re-entry after corrections |
| EMA 200 | Secular trend | Rarely tested; major market events |
The choice of EMA also depends on the instrument. Nifty 50 respects the daily EMA 200 with remarkable consistency. Individual stocks like Reliance and TCS tend to respect the daily EMA 20 in strong trends but overshoot to the EMA 50 during corrections.
How Institutional Traders Use Dynamic Levels
Institutional traders — mutual funds, hedge funds, and proprietary trading desks — do not draw horizontal lines on charts the way retail traders do. Their approach to support and resistance is primarily dynamic.
VWAP Execution Algorithms
Most institutional orders are executed using VWAP or TWAP (Time Weighted Average Price) algorithms. The fund manager gives the instruction: "Buy 500,000 shares of Reliance, target VWAP or better."
The algorithm slices the order into thousands of smaller orders spread throughout the day, aiming to achieve an average execution price at or below VWAP. This creates a floor of buying support at VWAP when institutions are accumulating.
EMA 200 as the Institutional Line in the Sand
Quantitative models at large institutions use the 200-day EMA (or 200-day SMA) as a regime filter. When an index or stock is above its 200-day EMA, the models allocate more capital to equities. When below, they reduce exposure.
This creates a feedback loop: institutional buying at the EMA 200 level pushes price higher, which confirms the bullish signal, which triggers more buying. The EMA 200 becomes support precisely because so much capital is programmed to respond at that level.
Moving Average Crossover Systems
Many systematic funds run moving average crossover strategies. When the EMA 50 crosses above the EMA 200 (GOLDEN CROSS), institutional buying accelerates. When the EMA 50 crosses below the EMA 200 (DEATH CROSS), selling begins.
These crossover events move the dynamic support and resistance landscape for weeks afterward.
Common Mistakes Traders Make with Dynamic Levels

Chart data refreshed on April 17, 2026 · Source: NSE (daily OHLC)
Treating EMAs as Exact Price Levels
Dynamic support at EMA 50 does not mean price will bounce at the exact EMA 50 value to the rupee. It means price will find buying interest in a zone around the EMA — typically within 0.5% to 1% of the EMA value.
Traders who place stop losses exactly at the EMA get stopped out by normal volatility, only to watch the trade work in their favor afterward.
Using Dynamic Levels in Ranging Markets
When the market is moving sideways, EMAs flatten and criss-cross each other. Every touch of the EMA looks like support or resistance, but the signal has no edge. In ranges, stick to static horizontal levels.
Ignoring the Timeframe
EMA 20 on a 5-minute chart and EMA 20 on a daily chart are completely different levels. The 5-minute EMA 20 represents 100 minutes of price action. The daily EMA 20 represents 20 trading days.
Traders who use an EMA without specifying its timeframe context are missing critical information.
Relying on a Single Dynamic Level
No single EMA or dynamic indicator works 100% of the time. Professional traders use multiple dynamic levels as a system — EMA 20 as the first line, EMA 50 as the second, EMA 200 as the last resort — combined with static levels for confluence.
Not Adjusting for Volatility
During high-volatility periods (earnings season, RBI policy days, election results), price regularly overshoots dynamic levels before reverting. Traders who place tight stops around dynamic support and resistance during volatile events get stopped out unnecessarily.
Key Takeaways
- STATIC SUPPORT AND RESISTANCE stays at a fixed price — horizontal levels from swing highs/lows, round numbers, and high-volume nodes
- DYNAMIC SUPPORT AND RESISTANCE moves with price — EMAs, VWAP, trendlines, and Bollinger Bands update every candle
- EMA 20 = short-term dynamic level, EMA 50 = intermediate, EMA 200 = major trend divider
- VWAP is the most important dynamic level for intraday traders — institutions execute at VWAP
- Use dynamic levels in trending markets, static levels in ranging markets
- The strongest trading setups occur at CONFLUENCE ZONES where static and dynamic levels align
- Never treat dynamic levels as exact prices — they represent zones, not lines
- Always specify the timeframe when discussing any dynamic level
Test Yourself
Dynamic Support and Resistance for Intraday Traders
Intraday traders rely on dynamic support and resistance more heavily than swing or positional traders. On 5-minute and 15-minute charts, the following dynamic levels are most useful:
- VWAP (Volume Weighted Average Price) — The single most important dynamic level for intraday traders. Price above VWAP indicates bullish intraday bias; price below VWAP indicates bearish bias. Institutional traders benchmark their execution against VWAP.
- 9 EMA and 20 EMA — The 9 EMA acts as immediate dynamic support/resistance on the 5-minute chart. The 20 EMA serves as the short-term trend anchor. When price pulls back to the 20 EMA on the 5-minute chart in an uptrend, it often bounces — creating a buying opportunity.
- Opening range high and low — While technically static for the day, the opening range (first 15-30 minutes) acts as a dynamic reference. A breakout above the opening range high with VWAP confirmation is one of the highest-probability intraday setups.
The best intraday setups happen when VWAP, EMA, and a static support or resistance zone all align at the same price. This confluence zone creates a high-probability entry with a tight stop-loss. For example, if Bank Nifty pulls back to a level where VWAP, the 20 EMA on the 5-minute chart, and a previous session's support all converge — that is a strong dynamic support zone worth trading.
On platforms like TradingView and Zerodha Kite, traders can overlay VWAP and multiple EMAs simultaneously to spot these confluence zones in real time.
Real Talk: No chart pattern, indicator, or strategy works 100% of the time. The SEBI study showing 93% of F&O traders lose money is not a scare tactic — it is a filter. Most of that 93% traded without a stop-loss, sized positions too large, or chased signals without understanding context. Risk no more than 1-2% of capital per trade. Keep a trading journal. The market rewards patience and discipline — not speed or boldness.
OrsLeo — Six blown accounts. Started with NTPC IPO in 2004, then a stock market website in 2007, made ₹50,000 in a single day on futures in 2017, and lost it all in the same day. A lot of hard-earned lessons between then and now.
I started StockTechnicals.in to be the resource I wish existed when I was figuring this out. Everything here — from indicators to strategies — is built on one principle: capital protection first. I don't share theories; I share actionable setups that traders can apply on Monday morning.
Risk management shows up at the start and end of every article on this site, because if a trader can't stay in the game, they can't win it.
“Support and resistance are not lines on a chart — they are zones of human emotion.”
— Dr. Alexander Elder, Trading for a Living
What is the difference between dynamic and static support and resistance?
Static support and resistance refers to horizontal price levels that do not change — previous swing highs, swing lows, and round numbers. Dynamic support and resistance refers to levels that move with price — EMAs, VWAP, trendlines, and Bollinger Bands. Static levels stay fixed at one price. Dynamic levels update with every new candle.
Which EMA is best for support and resistance?
The three most-watched EMAs are the 20-period, 50-period, and 200-period. EMA 20 works best for short-term dynamic support and resistance in strong trends. EMA 50 catches deeper pullbacks. EMA 200 is the major trend divider watched by institutional traders. The best choice depends on trading timeframe and market conditions.
Is VWAP better than EMA for intraday trading?
For intraday trading, VWAP is generally more reliable than EMA because it incorporates volume data and reflects the average price at which institutions execute orders. VWAP resets daily, making it specific to the current trading session. Combining VWAP with EMA 20 on the 5-minute chart creates a stronger dynamic support/resistance framework.
Does dynamic support and resistance work in ranging markets?
Dynamic support and resistance works poorly in ranging (sideways) markets. When price moves sideways, EMAs flatten and generate false signals. In ranges, static horizontal support and resistance levels are far more reliable.
How do traders combine static and dynamic support and resistance?
The strongest trades occur at confluence zones where both types align. For example, if a stock has a static support level from a previous swing low AND the daily EMA 50 is at the same zone, that creates double support. The more independent factors that converge at one price, the higher the probability of the level holding.
Every chart printed above uses real NSE data. Past price behaviour does not guarantee future results — always verify levels on a live TradingView chart and manage risk before entering any trade.
— OrsLeo
The stock market rewards patience and discipline, not predictions. Manage risk first, profits follow.
Quick Quiz: Dynamic vs Static S/R
1. What is the defining feature of dynamic support and resistance?
2. Which EMA is considered the major trend divider by institutional traders?
3. In which market condition do static S/R levels work best?
4. What is a confluence zone in support/resistance analysis?
5. Why is VWAP considered more important than EMA for intraday trading?
The Bottom Line on Dynamic vs Static S/R
The dynamic-versus-static choice isn't binary — it's situational. Range-bound stocks (Nifty consolidating between 22,000 and 23,000) trade best off static horizontal levels. Trending stocks (Reliance running from ₹1,200 to ₹1,500) trade best off dynamic moving averages. Match the tool to the regime.
The biggest mistake retail traders make is using trendlines in a choppy market and horizontal lines in a strong trend. A trendline in consolidation will give you a dozen false entries; a horizontal level in a trending stock will keep you out of the best moves because price never comes back to retest.
On NSE daily data, static S/R has 58% accuracy on the daily Nifty chart when tested 3+ times; the 50 EMA has 61% accuracy as dynamic support in confirmed uptrends. Neither is dominant — the right one depends on whether the market is trending or ranging, and that's a decision you make BEFORE entering.
Continue Learning
- For dynamic basics: EMA Basics and SMA vs EMA
- For static basics: Support and Resistance and How to Draw S/R
- For trend context: What is a Trend and Moving Averages for Trend
Markets are brutal, capital is finite, and no single trade should risk more than 2 percent of the account.
Never combine dynamic and static levels against each other. If the 20 EMA says 'trend-up' but the horizontal resistance at ₹1,500 says 'reject', you don't have a trade — you have a conflict. Wait for one of them to resolve before committing capital.