
Fibonacci retracements are horizontal price levels (23.6%, 38.2%, 50%, 61.8%, 78.6%) drawn across a trend’s swing range. Traders use them to find where a pullback is likely to end and the main trend resume. The 61.8% level — the “golden pocket” — is the single most-watched zone because it is derived from the Golden Ratio (1.618) and so many traders watch it.
Beginner traders on NSE/BSE who already understand support and resistance and want a precise, rule-based way to time pullback entries on Nifty 50, Bank Nifty, and large-cap stocks like Reliance, TCS, HDFC Bank. Works across timeframes but most reliable on 15-minute and higher charts.
If you’ve spent any time analysing stock charts, you’ve noticed something: markets rarely move in a straight line. A stock surges 10%, then dips 3–4%. An index crashes, then bounces 38–50% of the fall before continuing lower. These pullbacks aren’t random — they tend to stop at proportions rooted in one of the most studied mathematical sequences in nature: the Fibonacci numbers.
Fibonacci retracements are a Technical Analysis tool that plots horizontal price levels across a completed price swing. Where classic support and resistance are drawn from past touches (covered in Support and Resistance: The Complete Guide), Fibonacci levels are calculated from the swing’s range and highlight where a pullback often pauses or reverses.
By the end of this guide you’ll know the five key levels, how to draw them the right way on TradingView and Zerodha Kite, how to stack them with other tools, and why the 61.8% level deserves its reputation.
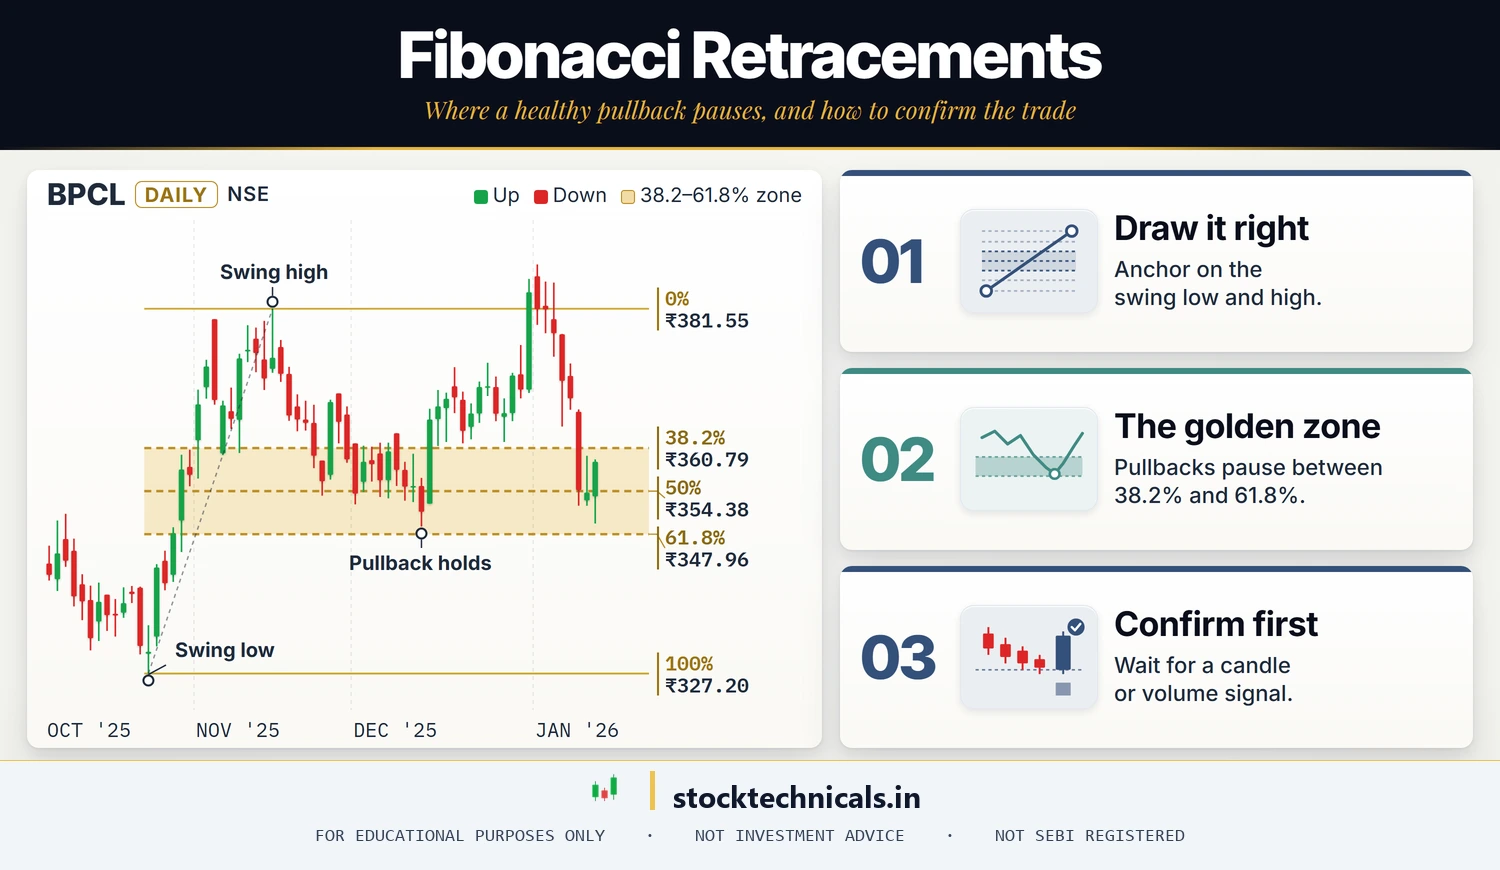
- Five levels matter: 23.6%, 38.2%, 50%, 61.8%, 78.6%. Focus your trading on the middle three.
- The 61.8% level (the “golden pocket”) is the most-watched retracement. Treat it as a zone and act only with a second confirmation.
- Draw from the main swing low to swing high (or vice versa), not minor wicks. Use 15-minute timeframe or higher.
- Never trade a Fibonacci level alone — always add a second confirmation (candlestick, RSI, MACD, or a confluent S&R level).
- Place the stop loss just beyond the 78.6% level. If price breaks that, your swing is invalidated.
What is Fibonacci? The math behind the levels
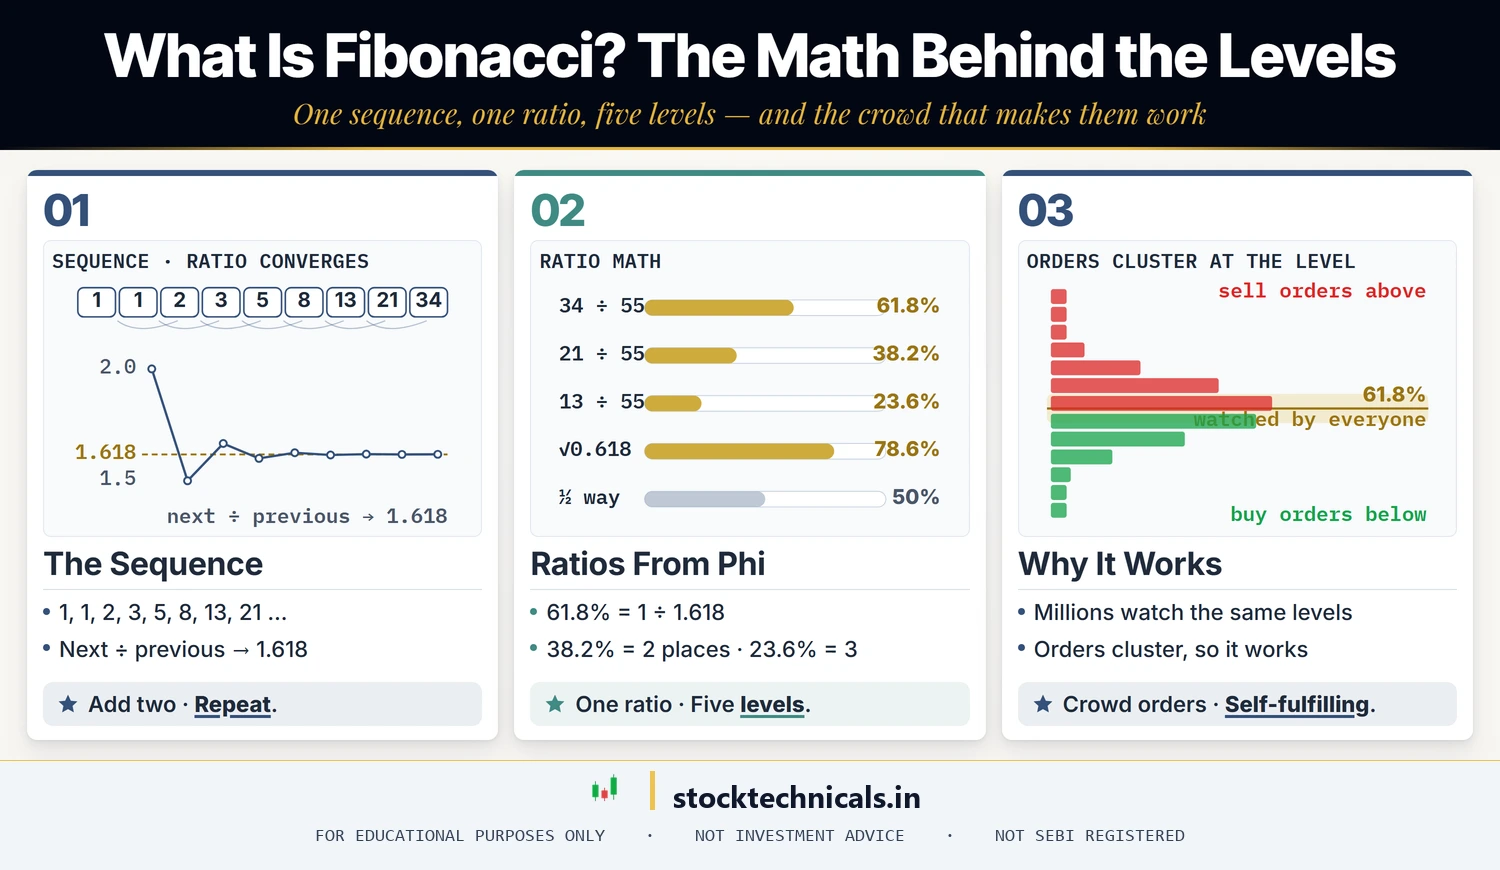
The Fibonacci sequence is a series where each number equals the sum of the two before it:
1, 1, 2, 3, 5, 8, 13, 21, 34, 55, 89, 144, 233, 377 …
Divide each number in the sequence by the one before it and, as the numbers grow, the result converges on 1.618 — the Golden Ratio (phi). Every retracement ratio below except 50% is derived from phi:
- 0.236 → a number divided by the one three places higher in the sequence (e.g. 13 ÷ 55)
- 0.382 → two places higher
- 0.618 → one place higher (the inverse of 1.618)
- 0.786 → square root of 0.618
- 0.500 → not a true Fibonacci ratio, but included because traders watch the halfway point
Why do markets respect these numbers? The honest answer is mostly reflexivity. Millions of traders worldwide are watching the same levels at the same time, so buy and sell orders cluster there. Over time, the clustering reinforces itself: the level works because people expect it to work.
The five key retracement levels and what each one signals

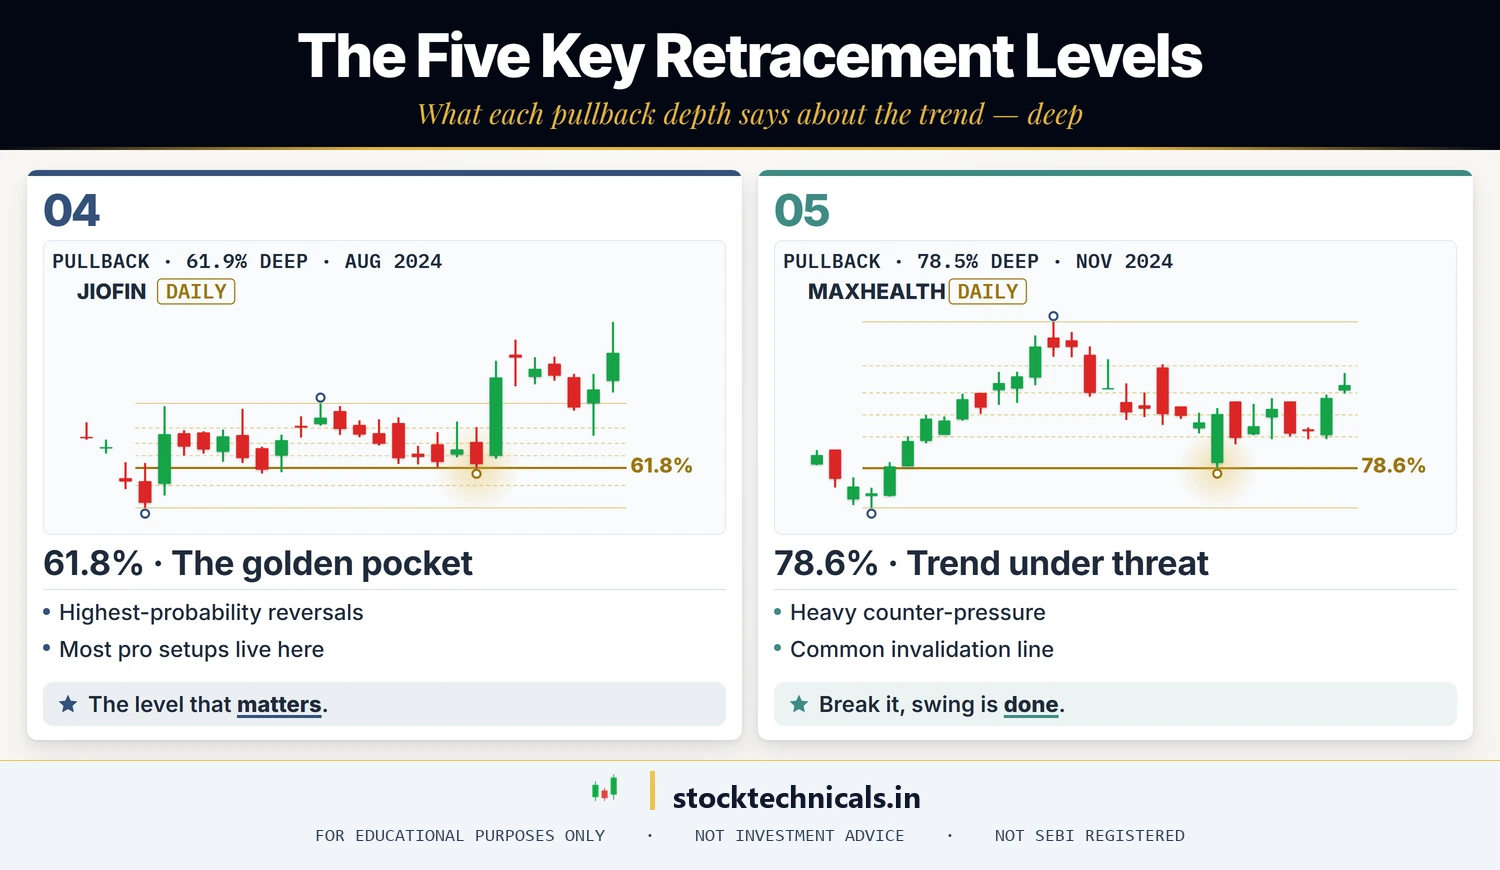
When you drop a Fibonacci tool on a completed swing, five horizontal levels appear. Each one carries a different meaning about how strong the original trend is.
23.6% — shallow pullback, strong momentum
A retracement that stops at 23.6% tells you the trend is firmly in control. Sellers barely got a foot in. The next leg tends to be aggressive. Too shallow for most swing traders — scalpers and intraday traders use it for tight-stop entries in powerful trends.
38.2% — healthy, breathing-space pullback
38.2% is the first level most swing traders take seriously. It represents a controlled correction where bulls let bears have a turn but then defend. Common in Nifty 50 during steady bull phases.
50% — the equilibrium midpoint
Not technically a Fibonacci ratio, but traders include it because a midpoint pullback is a psychological battleground. In choppy, non-trending markets 50% is often where reversals happen. In strong trends, 50% frequently acts as a short stop on the way to 61.8%.
61.8% — the golden pocket
This is the level that matters most. A pullback that reaches 61.8% is deep enough to flush weak hands but still leaves the original trend mathematically intact. It is the level most traders watch, which is why reversals in strong trends often start here. Act on it only with a second confirmation. Many Fibonacci traders build their setups around 61.8%.
78.6% — deep pullback, trend under threat
A retracement to 78.6% means selling (or buying) pressure was heavy. The trend is still technically valid but wobbling. Many traders use this level as the invalidation line — if price slices through 78.6%, the swing is done and a new trend probably needs to be mapped. Reversals here can be violent when they work but are less reliable than 61.8%.
How to draw Fibonacci retracement on your chart
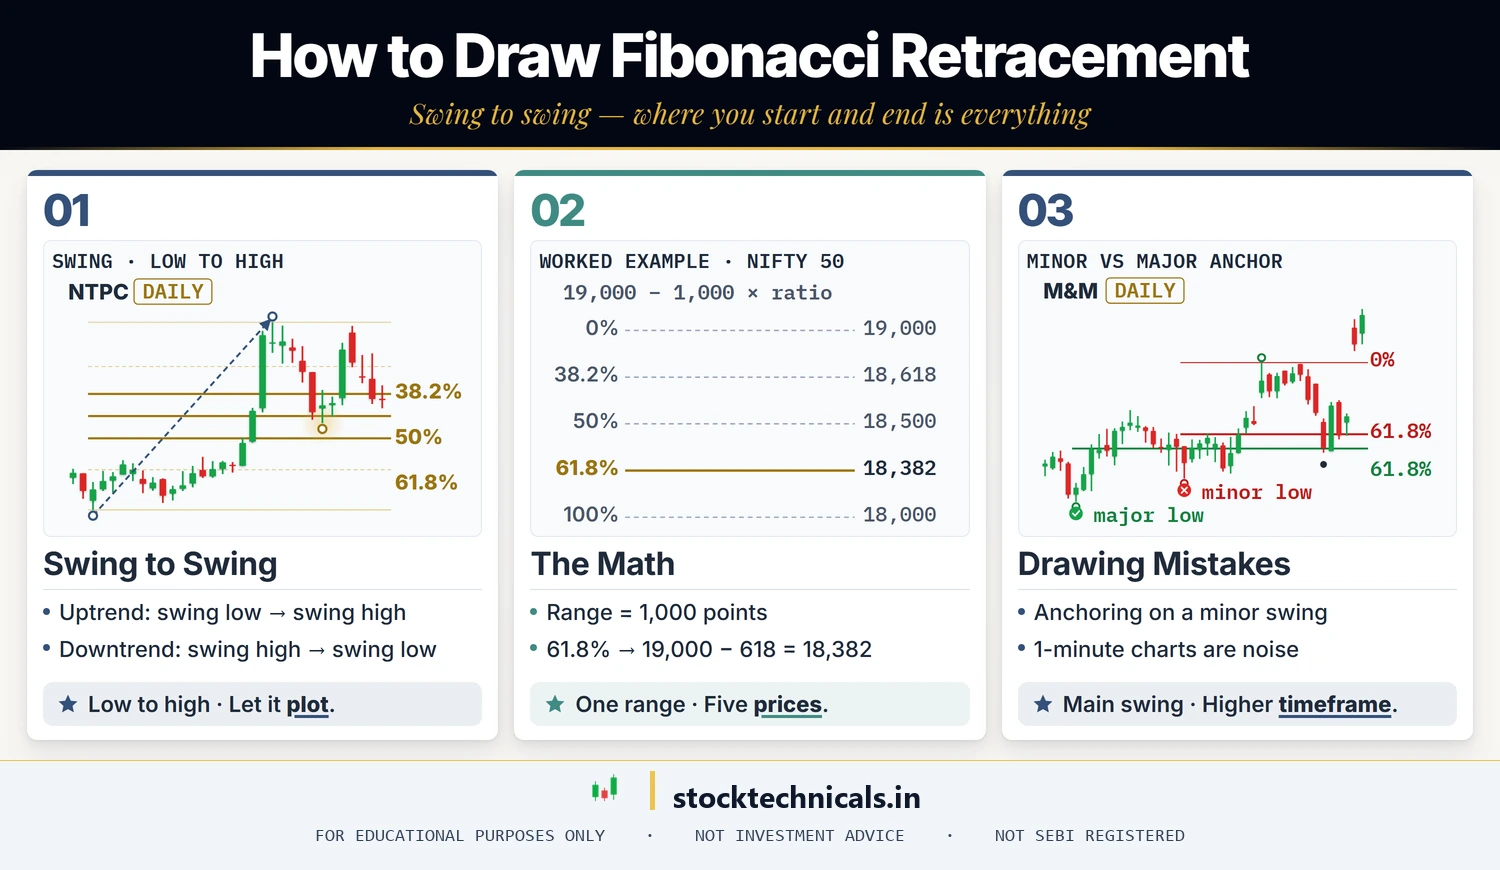
The mechanics are simple. Where you start and end is everything.
The rule: swing to swing
Uptrend — draw from the swing low (lowest point) up to the swing high. The tool plots the retracement levels back down.
Downtrend — draw from the swing high down to the swing low. Levels plot upward for the bounce.
Worked example: Nifty 50 uptrend
Imagine Nifty 50 swings from 18,000 (swing low) up to 19,000 (swing high). That’s a 1,000-point move. The retracement levels would be:
- 23.6%: 19,000 − (1,000 × 0.236) = 18,764
- 38.2%: 19,000 − (1,000 × 0.382) = 18,618
- 50%: 19,000 − (1,000 × 0.500) = 18,500
- 61.8%: 19,000 − (1,000 × 0.618) = 18,382
- 78.6%: 19,000 − (1,000 × 0.786) = 18,214
If Nifty pulls back to 18,382 and prints a bullish candle with rising volume, that is a textbook golden-pocket entry. These are illustrative round numbers to show the math — your real trades will use whatever swing is on your chart right now.
Common mistakes when drawing the tool
- Anchoring on a minor swing — Anchor on the main swing’s high and low, not a small pullback inside it. Wick to wick or close to close both work; pick one and use it every time.
- Wrong timeframe — 1-minute Fibonacci is basically noise. Start at 15-minute for intraday, daily for swing trades. The higher the timeframe, the louder the level.
- Drawing Fibs on every swing — Pick the most recent, clearly completed swing. More lines ≠ more signals; more lines = more confusion.
Fibonacci in uptrends: buying the dip
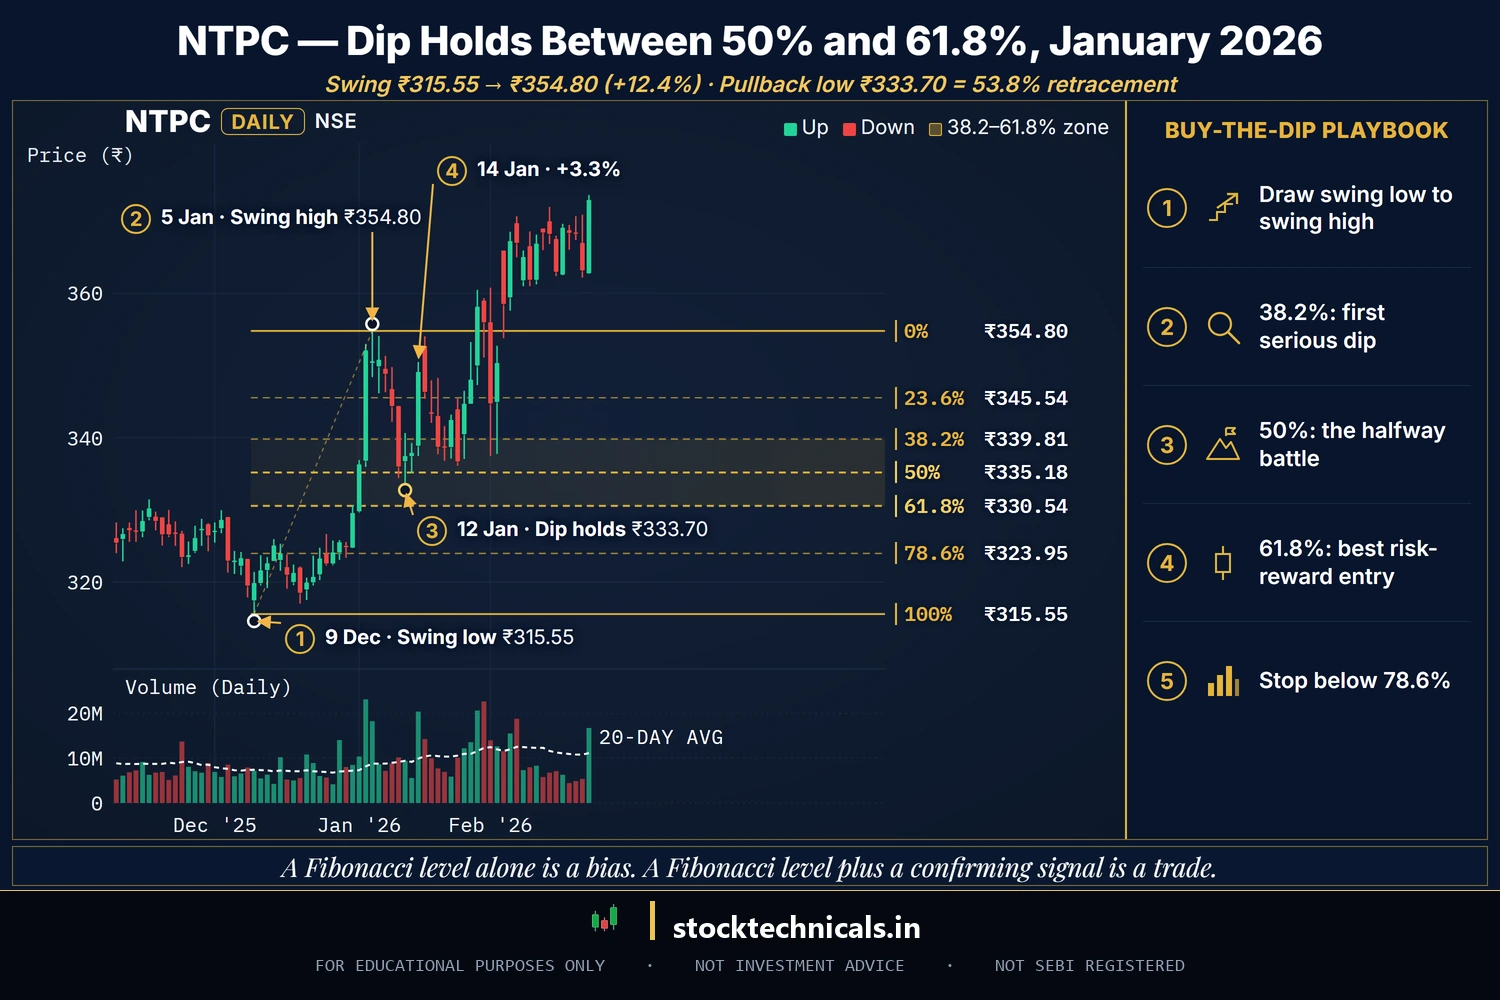
Chart window: Nov 2025–Feb 2026 · Data refreshed 10 Apr 2026 · Source: NSE (daily OHLC)
In an uptrend, Fibonacci levels are dip-buying zones. Price rallies, pulls back to a level, and — if the trend is healthy — resumes higher. The common playbook:
- 38.2% — first serious dip; aggressive buyers step in
- 50% — halfway battle; momentum traders reassess
- 61.8% — deep flush; the best risk-reward entries cluster here
Large-cap worked example
Suppose a large-cap stock runs from ₹2,500 up to ₹2,700 — a ₹200 move. Your retracement map:
- 23.6%: ₹2,652.80
- 38.2%: ₹2,623.60
- 50%: ₹2,600.00
- 61.8%: ₹2,576.40 (golden pocket)
- 78.6%: ₹2,542.80 (invalidation)
Setup: price drifts down to ₹2,576, RSI dips into the 35–40 zone and curls back up, a hammer prints on rising volume. Trade: buy at ₹2,576, stop-loss ₹2,542 (below 78.6%), first target ₹2,700 (previous high). Risk per share ~₹34, reward ~₹124 — clean 1:3.6 risk-reward before costs.
Fibonacci in downtrends: shorting the bounce
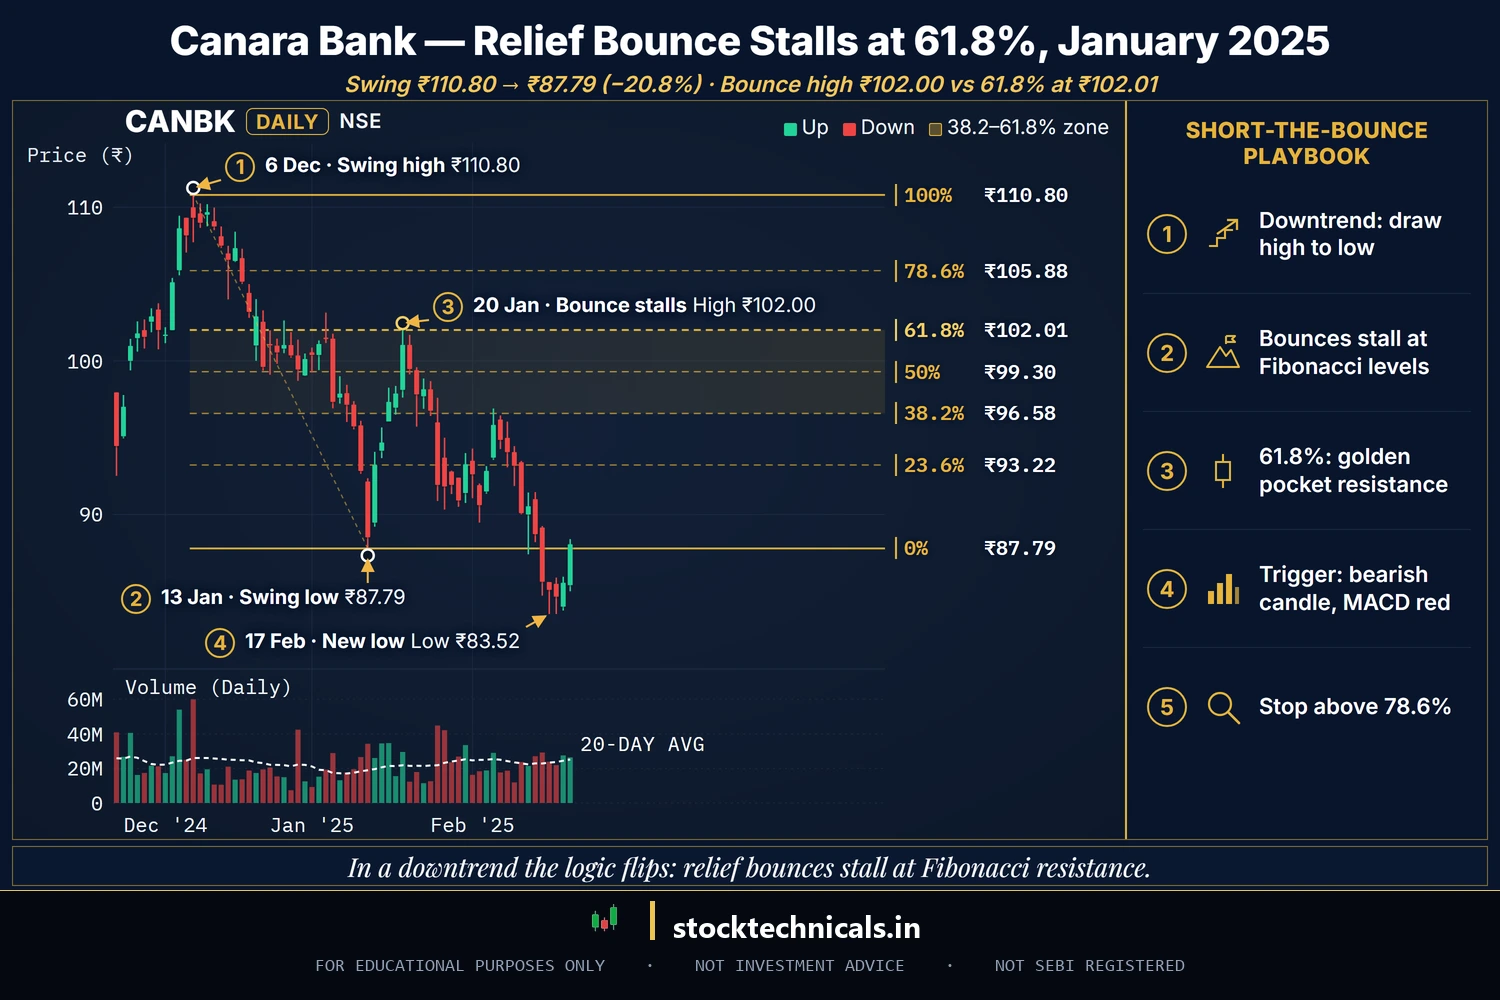
Chart window: Nov 2024–Feb 2025 · Data refreshed 10 Apr 2026 · Source: NSE (daily OHLC)
In a downtrend the logic flips. Rallies inside a downtrend (“relief bounces”) run out of steam at Fibonacci resistance, and sellers re-engage.
Bank Nifty-style worked example
Suppose Bank Nifty falls from 45,000 down to 43,000 — a 2,000-point drop (illustrative round numbers, not a historical move). Retracement map for the bounce:
- 23.6%: 43,472
- 38.2%: 43,764
- 50%: 44,000
- 61.8%: 44,236 (golden pocket resistance)
- 78.6%: 44,572 (invalidation)
Setup: the bounce runs into 44,236, MACD histogram rolls red, a shooting star prints on weak volume. Trade: short at 44,236, stop-loss 44,572 (above 78.6%), first target 43,000. Risk 336 points, reward 1,236 points — 1:3.7.
The golden pocket: why 61.8% is the level that matters
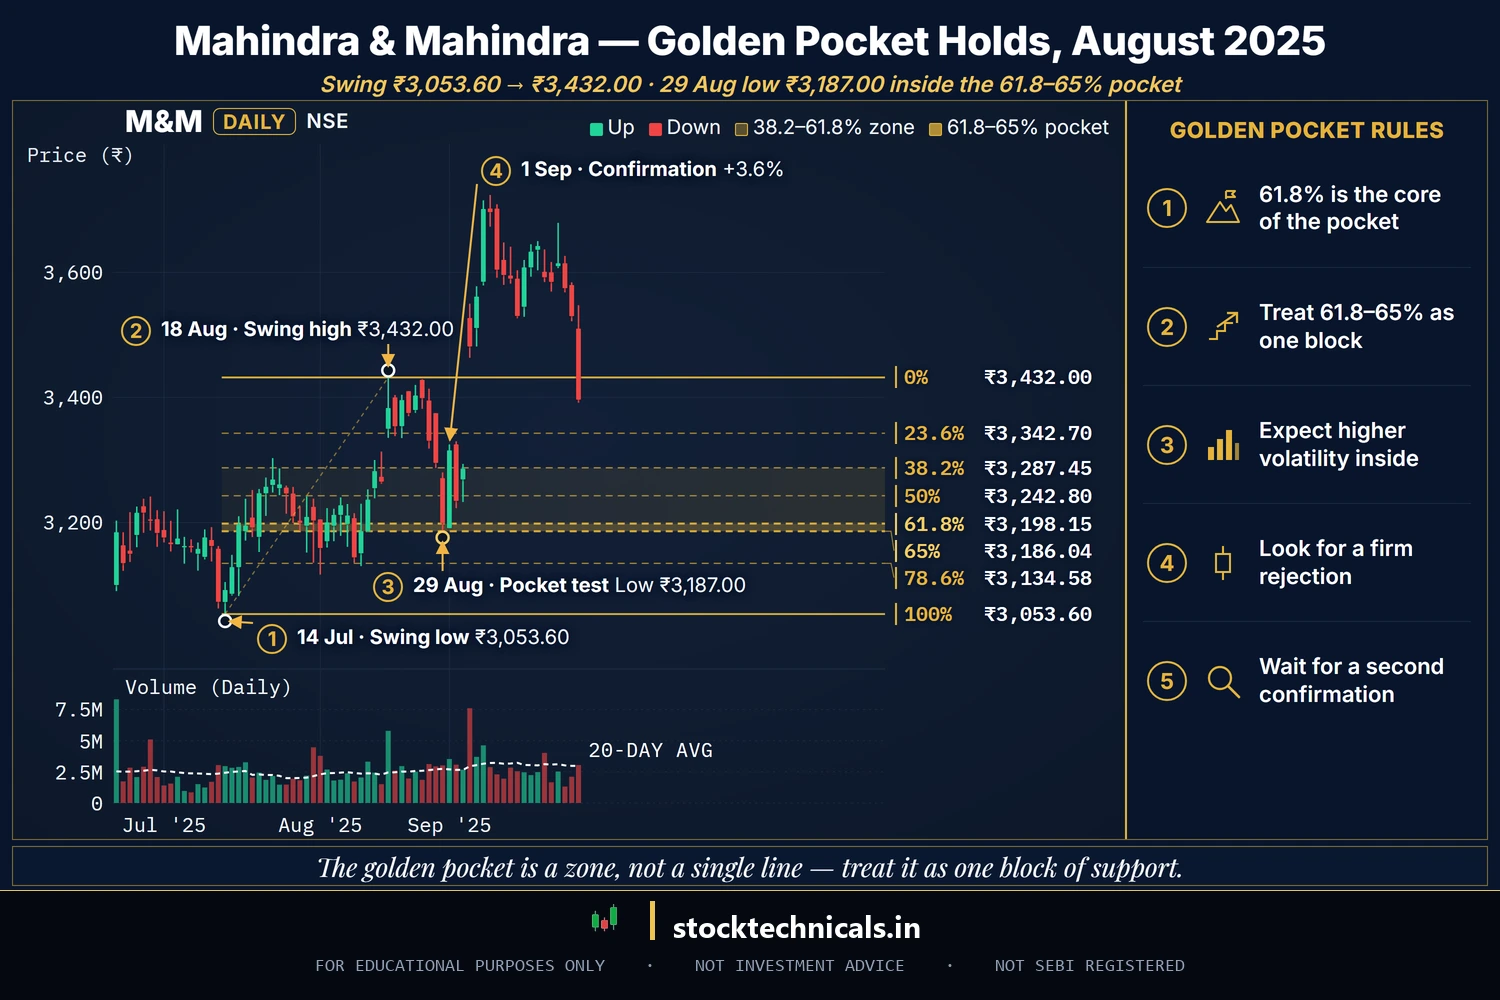
Chart window: Jun 2025–Sep 2025 · Data refreshed 10 Apr 2026 · Source: NSE (daily OHLC)
The 61.8% retracement earns its “golden pocket” nickname for four stacking reasons:
- Direct from the Golden Ratio. 0.618 is the reciprocal of phi (1.618). The 23.6%, 38.2% and 78.6% levels come from the same sequence; 50% is the only standard level that does not.
- Most-watched level. 61.8% is widely regarded as the most-watched retracement ratio, so reactions there are often sharper. Treat it as a zone and wait for a second confirmation (candle, oscillator, or confluent S&R).
- Psychological equilibrium. A 61.8% pullback flushes weak hands without invalidating the trend. Traders who survive this depth tend to ride the next leg harder.
- Reflexivity. The whole trading world watches the level, so orders cluster there. Self-fulfilling yes, but powerful.
The golden pocket zone (61.8% to ~65%)
In practice the golden pocket is a zone, not a single tick. Price rarely stops exactly on 61.8% — it probes a little, traders use slight variations of the tool (fans, extensions, 66% lines), and rounding spreads the orders. Treat 61.8% to about 65% as one block. Inside that zone expect:
- Aggressive buying on the way down in uptrends
- Aggressive selling on the way up in downtrends
- Higher volatility as both sides fight for control
- A firm rejection when the primary trend is still intact
Fibonacci + support and resistance: the confluence edge
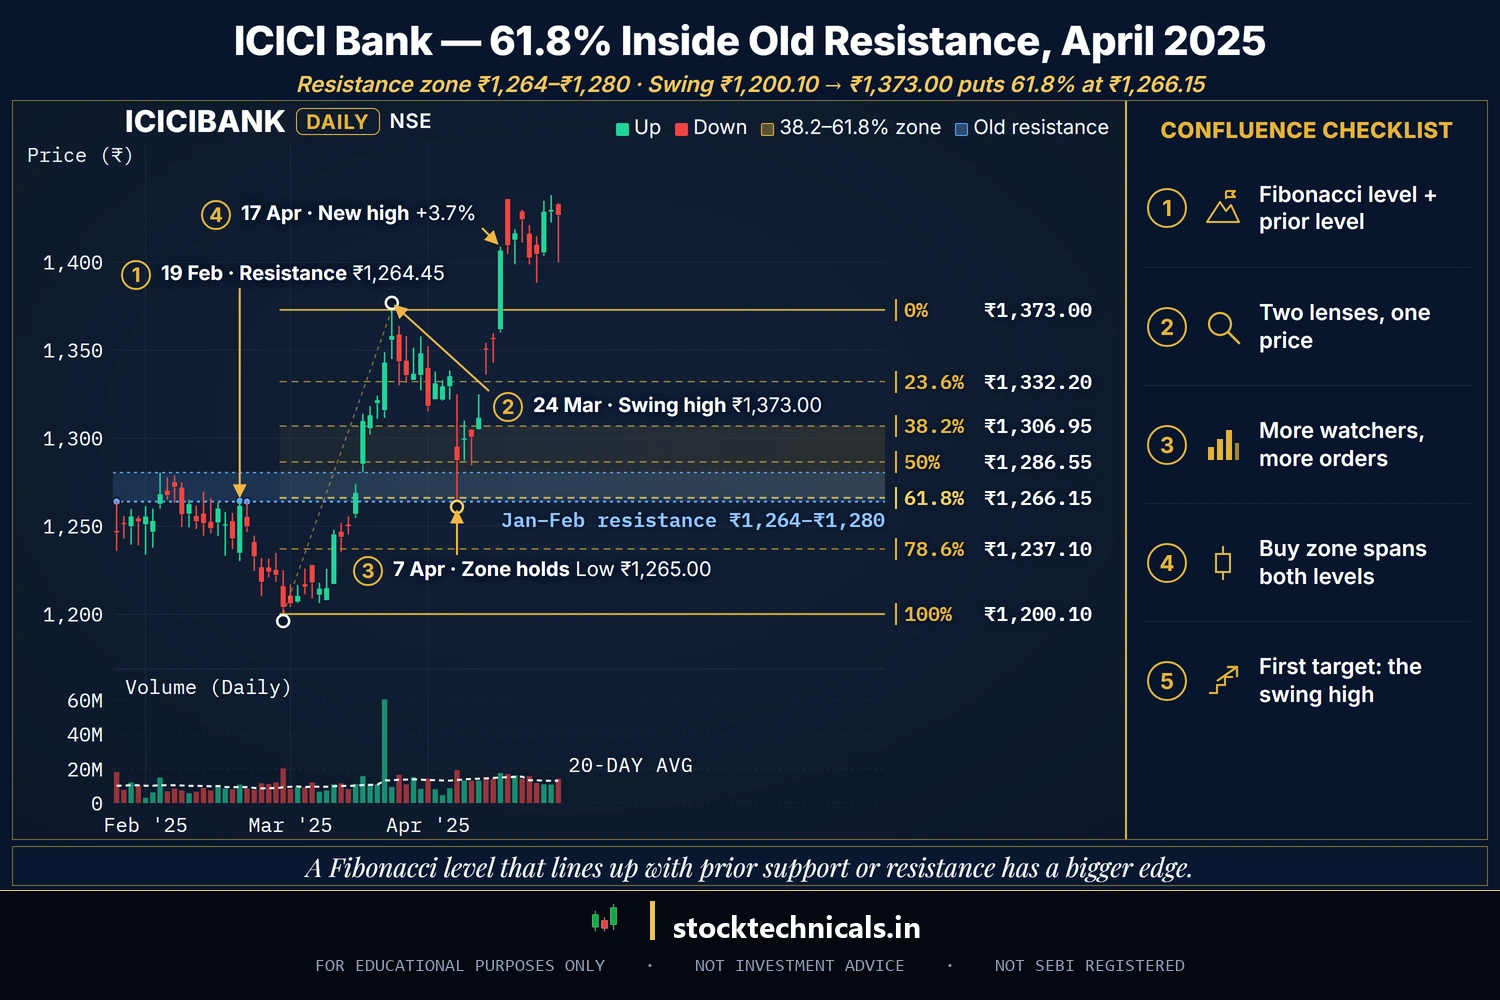
Chart window: Jan 2025–Apr 2025 · Data refreshed 10 Apr 2026 · Source: NSE (daily OHLC)
A standalone Fibonacci level has an edge. A Fibonacci level that lines up with a prior horizontal support or resistance has a bigger edge. That alignment is called confluence, and it is the single most reliable upgrade you can make to any Fibonacci trade.
Why confluence works: two independent lenses are agreeing on the same price. More traders are watching, more orders cluster, and the rejection is louder when it happens.
Example. Suppose Nifty 50 swings from 18,000 to 19,500 (illustrative numbers). The 61.8% retracement maths out to 18,573. You also know — from the daily chart — that Nifty bounced sharply off 18,560 two weeks earlier. The Fibonacci level and the prior horizontal support overlap within 15 points. That overlap is confluence. Two independent levels agreeing gives you a stronger reason to act than either level alone.
Your trade plan writes itself: buy zone 18,560–18,580, stop below 18,500 (below both the Fibonacci and the horizontal), first target back at 19,500.
How to set up Fibonacci on TradingView and Zerodha Kite
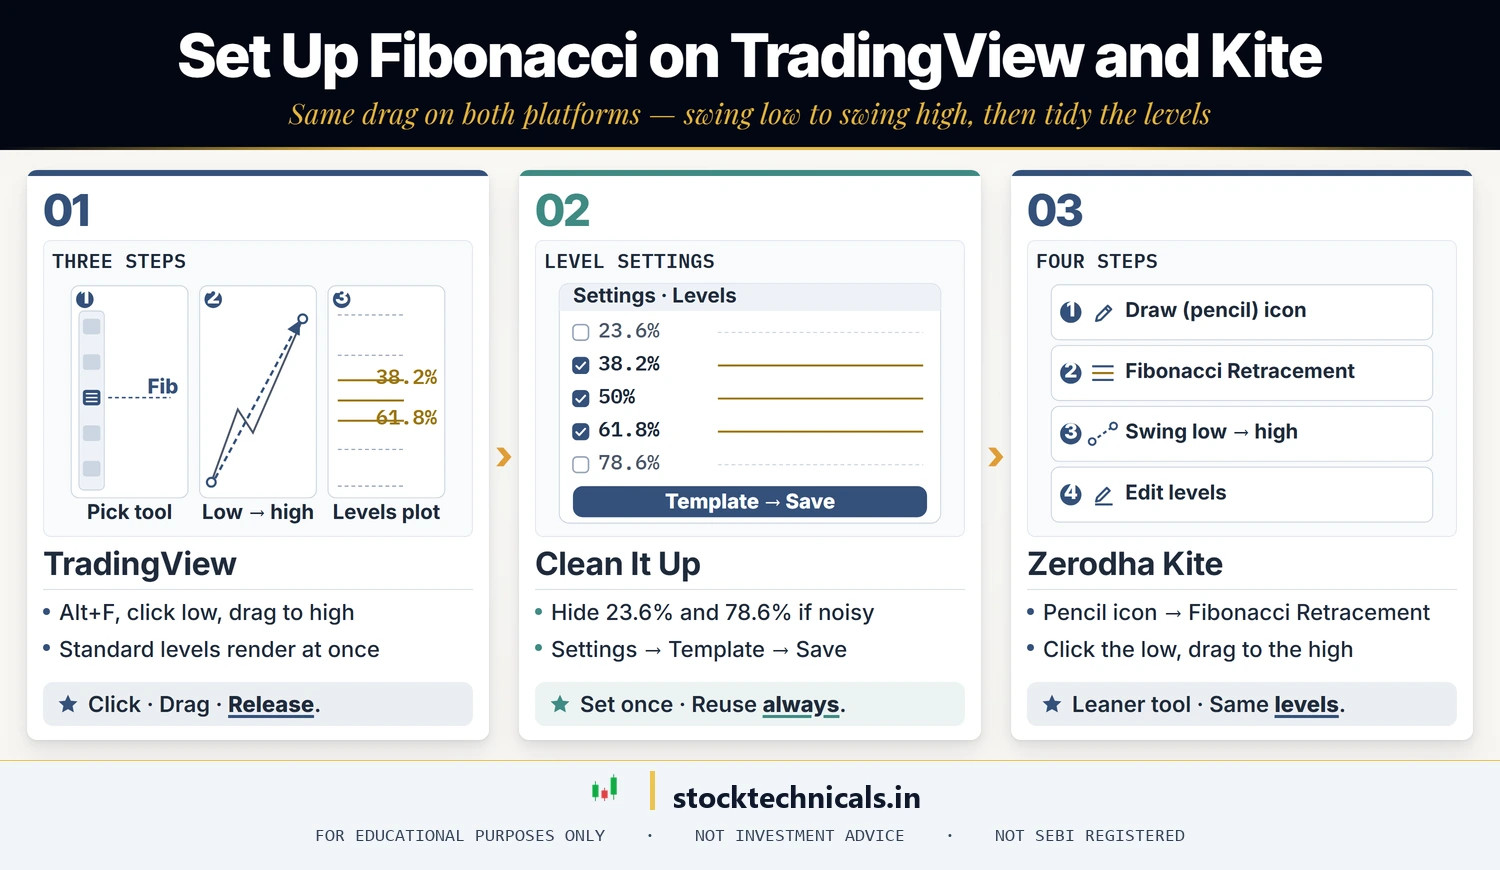
TradingView (desktop & mobile)
- Open the chart. Click the Fibonacci Retracement tool from the left drawing toolbar (shortcut:
Alt+F). - For an uptrend: click the swing low, drag to the swing high. Release.
- The five standard levels render automatically.
- Right-click the drawing → Settings. Trim the levels you don’t trade (hide 23.6% and 78.6% if you find them noisy), change colour to something readable against a dark chart, set line width to 1–2 pixels.
- In the same Settings dialog, open the Template menu and save your style as a template, so you can apply the same look to every new Fibonacci drawing.
If you’re serious about charting on TradingView, the paid plans add more charts per tab, more active alerts, and more indicators per chart than the free Basic plan.
Zerodha Kite (web & mobile)
- Open the chart in Kite. On the default ChartIQ chart, click the Draw (pencil) icon; on the Kite app, tap the pencil icon and then Select Tool. If you have switched Kite to TradingView charts, use the Fibonacci tool on the left drawing toolbar instead.
- Select Fibonacci Retracement.
- Click the swing low, drag to the swing high (or reverse for a downtrend).
- All five levels appear with default styling. Tap-and-hold (mobile) or right-click (web) on the drawing → Edit to toggle visibility and colours.
Kite’s tool is leaner than TradingView’s but is enough for swing-trade-grade work. Many Indian beginners start here.
Combining Fibonacci with other tools
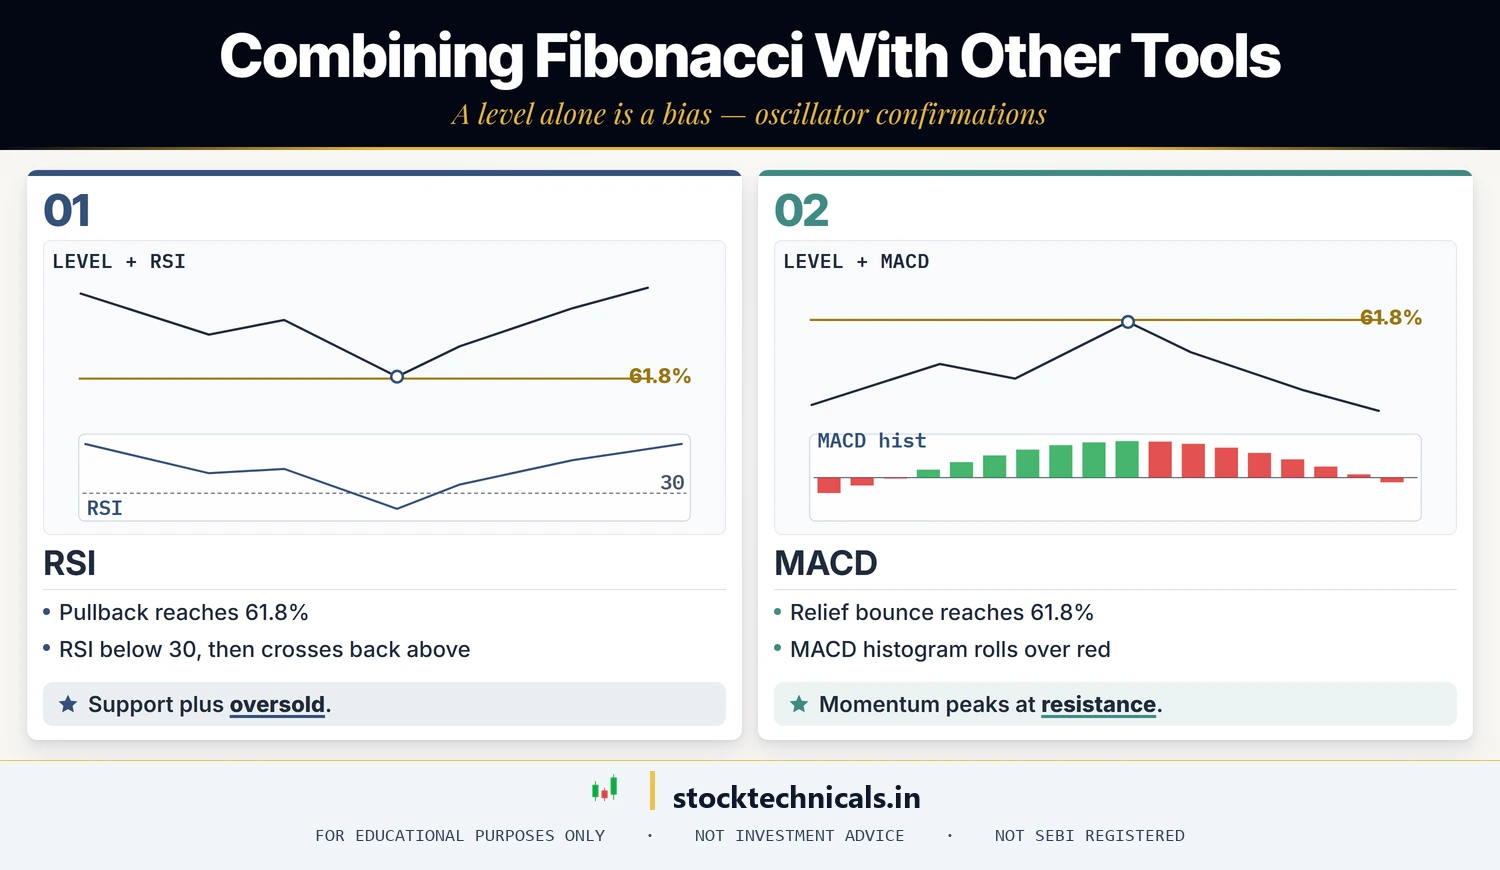
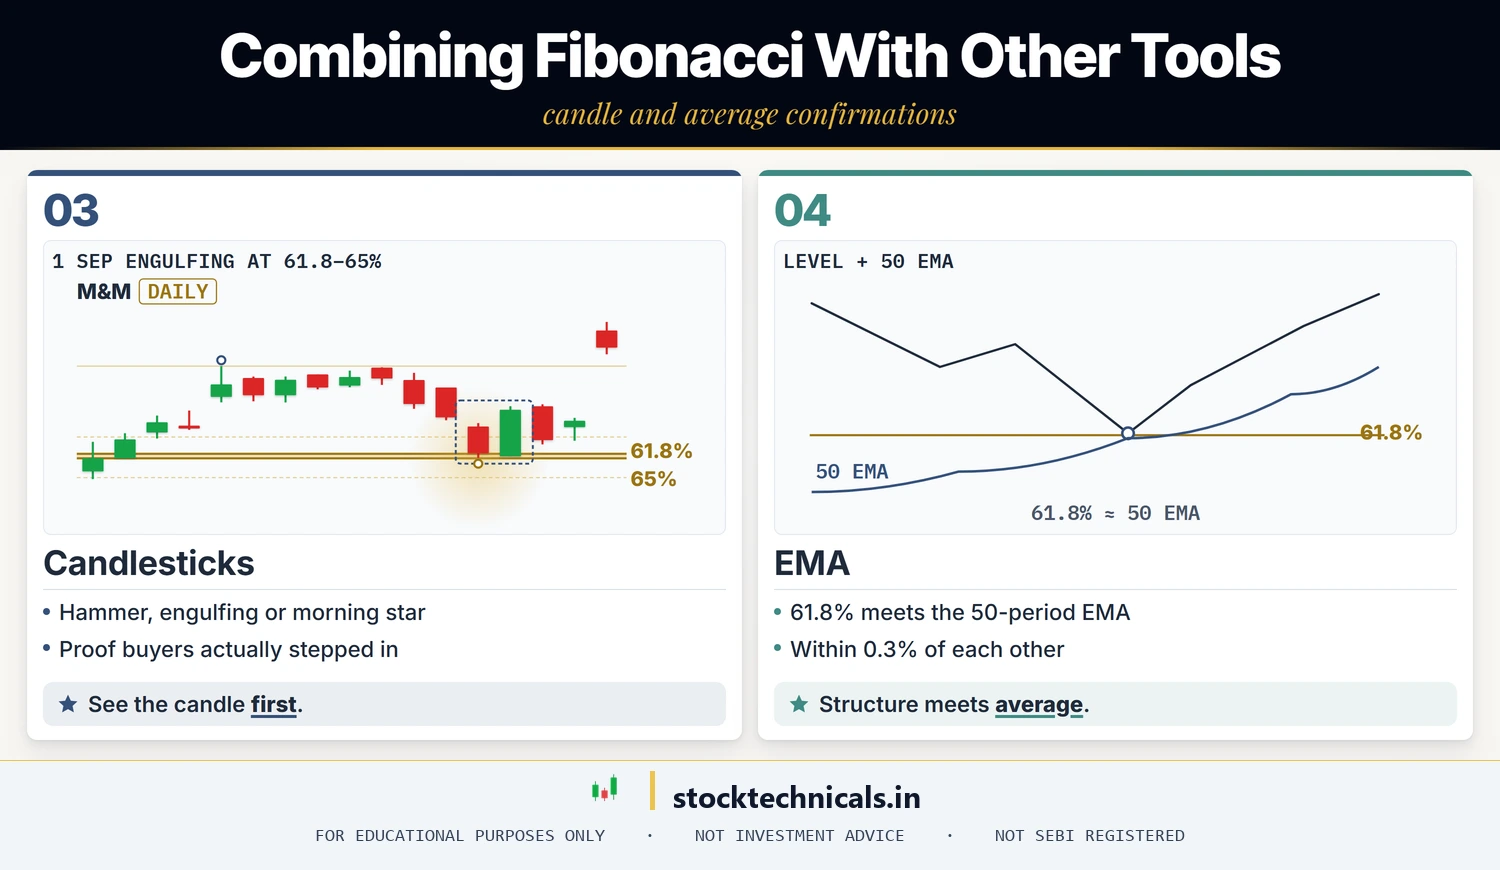
A Fibonacci level alone is a bias. A Fibonacci level plus a confirming signal is a trade. Here are the four stack-ups that add the most edge:
Fibonacci + RSI — the oversold bounce
Price pulls back to 61.8% and RSI is below 30 (see RSI Basics). The level says “support,” RSI says “oversold.” Enter when a bullish candle closes above the level and RSI crosses back above 30.
Fibonacci + MACD — bounce exhaustion in a downtrend
Relief bounce reaches 61.8% and the MACD histogram rolls over red (see MACD Basics). Momentum is peaking as resistance caps price — a higher-probability short than either signal alone.
Fibonacci + candlestick patterns — visual confirmation
61.8% plus a hammer, bullish engulfing, or morning star tells you buyers actually stepped in. Without a candle confirmation you are betting on a level; with one, you are responding to behaviour.
Fibonacci + EMA — trend alignment
When the 61.8% retracement and the 50-period EMA land within 0.3% of each other, you have a mechanical-plus-structural agreement (see EMA Basics). These setups are rare but unusually clean when they show up.
Five rules for trading Fibonacci retracements
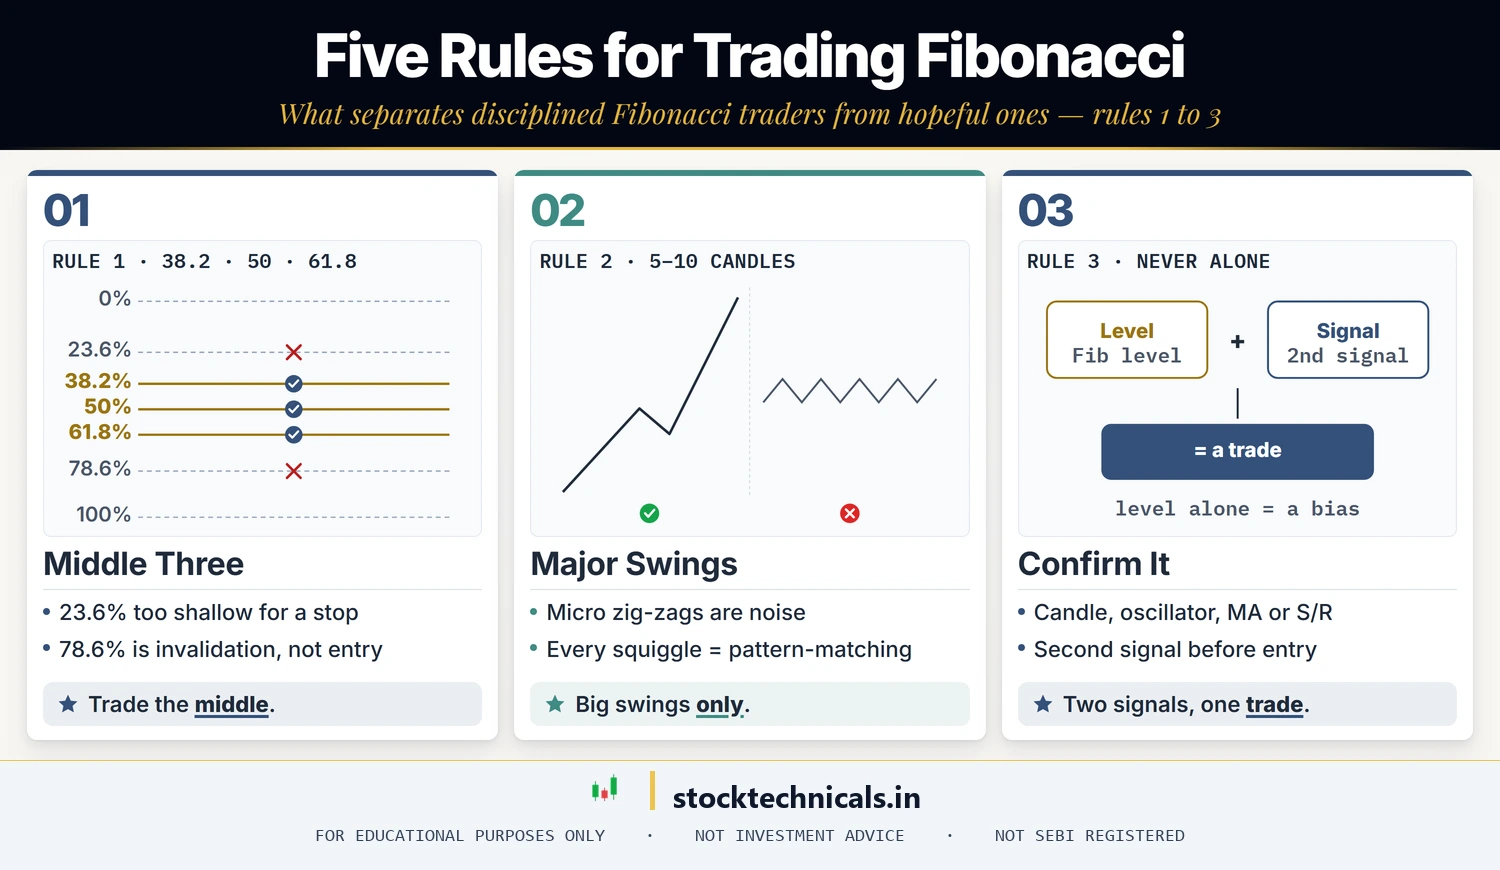

Trade the middle three levels
23.6% is too shallow to trade with a sensible stop. 78.6% is the invalidation line, not an entry. Anchor your trading to 38.2%, 50%, and especially 61.8%.
Only draw from major swings
A “major” swing has at least 5–10 candles of clear one-way movement. Micro-zig-zags are noise. If you’re drawing Fibonacci from every squiggle, you’re pattern-matching, not trading.
Always require a second confirmation
Candlestick, oscillator, moving average, or confluent horizontal support. Never enter on a Fibonacci level alone.
Stay on the fifteen-minute timeframe or higher
1-minute and 5-minute Fibonacci is noise-to-signal roulette. Start at 15-minute for intraday, 1-hour or daily for swing. Higher timeframes beat lower ones for reliability every time.
Stop goes beyond 78.6%
In an uptrend, stop-loss below 78.6%. In a downtrend, stop-loss above 78.6%. If price breaks that level, the swing you drew Fibonacci from is no longer valid — accept the small loss and start looking for the next swing.
Pre-trade checklist
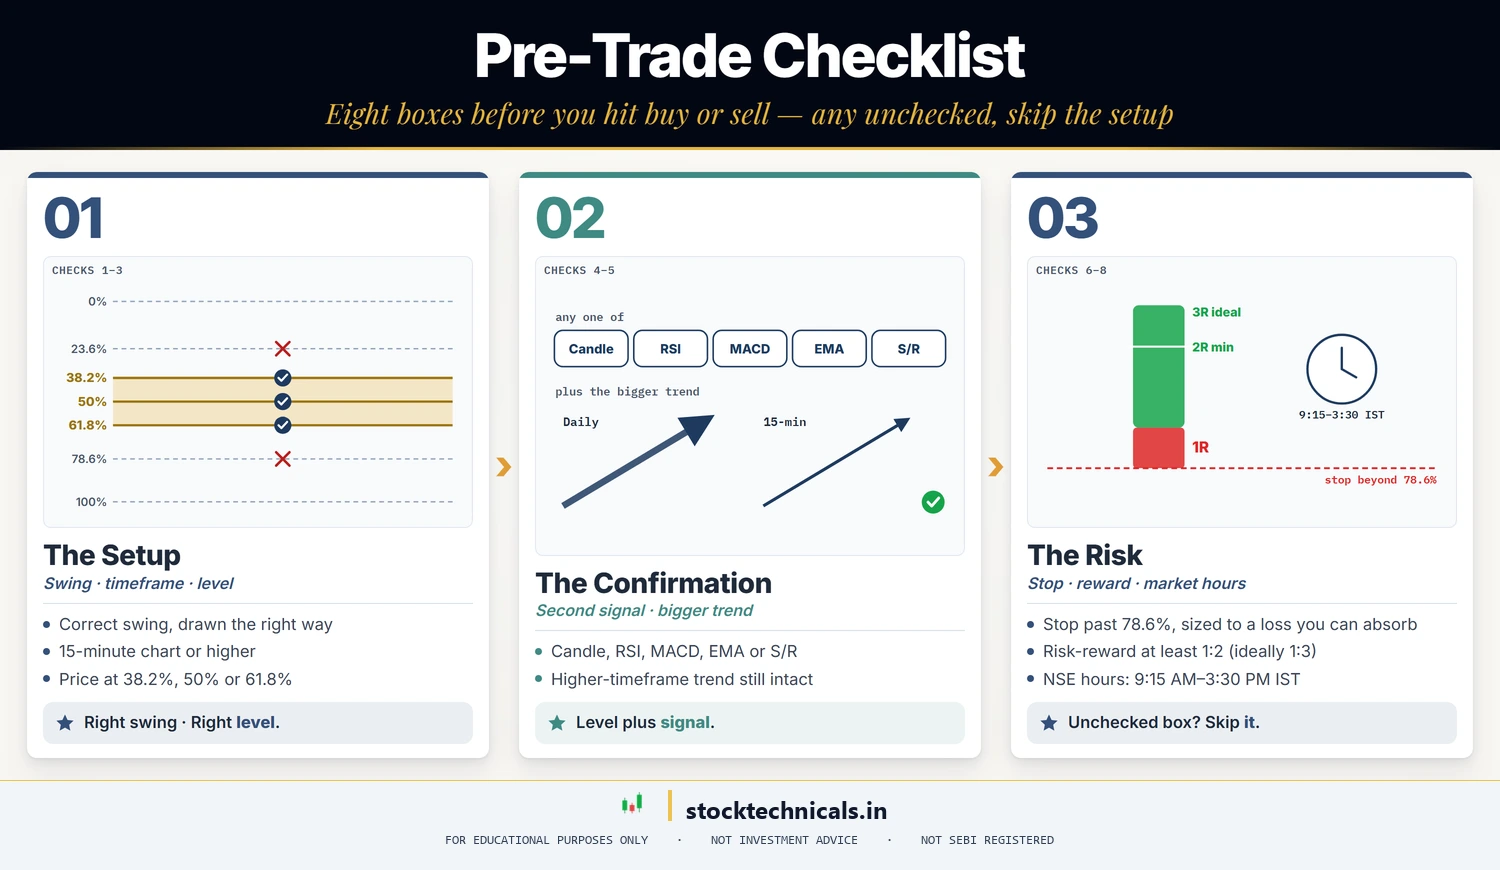
- Am I using the correct swing (swing low to high in an uptrend, reversed for a downtrend)?
- Is my timeframe 15-minute or higher?
- Is price near 38.2%, 50%, or 61.8% — not 23.6% or 78.6%?
- Is there a second confirmation (candle, RSI, MACD, EMA, or confluent S&R)?
- Is the broader trend on the higher timeframe still intact?
- Is my stop-loss beyond 78.6% and sized to a loss I can absorb?
- Is the risk-reward at least 1:2 (ideally 1:3)?
- Am I trading during NSE market hours?
If any box is unchecked, skip the setup. The next one will come.
Five common Fibonacci mistakes
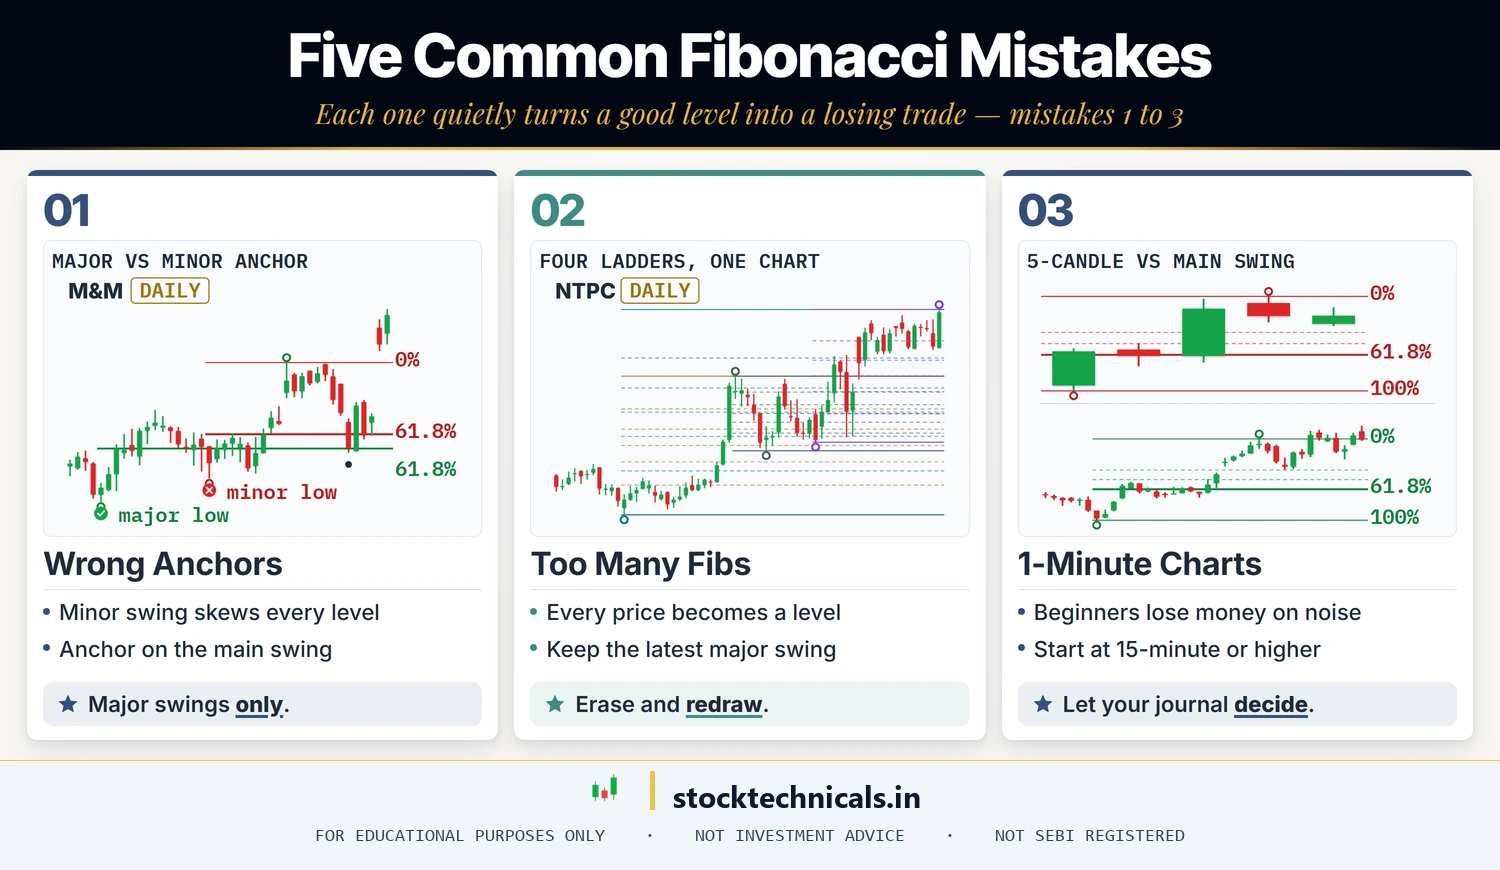
Anchoring on a minor swing
A small pullback inside the move is not the swing. Anchor on the main swing’s highest high and lowest low, using wicks or closes consistently. Anchor on a minor low and every level shifts, so price seems to respect levels nobody else is watching.
Too many Fibonacci drawings on one chart
If every price has a “Fibonacci level,” none of them mean anything. Stick to the most recent major swing. Erase and redraw when the chart moves to a new structure.
Trading Fibonacci on one-minute charts
Short-timeframe Fibonacci is mostly noise, and beginners lose money on it. Start with 15-minute or higher until your journal proves otherwise.
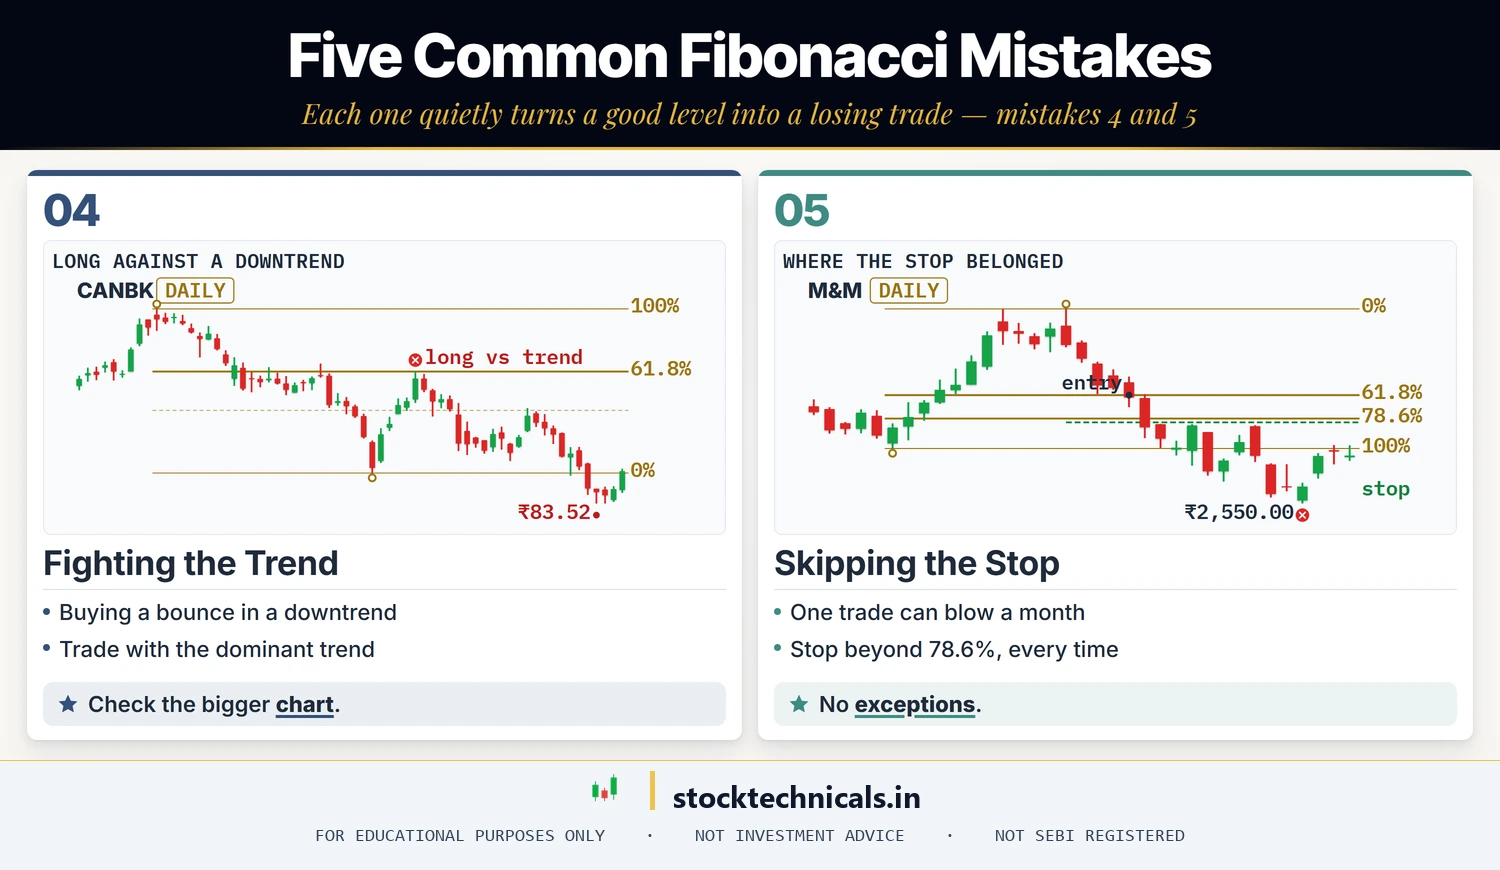
Fighting the higher-timeframe trend
A bullish Fibonacci setup on a 15-minute chart is much less likely to work if the daily chart is in a confirmed downtrend. Check the higher timeframe first. Trade retracements in the direction of the dominant trend.
Skipping the stop-loss because “the setup is perfect”
Fibonacci confluence setups feel so clean that new traders sometimes skip the stop. That’s how one trade blows up a month of wins. Every trade, every time: stop below the 78.6% level. No exceptions.
Retracement vs extension vs fan: which tool when
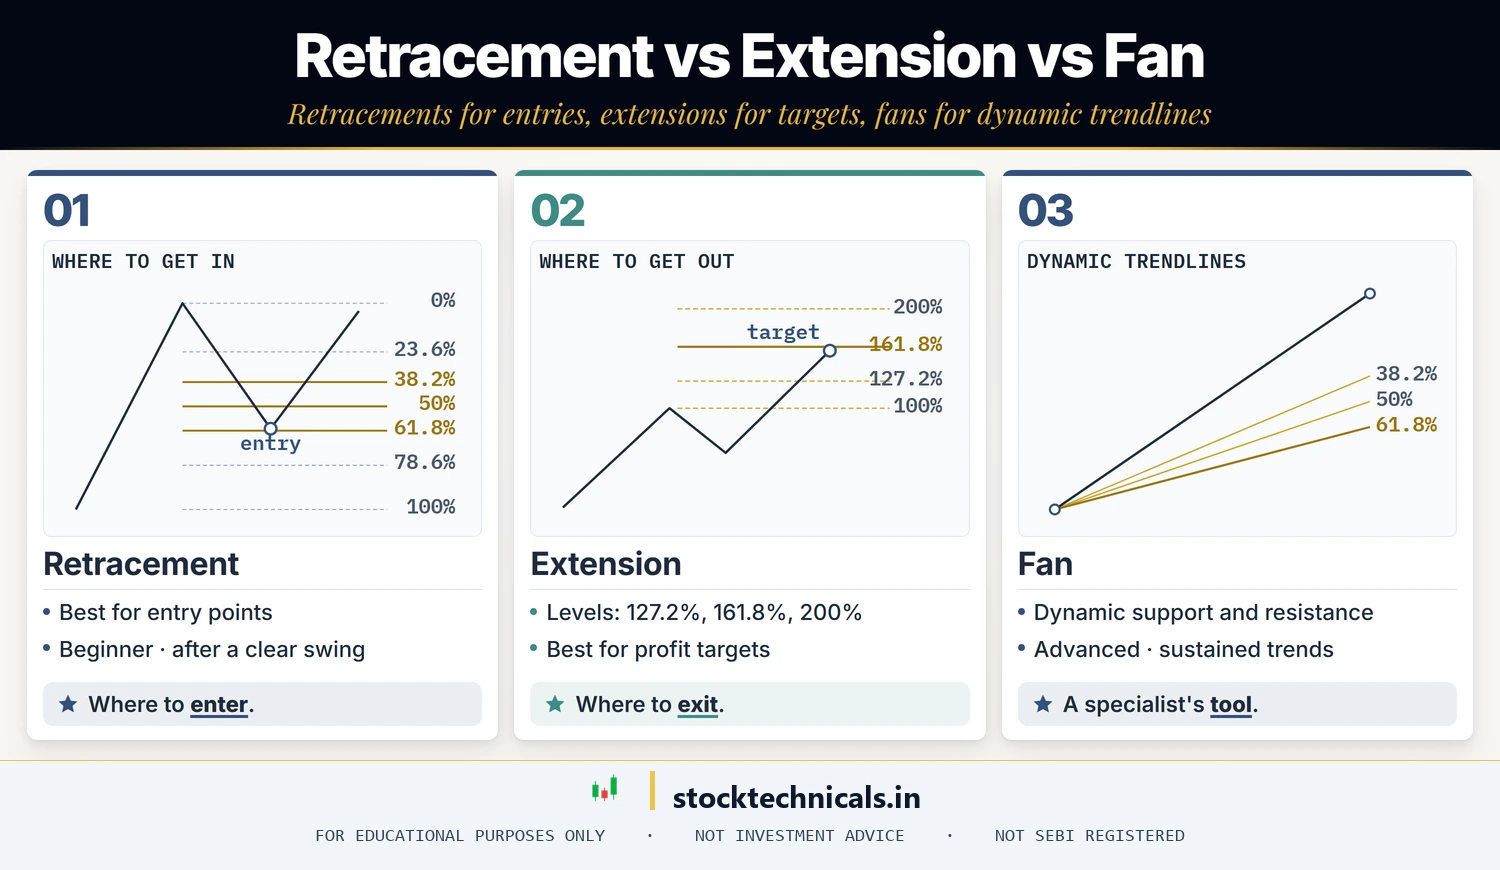
Fibonacci retracements are one of three related tools. Here’s how they compare:
| Feature | Retracement | Extension | Fan |
|---|---|---|---|
| Measures | Pullback depth (23.6–78.6%) | Move beyond the prior high/low (127.2%, 161.8%, 200%) | Diagonal trendlines through Fibonacci levels |
| Best for | Entry points | Profit targets | Dynamic trend support/resistance |
| When | After a clear swing | After a retracement bounce | In sustained trends |
| Difficulty | Beginner | Intermediate | Advanced |
Retracements tell you where to enter. Extensions tell you where to exit. Fans are a specialist’s tool for dynamic levels inside strong trends. Most traders only need the first two — extensions are covered in Fibonacci Extensions: The Complete Trading Guide.
What’s the difference between a Fibonacci retracement and a moving average?
Fibonacci retracements are fixed price levels derived from a specific swing’s high and low. Moving averages are dynamic lines that update with every new candle. Both act as support and resistance, but Fibonacci is sharper for specific entry points, while moving averages are better for reading the direction and strength of the trend itself.
Why does my 61.8% retracement sometimes fail?
Nothing in trading is 100%. The 61.8% level is the most-watched retracement, not a guarantee. It fails when the trend is exhausted or a larger structure is overriding your swing. That’s why the stop-loss below the 78.6% level is not up for debate.
Should I trade the 50% level?
The 50% level is weaker than 61.8% in strong trends but often works in choppy, range-bound markets. In a clean trending tape, skip 50% and wait for the golden pocket. In a sideways tape, 50% can be the cleanest entry of the session.
Can I use Fibonacci on cryptocurrency?
Yes. Crypto markets trade 24/7 and react to the same trader psychology. Fibonacci retracements work on Bitcoin, Ethereum, and other majors. The only adjustment is volatility — crypto overshoots are bigger, so stop sizing matters more.
Is 61.8% the same as the golden pocket?
61.8% is the core of the golden pocket, but the pocket is a zone extending roughly from 61.8% to 65%. Treat it as one support or resistance block rather than a single line — orders don’t cluster on a single tick.
What if price blows through every Fibonacci level?
If price cuts past 78.6% and keeps going, the swing you drew Fibonacci from is invalidated. That’s your cue to wait for a new swing to complete and redraw the tool on fresh structure — don’t keep defending the old setup.
Can I mix Fibonacci timeframes?
Best practice is to keep your Fibonacci and your confirmation tools on the same chart. Mixing — say, drawing Fibonacci on the hourly and checking RSI on the 5-minute — muddies the signal. Pick a timeframe, commit, and use all tools on it.
Test Your Knowledge
Q1: Which Fibonacci level is known as the “golden pocket”?
Q2: You are trading an uptrend. Where should your stop-loss go for a Fibonacci pullback entry?
Q3: Which timeframe is recommended as the minimum for Fibonacci trading?
Q4: Is 50% technically a true Fibonacci ratio?
Q5: You draw Fibonacci on a Nifty 50 chart and the 61.8% level lines up with a horizontal support zone from three weeks ago. What is that overlap called?
Your next step
Retracements tell you where to get in. Fibonacci Extensions tell you where to get out — the 127.2%, 161.8%, and 200% levels that project where a bounce is likely to run to. Read that next, and you’ll have a complete entry-to-exit Fibonacci playbook.
The Bottom Line
Fibonacci retracements aren’t magic — they’re a map of where crowd orders tend to cluster on a completed price swing. Draw them cleanly, respect the 61.8% golden pocket, never trade them alone, and always put your stop beyond the 78.6% invalidation. If you get those four things right, Fibonacci will probably be the single most reliable entry tool in your Technical Analysis toolkit.
Educational content only — not SEBI-registered investment advice. Technical Analysis tools including Fibonacci retracements improve probability, they do not remove loss. Past performance of any level, pattern, or setup does not guarantee future results. Size every trade so a full stop-out costs you less than 1% of capital. Never trade with borrowed money.