
Every candlestick on a price chart tells a complete story about what happened during that time period. The body reveals who won the session — buyers or sellers. The wicks expose the prices that were tested but ultimately rejected. The colour confirms the direction of control.
Quick Answer: Every candlestick has four components — open, high, low, close — which form a body and two wicks. The body reveals who won the session; the upper wick shows where sellers pushed price back down; the lower wick shows where buyers pushed price back up. On an NSE daily chart of Reliance or the Nifty 50, reading these four prices together tells a trader whether the session ended in conviction, indecision, or exhaustion — information a closing price alone can never give.
Published January 17, 2026 · Last refreshed April 27, 2026. Prices and data are compiled with reasonable care — always confirm against your broker before trading.
Most traders glance at candles and move on. The ones who consistently extract profits stop and read them like a mechanic reads an engine diagnostic — checking every component for signals that others miss.
This article breaks down every part of a candlestick, from the OPEN price to the CLOSE, from the body to the wicks, with real NSE examples using actual rupee values from real NSE price action. By the end, reading a single candle will feel like reading a sentence in a language traders have always known.
Key Takeaways
- Every candlestick contains exactly four prices: Open, High, Low, and Close
- The Close is the most important price — it determines candle colour and feeds into every indicator calculation
- The body (Open-to-Close range) shows session conviction; larger bodies mean stronger conviction
- Wicks show rejected prices — long wicks signal that one side tried and failed to hold those levels
- Body percentage above 70% signals decisive control; below 20% signals indecision
- Candle colour reflects ONLY the Open vs Close relationship within that candle, NOT whether the stock is up or down from the previous day
- Special shapes (Doji, Marubozu, Hammer, Shooting Star) emerge from extreme OHLC relationships
- Context determines meaning — the same candle shape signals different things depending on where it appears in a trend
- Always read the actual OHLC numbers on your trading platform, not just the visual appearance
- Candle reading is a skill that improves with deliberate practice — decode 10-20 candles daily on live charts
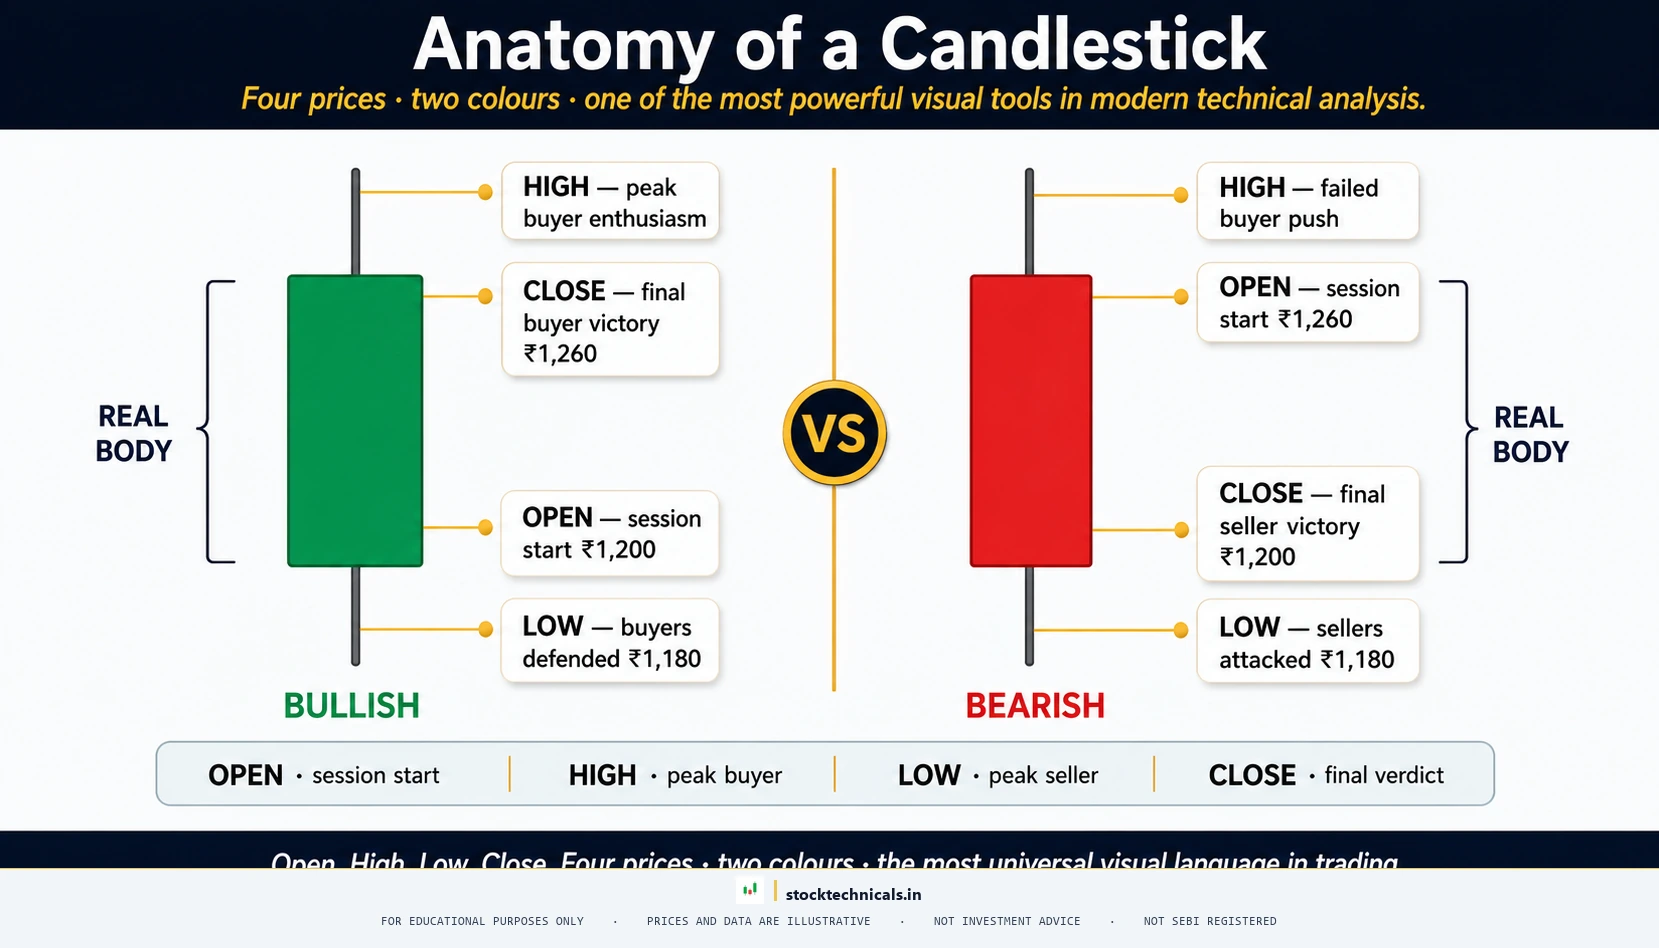
What Do Open, High, Low, Close Actually Mean?
Every candlestick contains exactly four data points. These are the only four prices needed to construct the entire candle:
- OPEN — the first traded price when the candle’s time period begins
- HIGH — the highest price reached during the entire time period
- LOW — the lowest price reached during the entire time period
- CLOSE — the last traded price when the candle’s time period ends
On a daily chart, these represent the first trade at 9:15 AM IST, the peak during the day, the trough during the day, and the last trade at 3:30 PM IST.
On a 5-minute chart, each candle captures these same four prices — but compressed into just 5 minutes of market action.
| Component | Price | Role |
|---|---|---|
| Open | ₹ 758.55 | First trade of the day |
| High | ₹ 765.00 | Peak buyer enthusiasm |
| Low | ₹ 754.75 | Deepest seller push |
| Close | ₹ 762.60 | Final consensus price |
The body (₹ 762.60 minus ₹ 758.55 = ₹ 4.05) covers 39.5% of the total range (₹ 10.25). The upper wick of ₹ 2.40 and lower wick of ₹ 3.80 are both visible — making this candle ideal for understanding how all four components interact. The green colour (Close above Open) confirms buyers won the session, but the wicks show both sides tested their limits before settling.
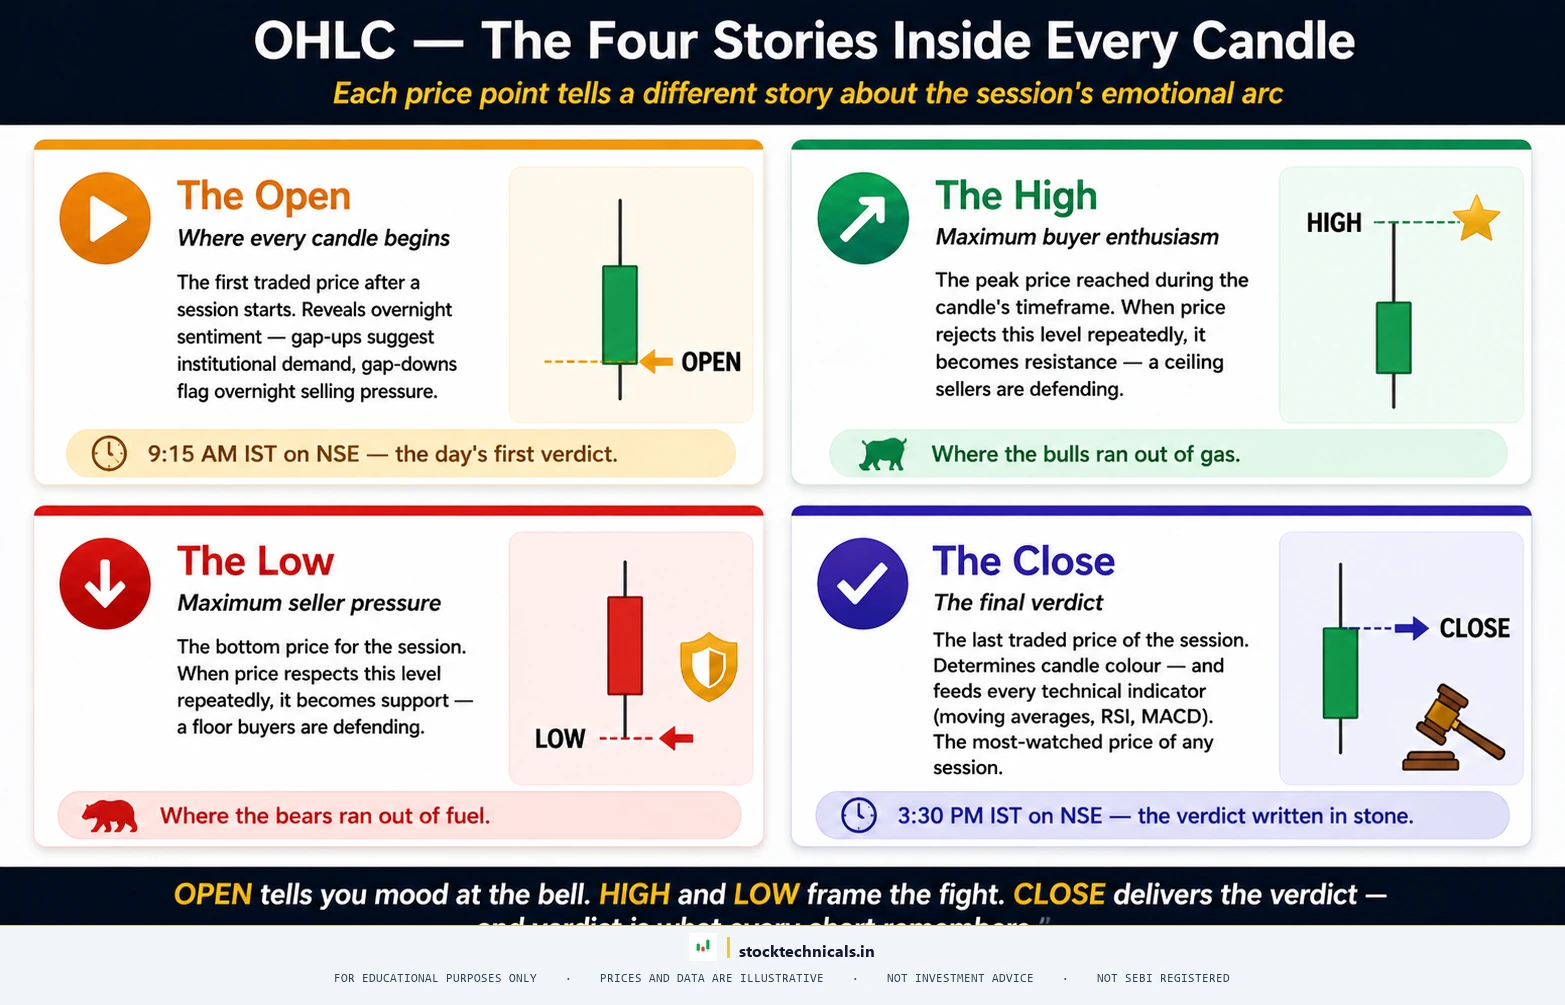
The Open: Where Every Candle Begins
The OPEN is the first traded price when a new candle starts forming. On a daily chart, this is the price at which the very first order executes at 9:15 AM IST on NSE.
Why the Open matters:
The Open tells traders where market participants decided to start the day relative to yesterday’s close. Three scenarios play out:
Gap Up Open — When the Open is higher than the previous candle’s Close. This means overnight demand pushed prices higher before the market even opened. On February 3, 2026, Reliance Industries (NSE: RELIANCE) gapped up from a previous close of ₹ 1,390.40 to an Open of ₹ 1,473.90 — a ₹ 83.50 premium (6.01%). Buyers were willing to pay significantly more just to get in at the opening bell.
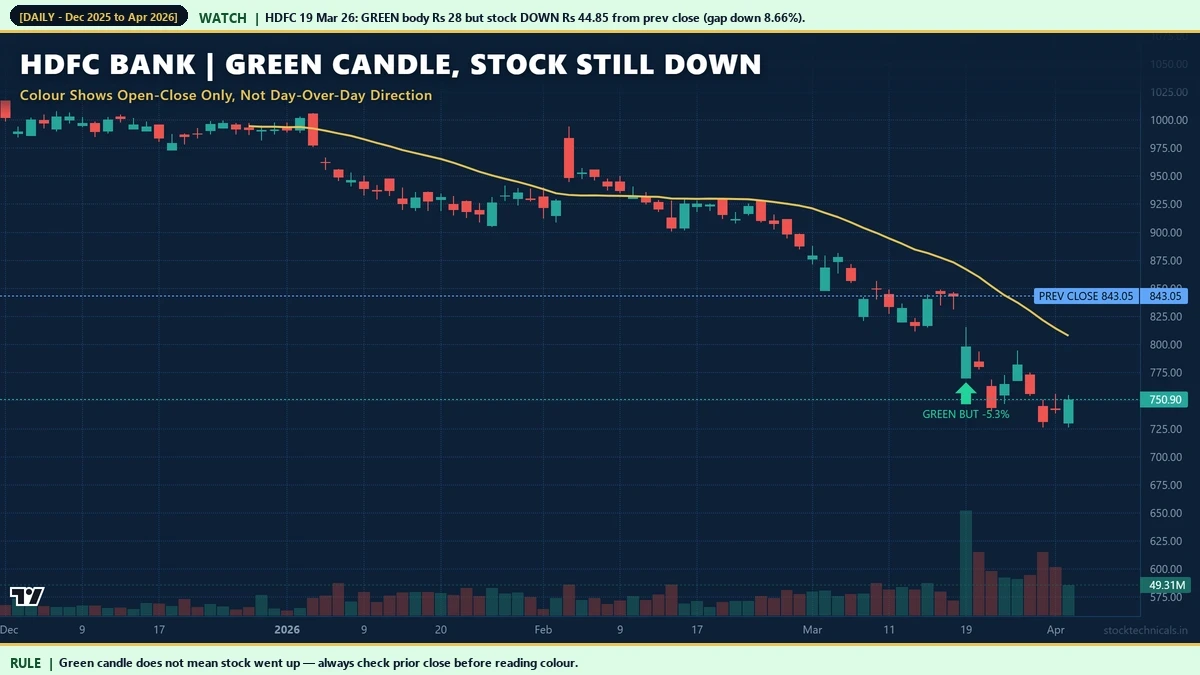
Gap Down Open — When the Open is lower than the previous candle’s Close. Overnight selling pressure forced a lower start. On March 19, 2026, HDFC Bank closed at ₹ 843.05 the previous day but opened at ₹ 770.00 — a gap down of ₹ 73.05 (8.66%). Sellers dominated the pre-market sentiment so aggressively that the stock opened nearly 9% lower.
Flat Open — When the Open is nearly identical to the previous Close. Neither side has overnight conviction. On January 2, 2025, Reliance opened at exactly ₹ 1,221.25 — the same price it closed at on the previous trading day. Zero gap. The day’s direction would be decided entirely by intraday action.
The gap between yesterday’s Close and today’s Open is itself a powerful signal. Large gaps suggest strong overnight sentiment — often driven by earnings announcements, global market moves, or regulatory changes. Gaps that fill quickly during the session often signal false moves.
Reading the Open on a chart: On TradingView, hovering over any candle shows the OHLC values in the top-left corner. On Zerodha Kite, the crosshair tool displays the same data. The Open is always the first value displayed.
The High: Maximum Buyer Enthusiasm
The HIGH is the absolute maximum price touched during the candle’s time period. It represents the peak of buyer aggression for that session.
Think of it this way — at some point during the candle’s formation, a buyer was willing to pay this price. Every price above this level was tested and rejected. No buyer was willing to go higher.
What the High reveals:
- Resistance testing — If the High touches a known support and resistance level and backs off, that level proved too strong for buyers
- Buyer enthusiasm — A High far above the Open shows aggressive buying early in the session
- Wick formation — If the candle closes well below the High, the resulting upper wick shows that the highest prices were rejected
Example: Reliance Industries on August 19, 2025 showed extreme buyer conviction. The candle printed Open ₹ 1,390.00, High ₹ 1,421.00, Low ₹ 1,389.10, Close ₹ 1,420.10. The body covered ₹ 30.10 out of a total range of ₹ 31.90 — a massive 94.4% body percentage. The High of ₹ 1,421.00 was barely ₹ 0.90 above the Close, meaning buyers pushed to the peak and held virtually all of it.

The Low: Maximum Seller Pressure
The LOW is the absolute minimum price during the candle’s time period. It marks the point of maximum seller aggression — the lowest price at which someone was willing to dump shares.
What the Low reveals:
- Support testing — If the Low touches a support zone and bounces back, that zone attracted buyers willing to defend the level
- Seller panic — A Low far below the Open suggests aggressive selling or panic during the session
- Lower wick formation — If the candle closes well above the Low, the resulting lower wick shows that the lowest prices were rejected by buyers who stepped in
Example: HDFC Bank on March 19, 2026 demonstrated a dramatic recovery from seller pressure. The stock gapped down 8.66% from the previous close of ₹ 843.05, opening at ₹ 770.00. The Low that day was also ₹ 770.00 — meaning the gap-down opening price was the absolute worst level sellers could achieve. From there, buyers stepped in aggressively, pushing the stock to a High of ₹ 815.65 and closing at ₹ 798.20.
The Low is particularly important when combined with volume analysis. That HDFC Bank session traded 171.6 million shares — more than 7 times the previous day’s volume. A deep Low on heavy volume followed by a recovery Close suggests genuine institutional demand.
The Close: The Final Verdict
The CLOSE is the last traded price when the candle completes. Of all four OHLC values, the Close is considered the most important by virtually every technical analyst and trading system.
Why the Close dominates: The Close represents the final consensus between all buyers and sellers for that time period. Every moving average calculation, every RSI reading, every MACD signal — all use the Close price as their primary input.
The Close determines the candle’s colour: Close above Open = Bullish candle (green/white). Close below Open = Bearish candle (red/black). Close equals Open = Doji formation.
Why traders watch the Close on daily candles:
- It sets the reference point for the next day’s Open (gaps are measured from here)
- Mutual funds and institutions often rebalance portfolios based on closing prices
- The NSE closing price is calculated using a weighted average of the last 30 minutes of trading — making it resistant to manipulation
- Stop-loss orders on delivery positions typically execute based on closing price breaches
How NSE calculates the closing price: The official closing price on NSE is calculated as the volume-weighted average price (VWAP) of the last 30 minutes of continuous trading. This makes it resistant to manipulation by a single large order. The last 30 minutes of the session often see heavy institutional activity, which is why the final candles of the day on intraday charts carry disproportionate weight. Note: SEBI has announced a Closing Auction Session (CAS) to replace this VWAP method, effective August 2026.

The Body: Reading Session Conviction
The body of a candlestick is the thick rectangular area between the Open and Close prices. It is the most visually dominant part of any candle — and the most information-rich.
Body = Open-to-Close range. Nothing more, nothing less.
Large Body: Strong Conviction
When the body spans a significant portion of the candle’s total range (High to Low), it signals that one side dominated the session decisively.
Example: SBI on May 16, 2025 printed a textbook bearish Marubozu — Open ₹ 804.00, High ₹ 804.00, Low ₹ 791.00, Close ₹ 792.10. The body of ₹ 11.90 covered 91.5% of the total ₹ 13.00 range. The Open equalled the High — sellers dominated from the very first tick.
Small Body: Indecision Zone
A small body relative to the total range signals that neither buyers nor sellers achieved a decisive win. Small-body candles after a strong trend often signal exhaustion and potential reversal. This is the foundation of patterns like the Doji and the Spinning Top.
Example: Tata Steel on June 11, 2025 formed a near-perfect spinning top — Open ₹ 156.45, High ₹ 157.53, Low ₹ 155.31, Close ₹ 156.41. The body of just ₹ 0.04 covered a mere 1.8% of the ₹ 2.22 total range. The upper wick (48.6%) and lower wick (49.5%) were almost perfectly equal.
Reading Body Position Within the Range
- Body in the upper third — Buyers in control. Even if the body is small, the fact that it sits near the High suggests buying pressure dominated.
- Body in the lower third — Sellers in control. The candle spent most of its range above the body.
- Body in the middle — True indecision. Neither side could claim the high ground.
This is why a candle like the Hammer — small body near the top with a long lower wick — is bullish. The body position tells traders that buyers had the last word.
The Wicks: Prices the Market Rejected
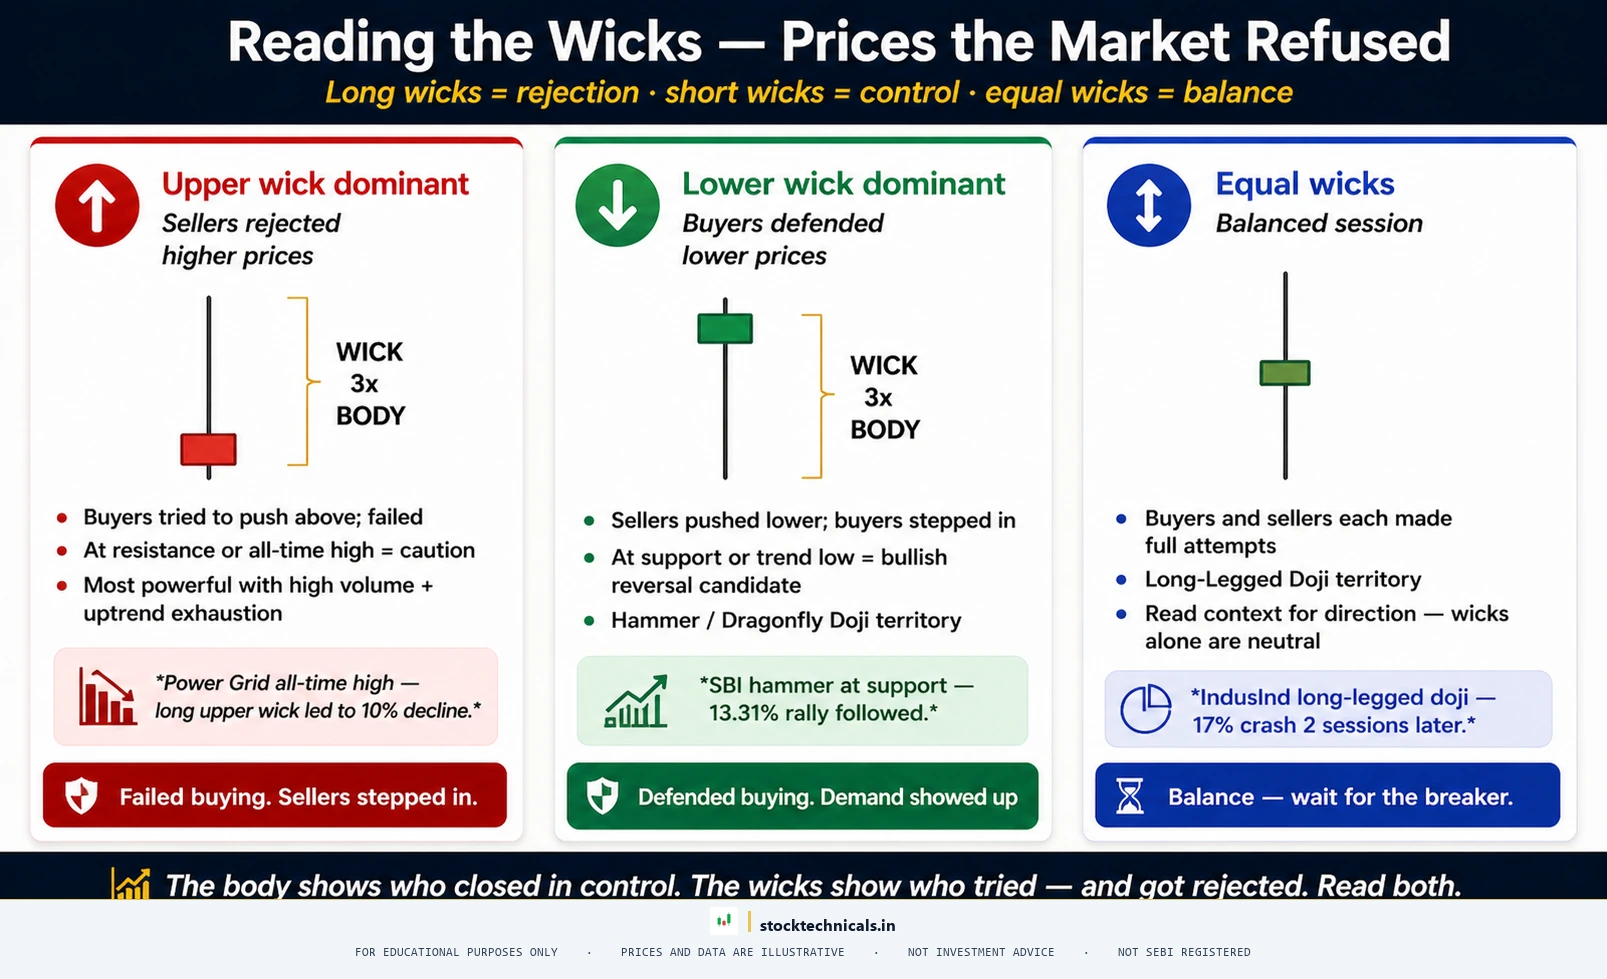
Wicks (also called shadows) are the thin lines extending above and below the body. They represent prices that were reached during the session but ultimately rejected.
The Upper Wick: Rejection from Above
The upper wick extends from the top of the body to the High. A long upper wick means buyers pushed aggressively to higher prices, but sellers fought back and drove the price down before the candle closed.
When upper wicks matter most:
- At resistance levels — a long upper wick touching resistance confirms the level is active
- After a sustained uptrend — long upper wicks on consecutive candles signal buyer exhaustion
- As part of patterns like the Shooting Star
The Lower Wick: Rejection from Below
Example: SBI on February 18, 2025 formed a textbook hammer with sustained follow-through. The candle had a small body at the top and a long lower wick covering 77.5% of the total range. After a 4-day decline of 4.30%, sellers pushed the stock to a fresh low but buyers recovered the entire move by the close. Over the next 9 weeks the stock rallied 13.31% — the hammer marked the structural reversal.
Equal Wicks: The Balanced Session
When both wicks are roughly equal in length, the candle shows that the market tested both directions equally. Combined with a small body, equal wicks form the classic Doji candle — one of the most important single-candle patterns in technical analysis.
Candle Colour: Green vs Red
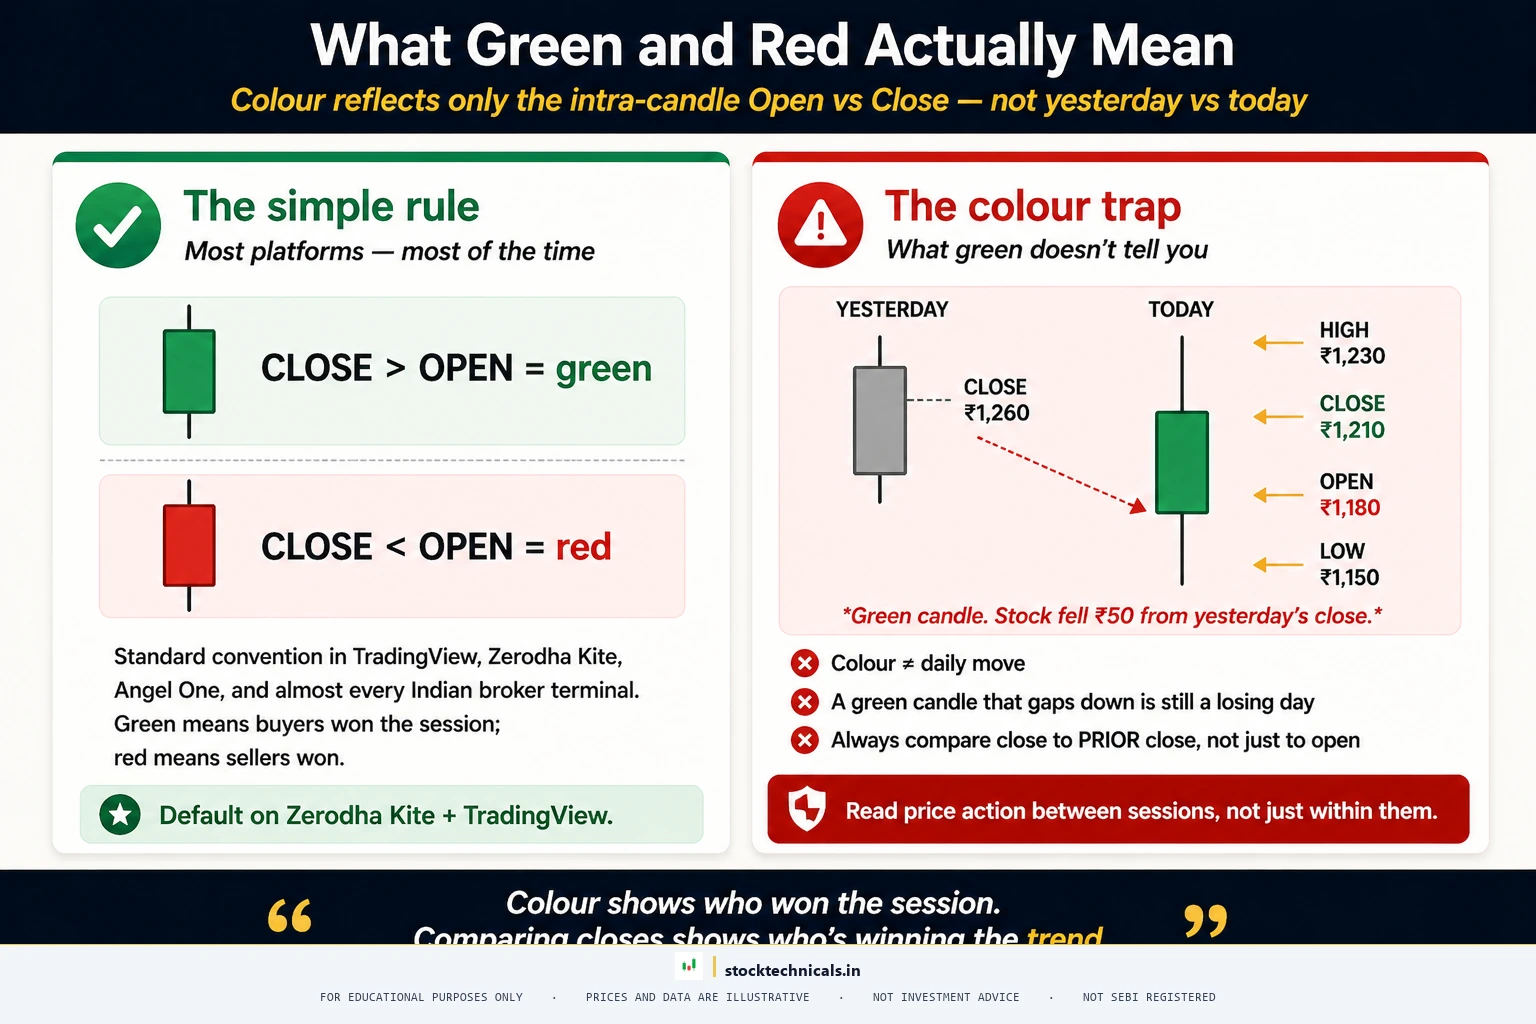
Candle colour is determined by exactly one thing: the relationship between Open and Close. Green (or White): Close is ABOVE Open — Bullish. Red (or Black): Close is BELOW Open — Bearish.
Common misconception: A green candle does NOT mean the price went up from the previous candle. A stock can gap down heavily, then form a green candle that still closes lower than yesterday. The colour only reflects the battle within that single candle’s timeframe.
Example: HDFC Bank on March 19, 2026 perfectly illustrates this trap. The previous day’s Close was ₹ 843.05. The stock gapped down 8.66% and opened at ₹ 770.00. During the day, buyers pushed it to a Close of ₹ 798.20. The candle is GREEN (Close ₹ 798.20 is above Open ₹ 770.00). But the stock is actually DOWN ₹ 44.85 from the previous day — a 5.32% decline. A trader who sees only the green colour might think “bullish” when the reality is that the stock dropped over 5%.
This distinction matters enormously for reading candlestick patterns. Many bullish patterns form with green candles that appear after a decline, while bearish patterns form with red candles that appear after a rally.
Reading Candle Proportions Like a Pro

Beyond individual components, experienced traders read the proportions between body and wicks as a unified signal.
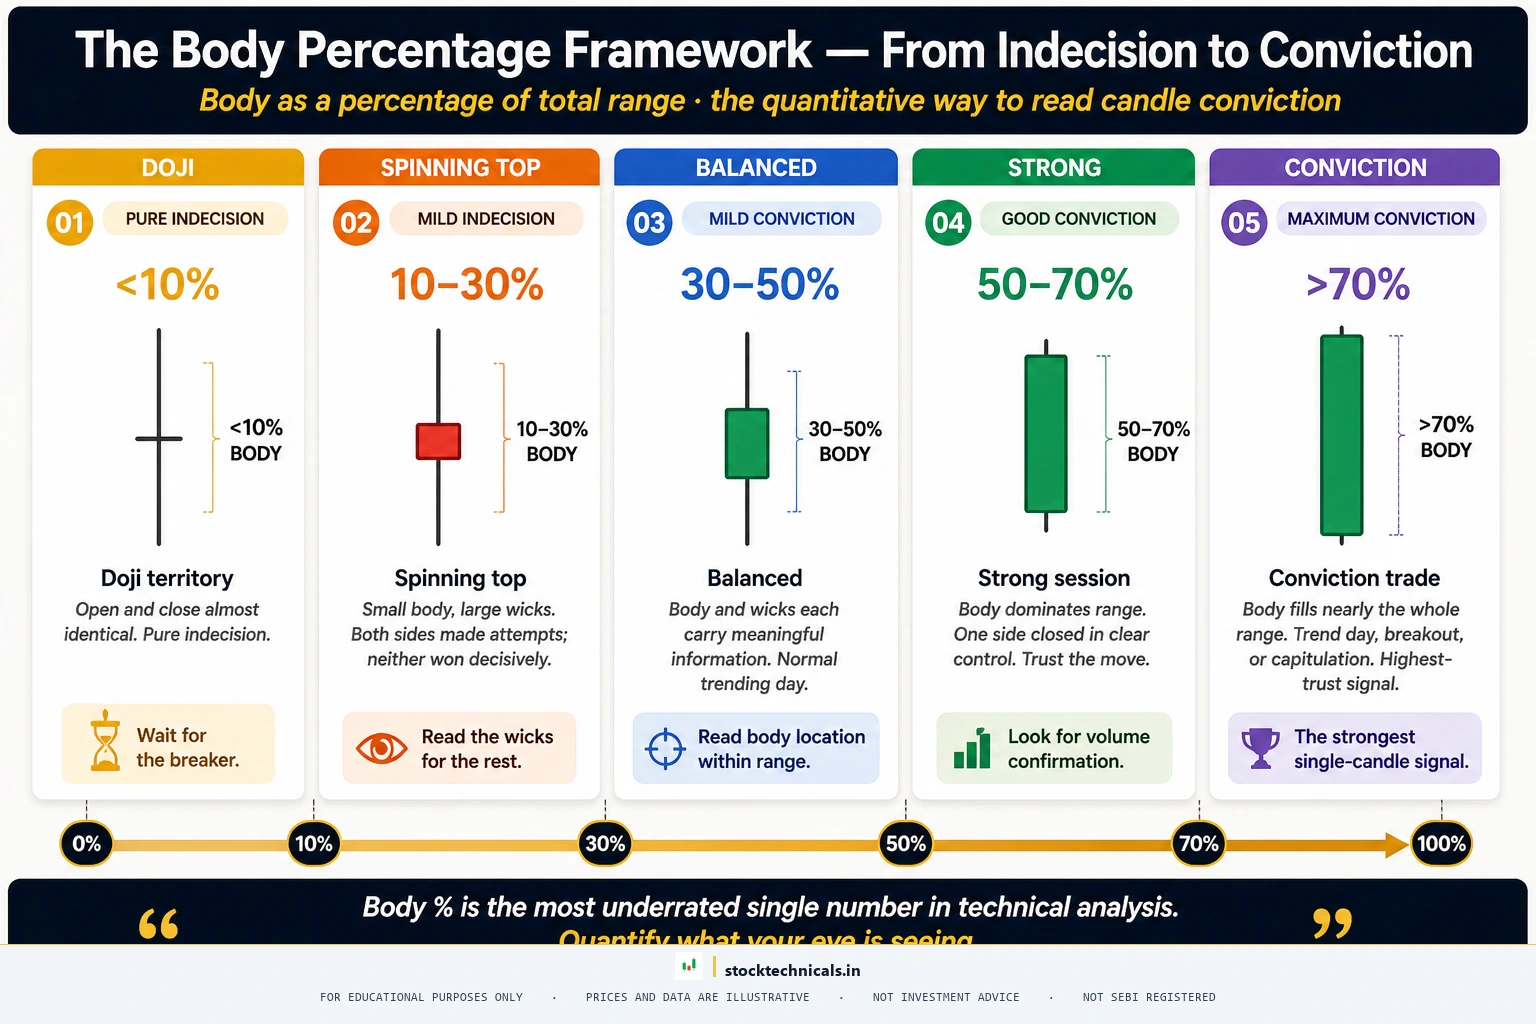
The Body Percentage Framework
Body percentage = (Body size / Total range) x 100
Using this on real charts: Load any daily chart on TradingView and hover over candles. If Reliance shows O:1,390.00, H:1,421.00, L:1,389.10, C:1,420.10 — the body is ₹ 30.10, total range is ₹ 31.90, body percentage is 94.4%. That is an extreme conviction bullish candle.
Wick Ratio Signals
When either wick ratio exceeds 50%, the rejection signal is dominant. The candle spent more than half its range at prices that were ultimately abandoned.
- Long lower wick (greater than 60%), tiny body at top = Hammer formation (bullish if at support)
- Long upper wick (greater than 60%), tiny body at bottom = Shooting Star (bearish if at resistance)
- Both wicks long (greater than 30% each), tiny body in middle = High Wave candle (extreme indecision)
Special Candle Shapes Every Trader Must Recognise
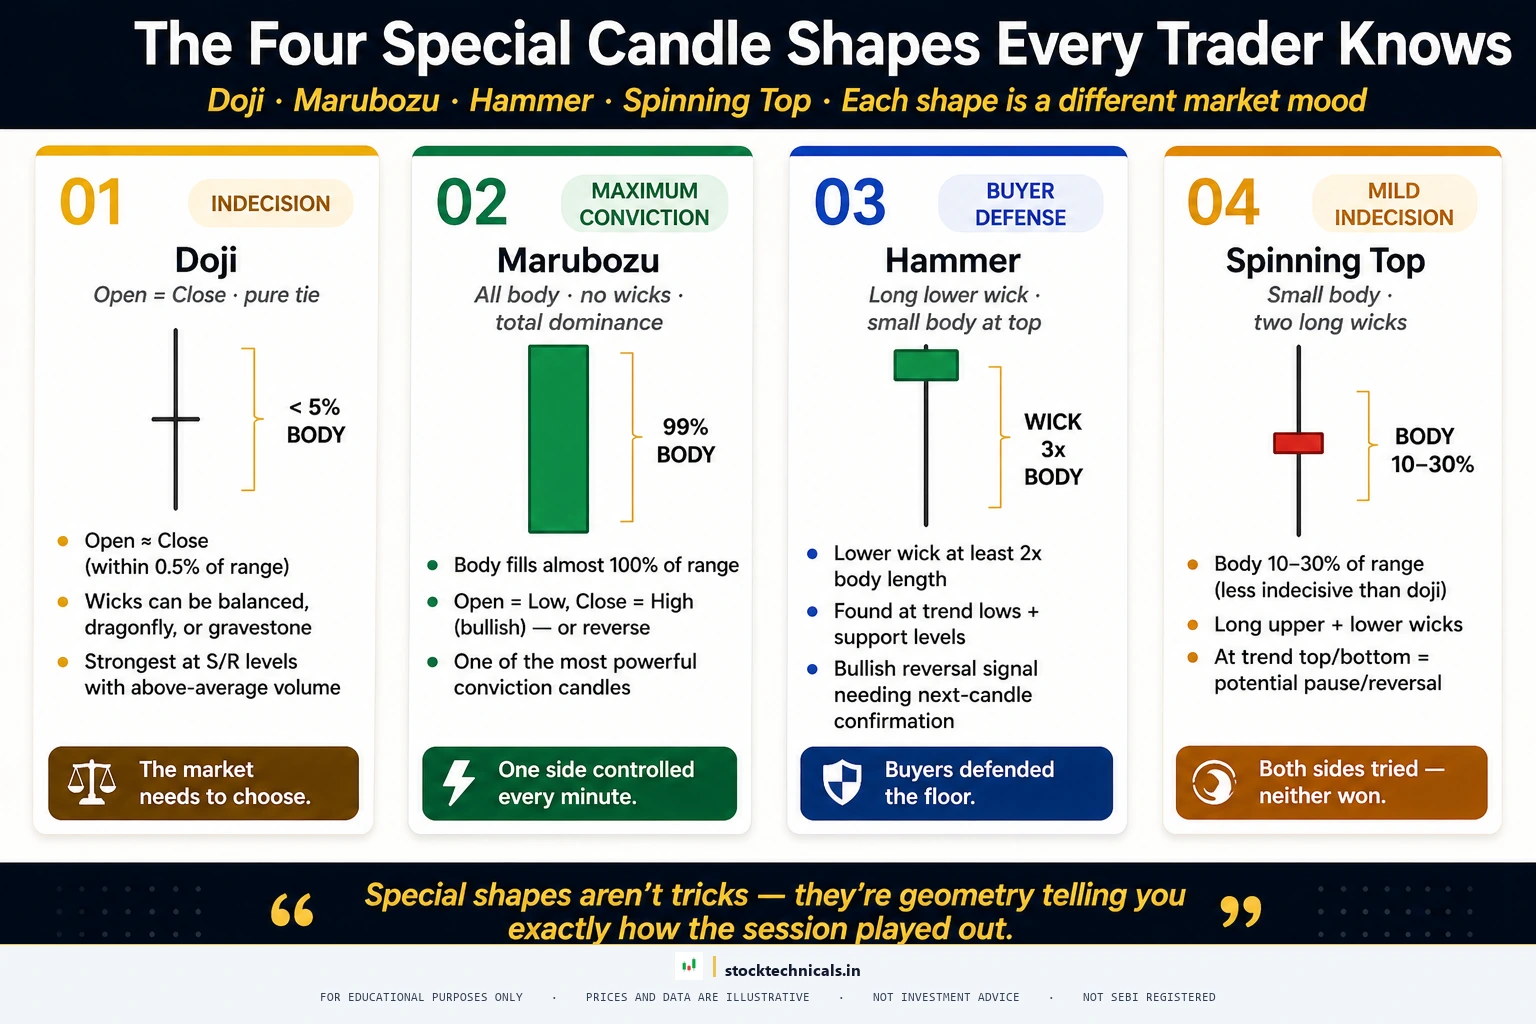
The Doji: When Open Equals Close
Example: Infosys on February 6, 2025 printed a long-legged Doji near its local high. Open ₹ 1,917.00, High ₹ 1,924.00, Low ₹ 1,900.00, Close ₹ 1,915.65. The body of just ₹ 1.35 covered only 5.6% of the ₹ 24.00 total range. The High of ₹ 1,924.00 surpassed the previous session’s high of ₹ 1,919.70 before pulling back. A Doji at the top of an uptrend warns of reversal.
The Marubozu: Maximum Conviction
Bullish Marubozu: On May 12, 2025, Reliance printed Open ₹ 1,400.00, High ₹ 1,439.00, Low ₹ 1,400.00, Close ₹ 1,436.50. Open equalled the Low — buyers controlled from the first tick. Body 93.6%, zero lower wick.
Bearish Marubozu: SBI on May 16, 2025 — Open ₹ 804.00, High ₹ 804.00, Low ₹ 791.00, Close ₹ 792.10. Open equalled the High. Sellers controlled every moment from Open to Close. Body 91.5%.
The Spinning Top and Hammer
The Tata Steel example from June 11, 2025 (body 1.8%, wicks 48.6% and 49.5%) is a textbook spinning top. When this appears after a strong trend, it signals that the trend is losing momentum.
The Hammer forms when the body sits at the top of the range with a long lower wick. The TCS example from October 16, 2025 (body 2.5%, lower wick 84.0%) demonstrates this perfectly.
Real NSE Examples with Verified OHLC Data
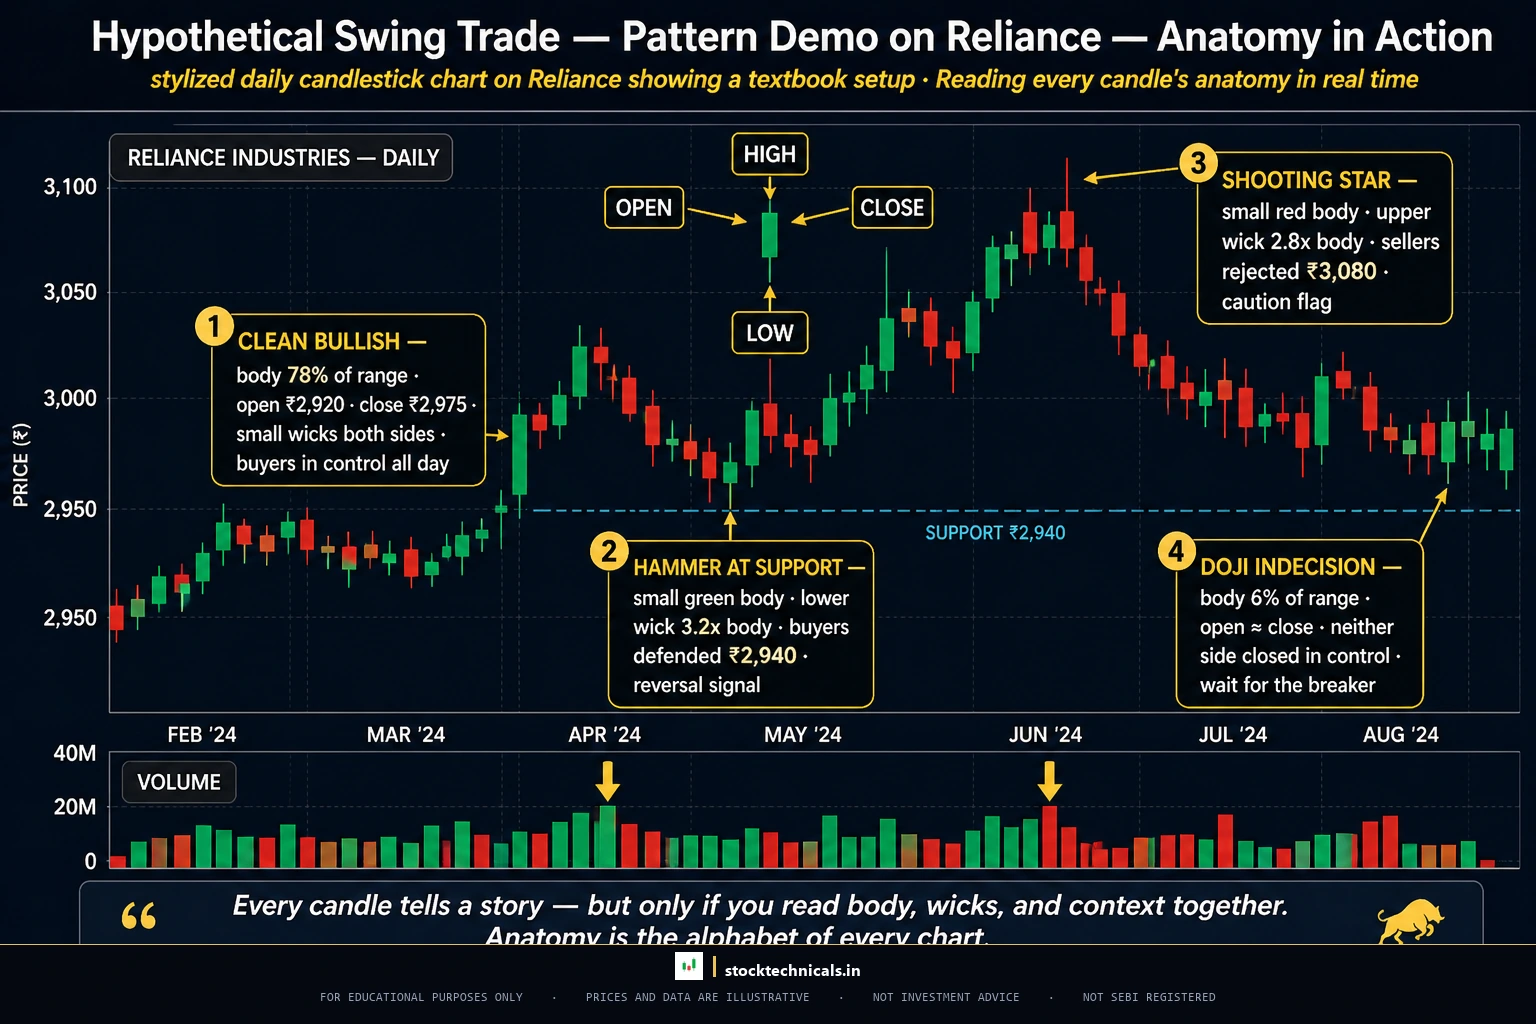
Here are four real-world candle readings from NSE stocks, each verified against real NSE price action.
Reliance Industries — Clean Bullish Candle (August 19, 2025)
Open: ₹ 1,390.00 | High: ₹ 1,421.00 | Low: ₹ 1,389.10 | Close: ₹ 1,420.10. Body: ₹ 30.10, Range: ₹ 31.90, Body %: 94.4%. Upper wick: 2.8%, Lower wick: 2.8%. Reading: Buyers controlled this session completely. Both wicks are under 3%. This is what a clean, dominant bullish candle looks like.
TCS — Hammer at Support (October 16, 2025)
Open: ₹ 2,969.90 | High: ₹ 2,975.00 | Low: ₹ 2,943.10 | Close: ₹ 2,970.70. Body: ₹ 0.80, Range: ₹ 31.90, Body %: 2.5%. Lower wick: 84.0%. Reading: Sellers pushed TCS nearly ₹ 27 below the Open during the session. But the Close came back to almost exactly the Open level. After three days of decline, this hammer signals potential exhaustion of selling pressure.
Infosys — Doji at Resistance (February 6, 2025)
Open: ₹ 1,917.00 | High: ₹ 1,924.00 | Low: ₹ 1,900.00 | Close: ₹ 1,915.65. Body: ₹ 1.35, Range: ₹ 24.00, Body %: 5.6%. Reading: The stock’s High of ₹ 1,924.00 surpassed the previous session’s high of ₹ 1,919.70 before pulling back. The tiny body means the session settled almost exactly where it started. At resistance, this Doji signals the uptrend may be losing steam.
HDFC Bank — Green Candle, Stock Down (March 19, 2026)
Previous Close: ₹ 843.05. Open: ₹ 770.00, High: ₹ 815.65, Low: ₹ 770.00, Close: ₹ 798.20. Body: ₹ 28.20 (GREEN). But stock is DOWN ₹ 44.85 (minus 5.32%). Volume: 171.6 million shares (7.3x previous day). Reading: The candle is green but the stock fell 5.32%. Colour shows intra-candle performance, not inter-candle direction.
How to Read OHLC Data on Trading Platforms
On TradingView
Open any chart on TradingView. The OHLC data displays in the header bar (top-left corner), data window (Shift+D), and via the crosshair tool. Values are colour-coded: green numbers indicate the current value is above the previous candle’s corresponding value, red numbers indicate it is below.
On Zerodha Kite
On Kite’s chart interface: use crosshair mode (click the crosshair icon or press +), the info panel on the right, or the market depth for the candle currently forming. Most traders develop a habit of checking the OHLC values of the last 3–5 candles before making any trading decision.
The Candle Reading Framework
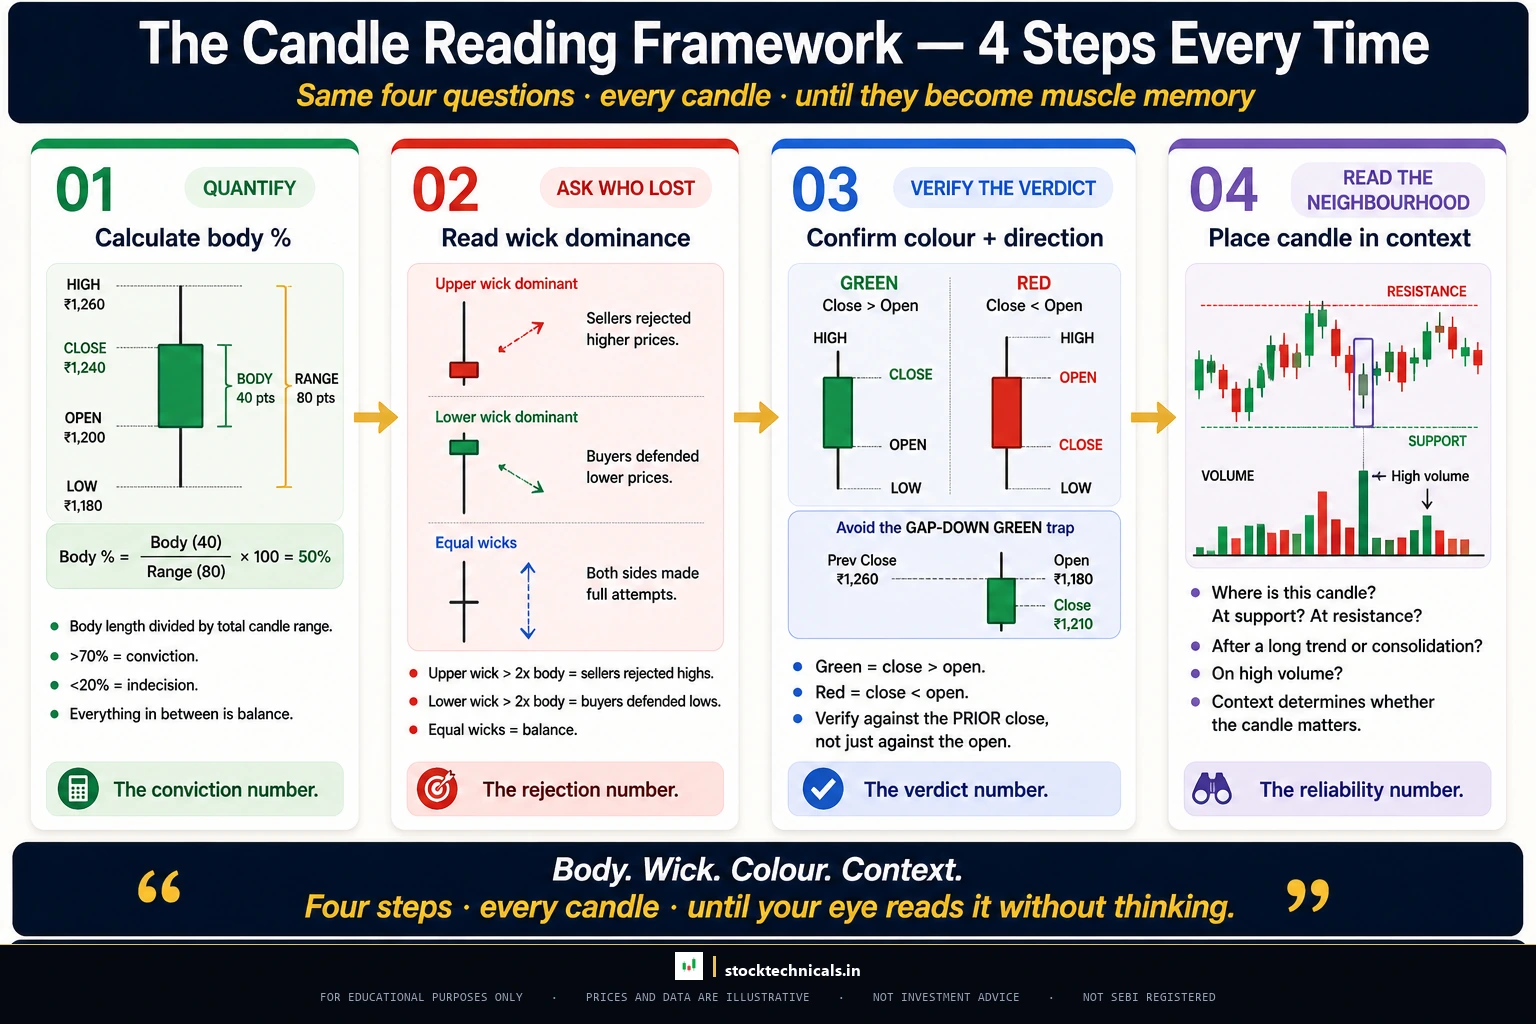
When looking at any single candlestick, a systematic approach prevents missing signals. Follow these four steps for every candle:
Step one — Check the body. Calculate body percentage. Above 70% is decisive. Below 20% is indecision. Between 20–70% is the middle ground where wicks tell the story.
Step two — Check the wicks. Which wick is longer? A dominant upper wick means rejection from above. A dominant lower wick means rejection from below. Equal wicks mean neither side won.
Step three — Check the colour. Green means the Close was above the Open. Red means the Close was below the Open. But remember — colour reflects only the intra-candle battle.
Step four — Check the context. Where is this candle in the trend? Is it at a support or resistance level? What did volume look like? Context turns a candle from a data point into a signal.
Practice Exercise: Decode These Candles
For each candle below, identify the body percentage, dominant wick, colour, and what the candle signals.
Candle A: O: ₹ 520, H: ₹ 520, L: ₹ 498, C: ₹ 498. Body covers the entire range. No wicks. Bearish Marubozu — absolute seller dominance. Body percentage: 100%.
Candle B: O: ₹ 1,150, H: ₹ 1,180, L: ₹ 1,148, C: ₹ 1,152. Body: ₹ 2, Range: ₹ 32, Body %: 6.25%. Long upper wick (₹ 28). This is a Shooting Star — bearish rejection from above.
Candle C: O: ₹ 340, H: ₹ 347, L: ₹ 312, C: ₹ 342. Body: ₹ 2, Range: ₹ 35, Body %: 5.7%. Massive lower wick (₹ 28). This is a Hammer — buyers recovered a ₹ 28 fall. Bullish signal at support.
Candle D: O: ₹ 890, H: ₹ 910, L: ₹ 870, C: ₹ 905. Body: ₹ 15, Range: ₹ 40, Body %: 37.5%. Green candle with lower wick (₹ 20) larger than upper wick (₹ 5). Bullish candle with initial selling absorbed.
Candle E: O: ₹ 2,100, H: ₹ 2,108, L: ₹ 2,093, C: ₹ 2,100. Body: ₹ 0, Range: ₹ 15. Open equals Close. Classic Doji — total indecision.

Interactive Tool: Candle Anatomy Decoder
Practice reading OHLC data with this interactive decoder. Decode random candlesticks or test your knowledge with the quiz.
Interactive Tool: Candle Anatomy Decoder
Practice reading candlestick OHLC data with real-world scenarios
The Bottom Line
A single candlestick contains more information than most traders extract in a lifetime of chart-watching. The four prices — Open, High, Low, Close — interact to create a visual language that reveals buyer conviction, seller desperation, institutional interest, and market indecision in a single glance.
The traders who profit consistently from candlestick analysis are not the ones who memorise 100 pattern names. They are the ones who can look at any candle, calculate the body percentage in two seconds, check the wick dominance, and place it in the context of where it appears on the chart.
Start with one candle. Read all four prices. Calculate the body percentage. Check the wicks. Check the context. Repeat.
What are the four components of a candlestick?
Every candlestick contains exactly four prices: Open (first traded price), High (maximum price), Low (minimum price), and Close (last traded price). These four values determine the candle's body, wicks, colour, and shape.
Which OHLC value is the most important?
The Close is considered the most important by virtually every technical analyst. It determines the candle's colour, feeds into every indicator calculation (moving averages, RSI, MACD), and represents the final consensus between buyers and sellers.
What does body percentage tell you about a candlestick?
Body percentage measures conviction. Above 70% signals decisive control by one side (Marubozu territory). Between 20-70% is moderate. Below 20% signals indecision (Doji or Spinning Top). Calculate it as |Close - Open| divided by (High - Low) times 100.
Can a green candlestick still mean the stock went down?
Yes. A green candle only means Close is above Open within that single candle. If the stock gapped down significantly from the previous close, it can form a green candle while still being lower than yesterday. For example, HDFC Bank on March 19, 2026 formed a green candle but was down 5.32% from the previous day.
What does a long lower wick mean on a candlestick?
A long lower wick means sellers pushed prices down aggressively during the session, but buyers stepped in and recovered the price before the close. This signals demand at lower prices. When this appears at a support level or after a downtrend, it is a bullish signal (Hammer pattern).
What is the difference between a Doji and a Spinning Top?
A Doji has virtually zero body (Open equals Close, body percentage under 5%). A Spinning Top has a small but visible body (typically 10-25% of range) with wicks on both sides. Both signal indecision, but a Doji represents more extreme indecision than a Spinning Top.
How do I read OHLC values on TradingView?
On TradingView, OHLC values display in three ways: the header bar in the top-left corner shows O, H, L, C for the candle under the cursor; the Data Window (Shift+D) shows detailed values; and the crosshair tool updates values in real time as you hover over candles.
Related Articles:
- What Are Candlestick Charts?
- Bullish Candlestick Patterns
- Bearish Candlestick Patterns
- Doji Candle Explained
- Hammer and Hanging Man
- Marubozu Pattern
- Shooting Star vs Inverted Hammer
- Engulfing Patterns
- Support and Resistance
- Volume in Trading
The body is the outcome. The wicks are the argument. Until both sides vote with their capital, it is just noise. Per the SEBI FY24-25 study, 91 percent of individual equity F&O traders lost money.