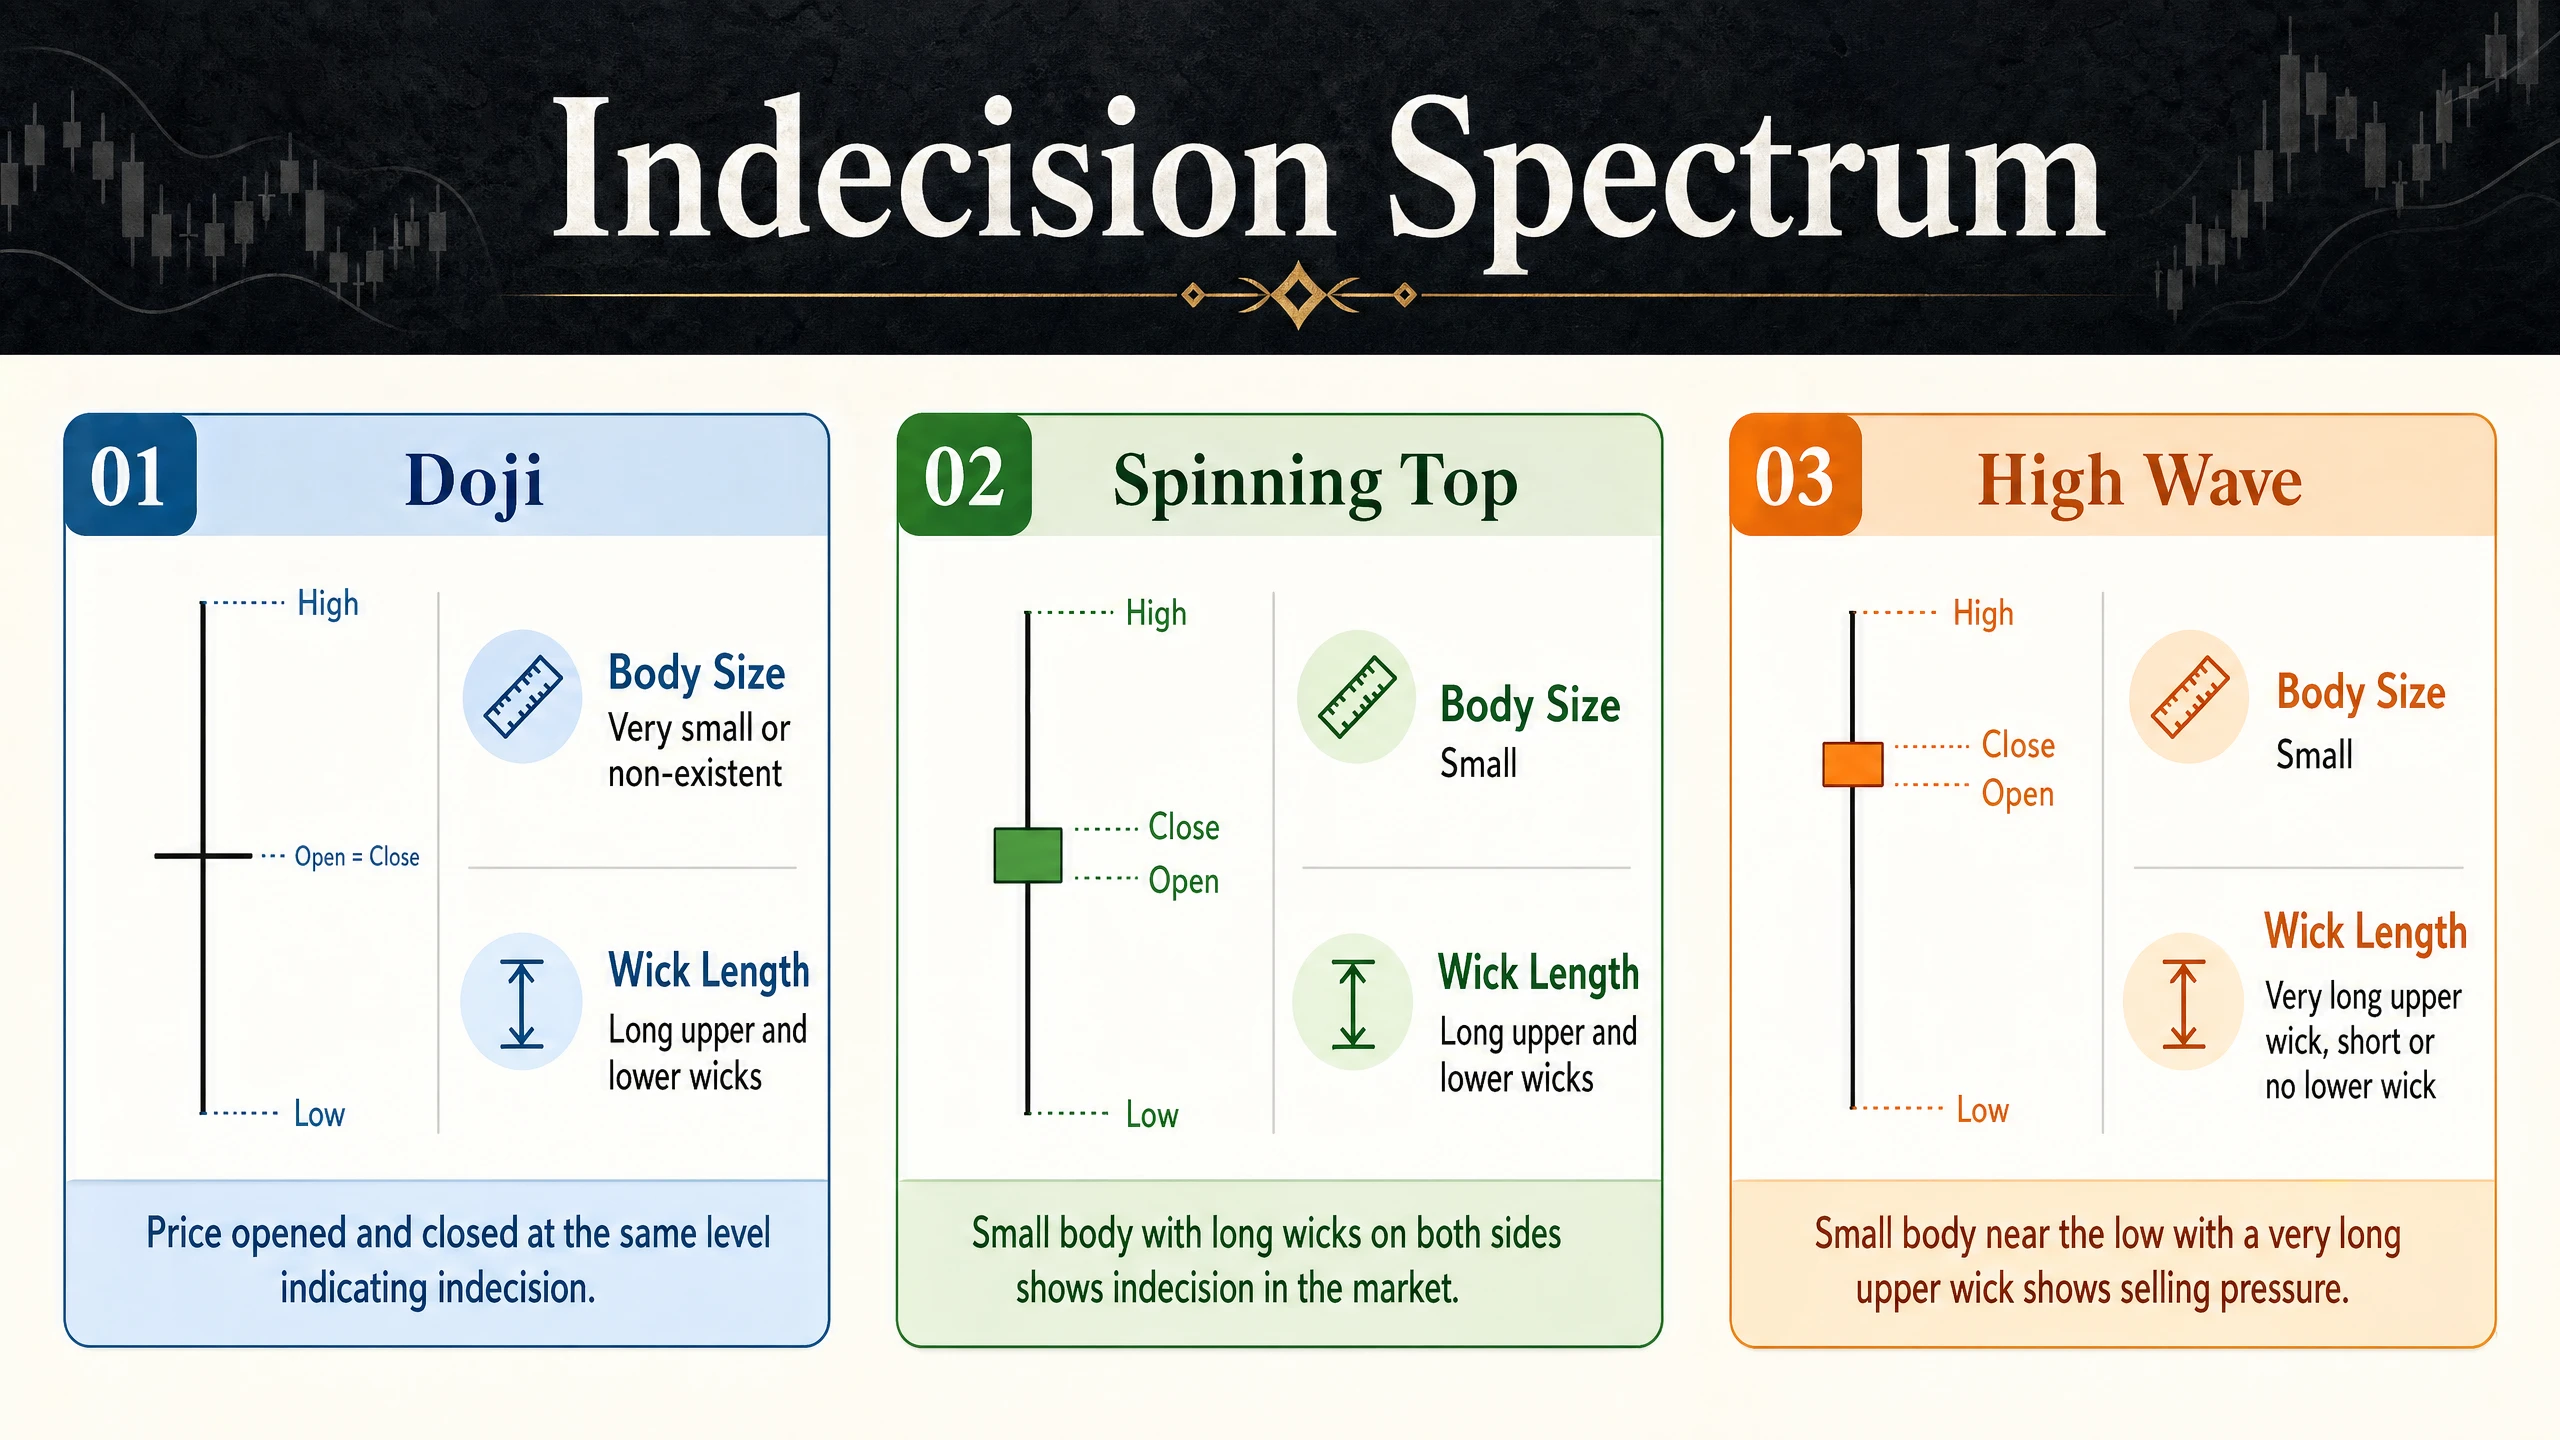
Spinning tops and high wave candles are the candlesticks of INDECISION — small bodies with long wicks on BOTH sides. They show that buyers and sellers fought hard but neither won. Unlike most candlestick patterns that signal a clear direction, these patterns signal that the market is undecided. The question is not what they mean — it is WHERE they appear.
A real example: Hindustan Zinc (NSE: HINDZINC) printed a high wave candle on May 22, 2024 after an 81.8% rally — signaling indecision that preceded a 16.1% pullback.
Our NSE audit found5,358 spinning tops and336 high wave candles that passed the 4-criterion reversal test across 282 stocks. These are patterns that appeared at genuine trend extremes and were followed by sustained reversals. Most spinning tops in mid-trend are noise — only the ones at extremes matter.

Key Takeaways
- Spinning top and high wave are INDECISION patterns — small body, long wicks on both sides.
- Location is everything: at trend extremes they warn of reversal, in sideways markets they are noise.
- Our NSE audit: 5,358 spinning tops + 336 high waves pass the 4-criterion test — but only ~40% of all spinning tops are at trend extremes.
- Strongest signal in entire candlestick audit: SUZLON spinning top on May 15, 2023 → +85.5% rally in 20 days.
- High wave = extreme spinning top with wicks exceeding 3x body. Rarer but more reliable at trend exhaustion.
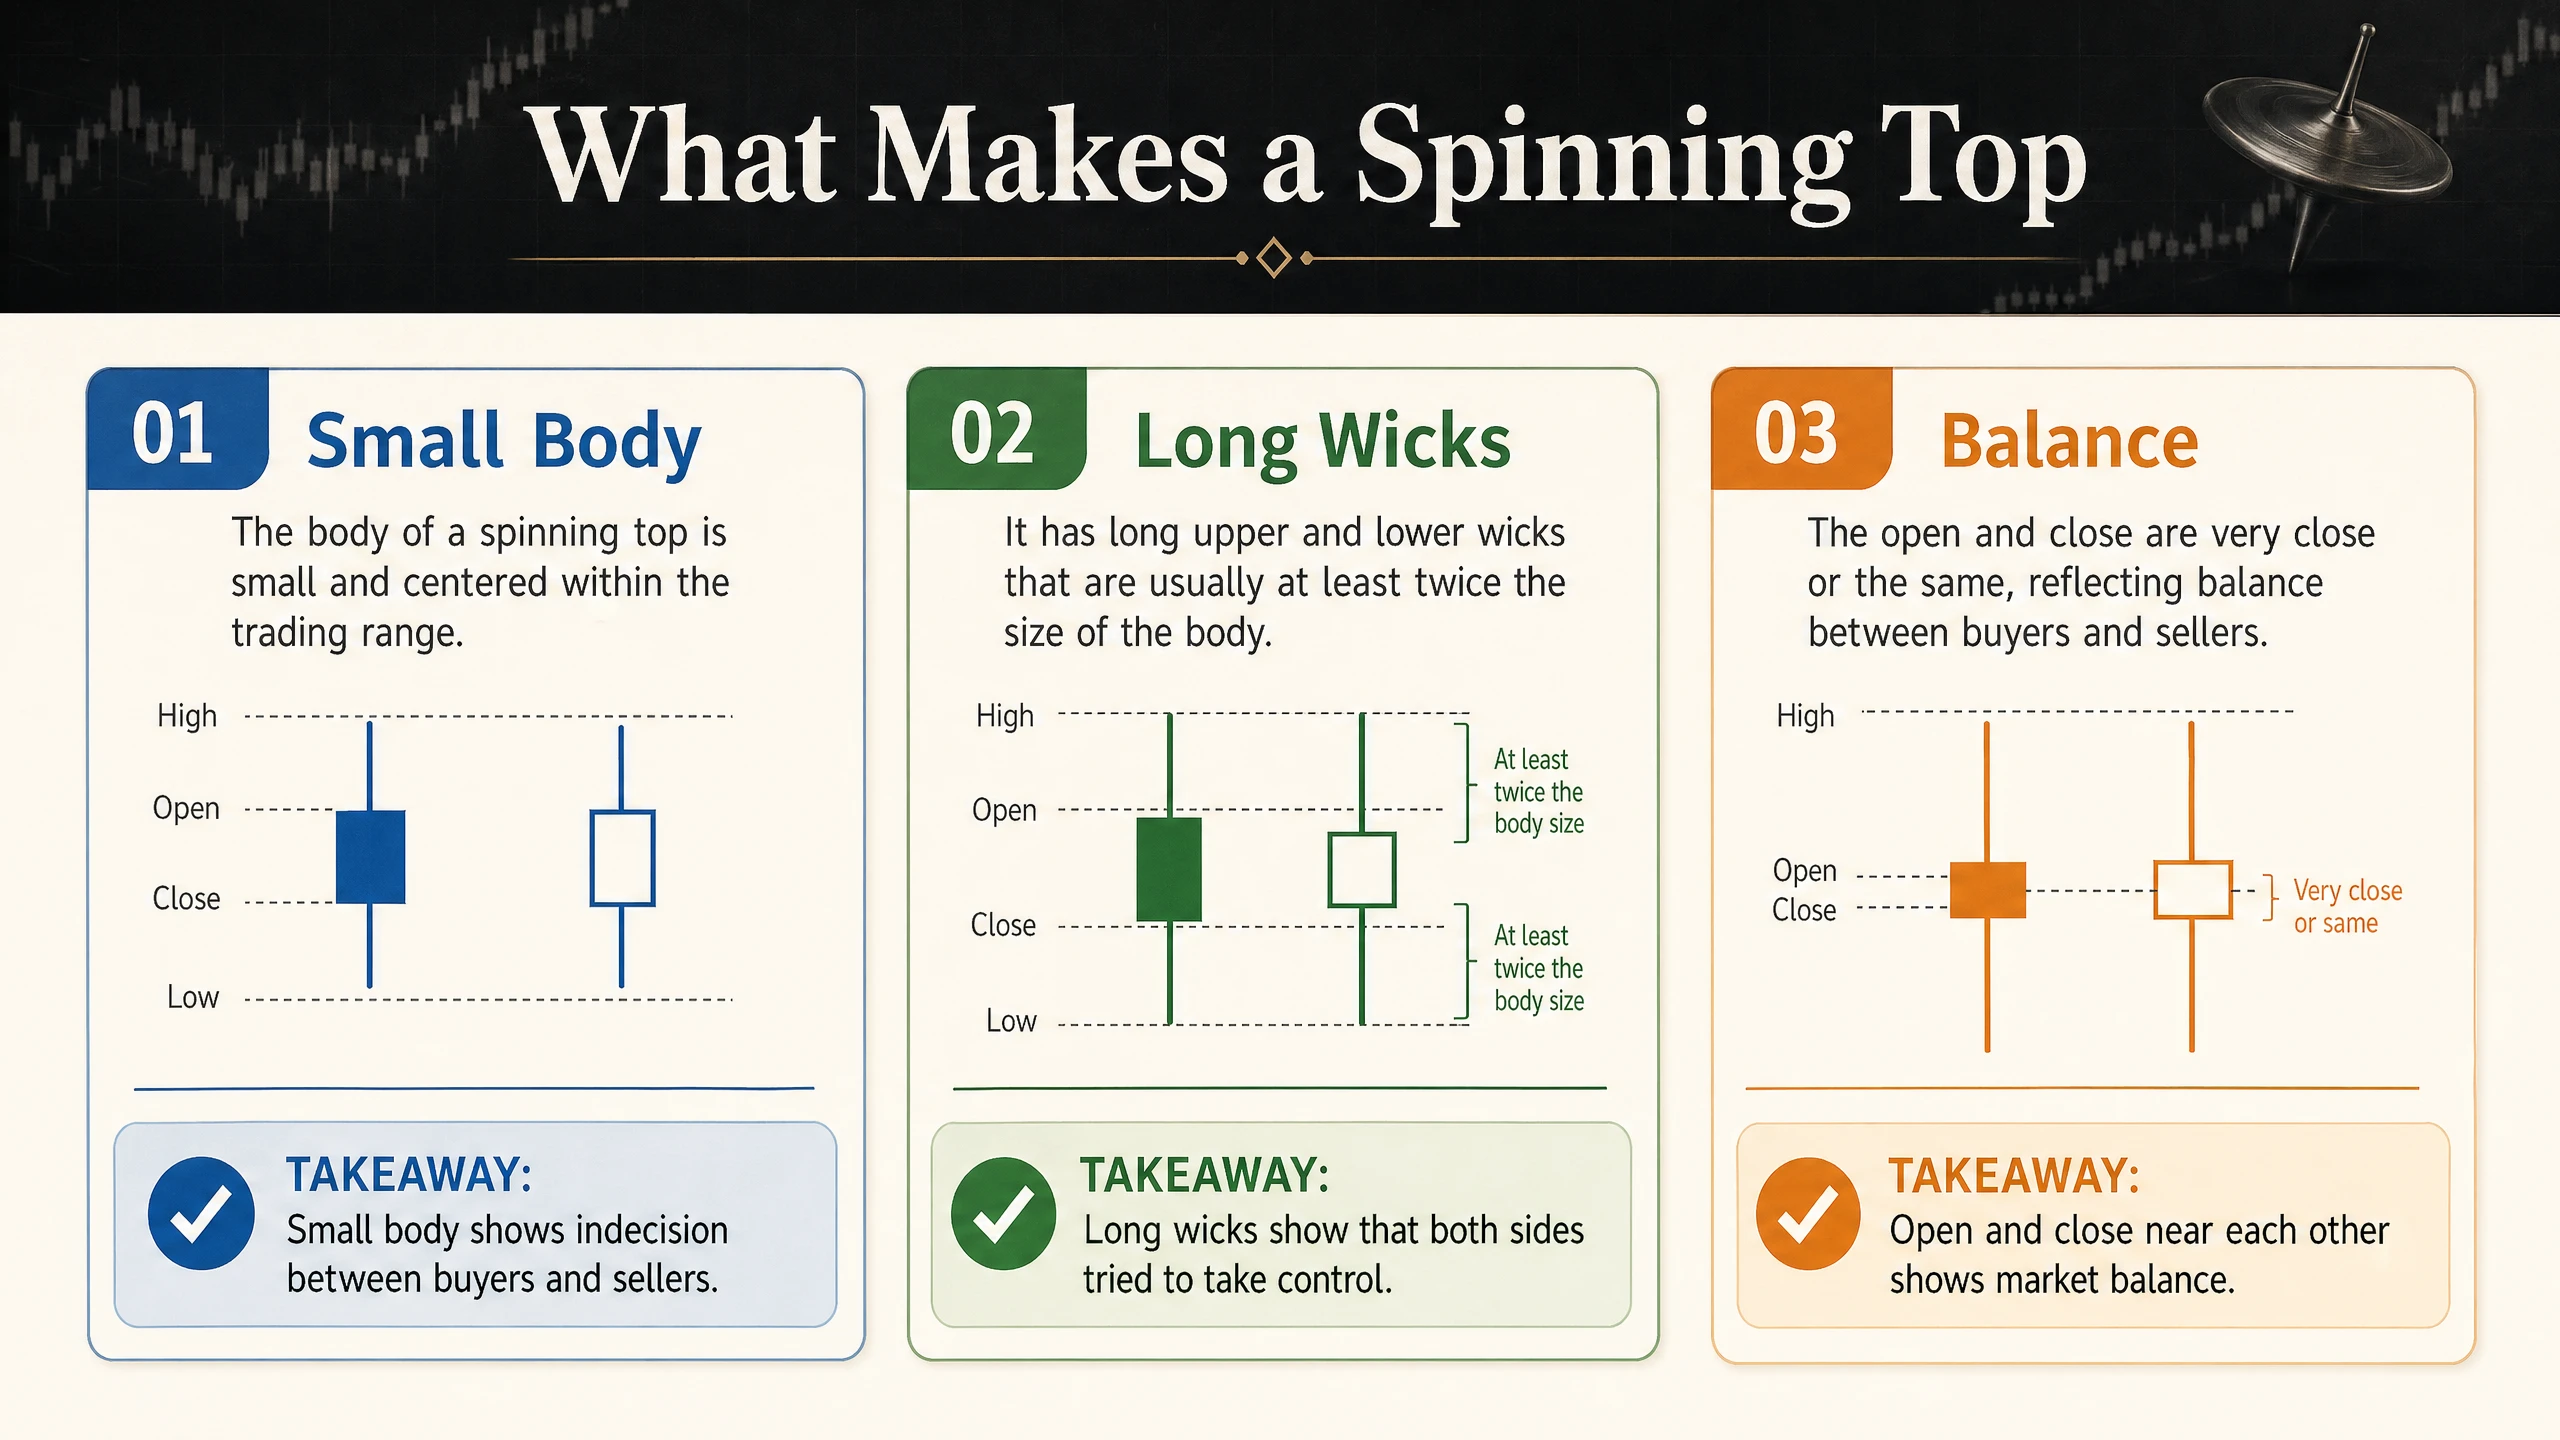
What Makes a Spinning Top
The spinning top has three strict geometric requirements:
Requirement 1: Small body. The body (open-to-close) must be less than 30% of the total candle range (high-to-low). The smaller the body, the stronger the indecision signal.
Requirement 2: Upper wick larger than body. Buyers pushed price up during the session but gave it back.
Requirement 3: Lower wick larger than body. Sellers pushed price down but also gave it back.
The body colour (green or red) matters less than the SHAPE. A spinning top with a small green body and a spinning top with a small red body carry similar signal weight at the same location.
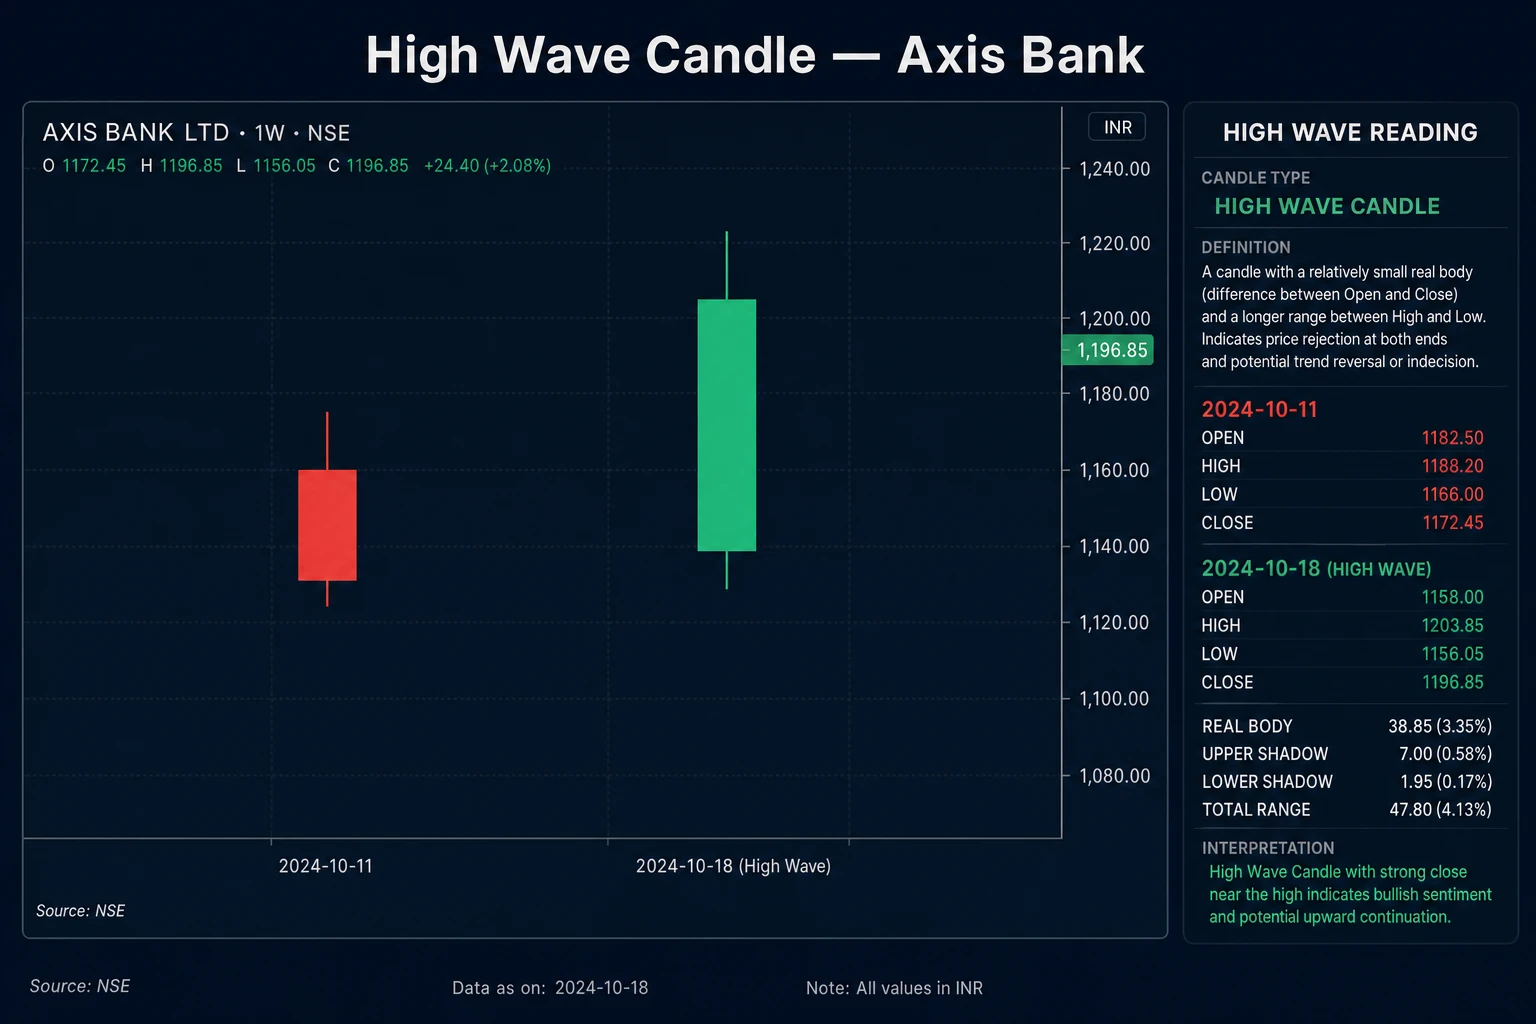
High Wave: The Extreme Version
A high wave candle has the same anatomy as a spinning top but with extreme wick proportions. The combined wicks (upper + lower) exceed 3x the body length. The candle looks like a plus sign or cross — almost a doji but with a visible body.
High waves are rarer than spinning tops because they require more dramatic intraday volatility. When they appear at trend extremes, the signal is proportionally stronger — the market is in MAXIMUM indecision.
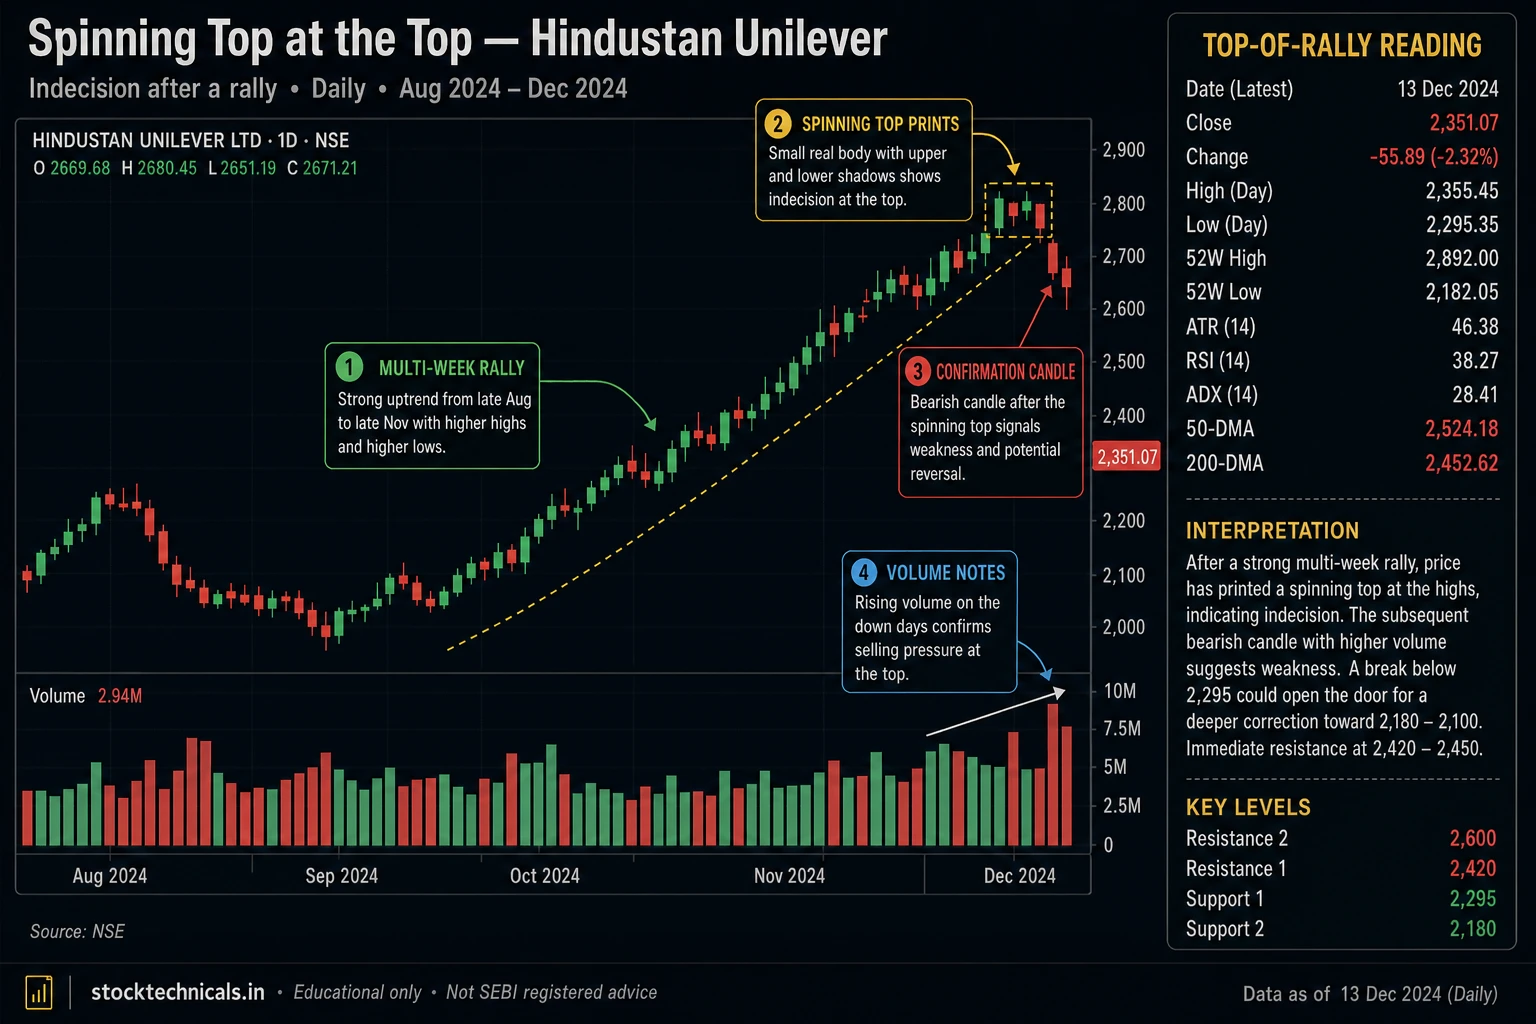
Spinning Top at Trend Tops (Bearish Reversal)
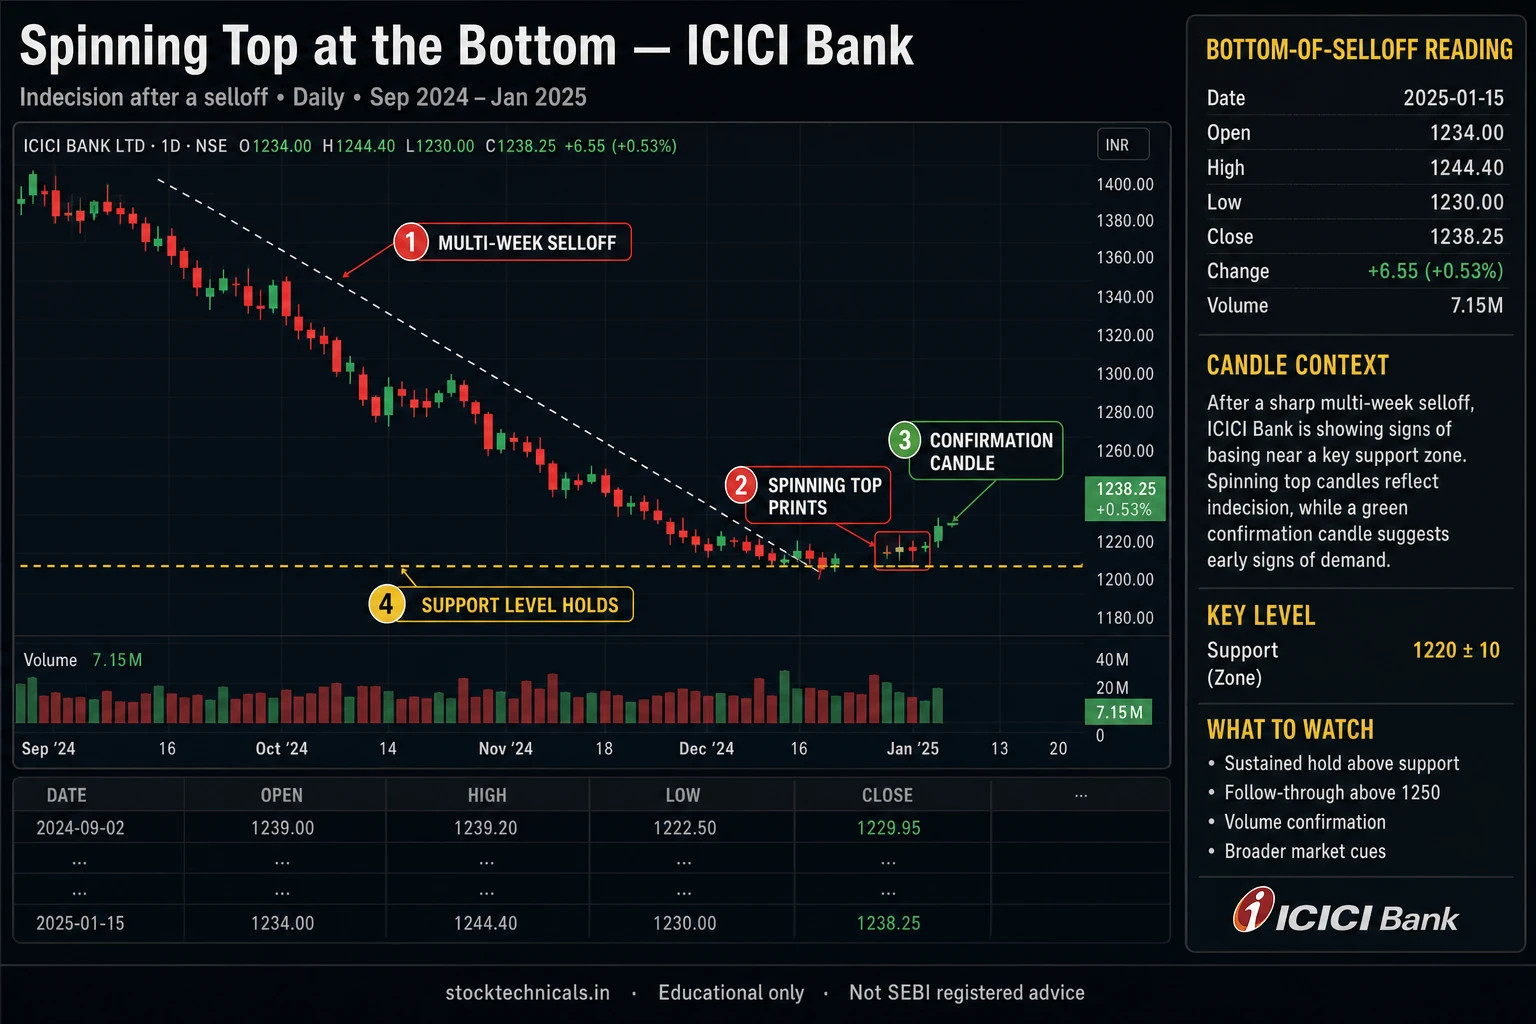
Spinning Top at Trend Bottoms (Bullish Reversal)

High Wave Examples

NHPC on February 5, 2024: high wave candle after a 65.2% power sector rally. -12.7% reversal in 20 sessions. A high-probability reversal given the extreme prior rally. When public-sector stocks run 65% in a short period, exhaustion is almost inevitable — the high wave marked the exact top.
National Aluminium on April 7, 2025: high wave after a 27.6% decline. +8.4% modest reversal — valid pattern, modest result. Not every high wave produces dramatic moves. Recent example confirming the pattern still works in 2025.
Spinning Top vs Doji vs High Wave
These three patterns all signal indecision but differ in body size:
Doji: Body is essentially zero (open = close). Maximum indecision. Body < 5% of range.
Spinning Top: Small body (5-30% of range) with long wicks on both sides. Moderate indecision.
High Wave: Small body (5-20% of range) with extreme wicks (combined >3x body). High volatility indecision.
All three carry similar signal WEIGHT at trend extremes. The key is location, not the specific sub-type.
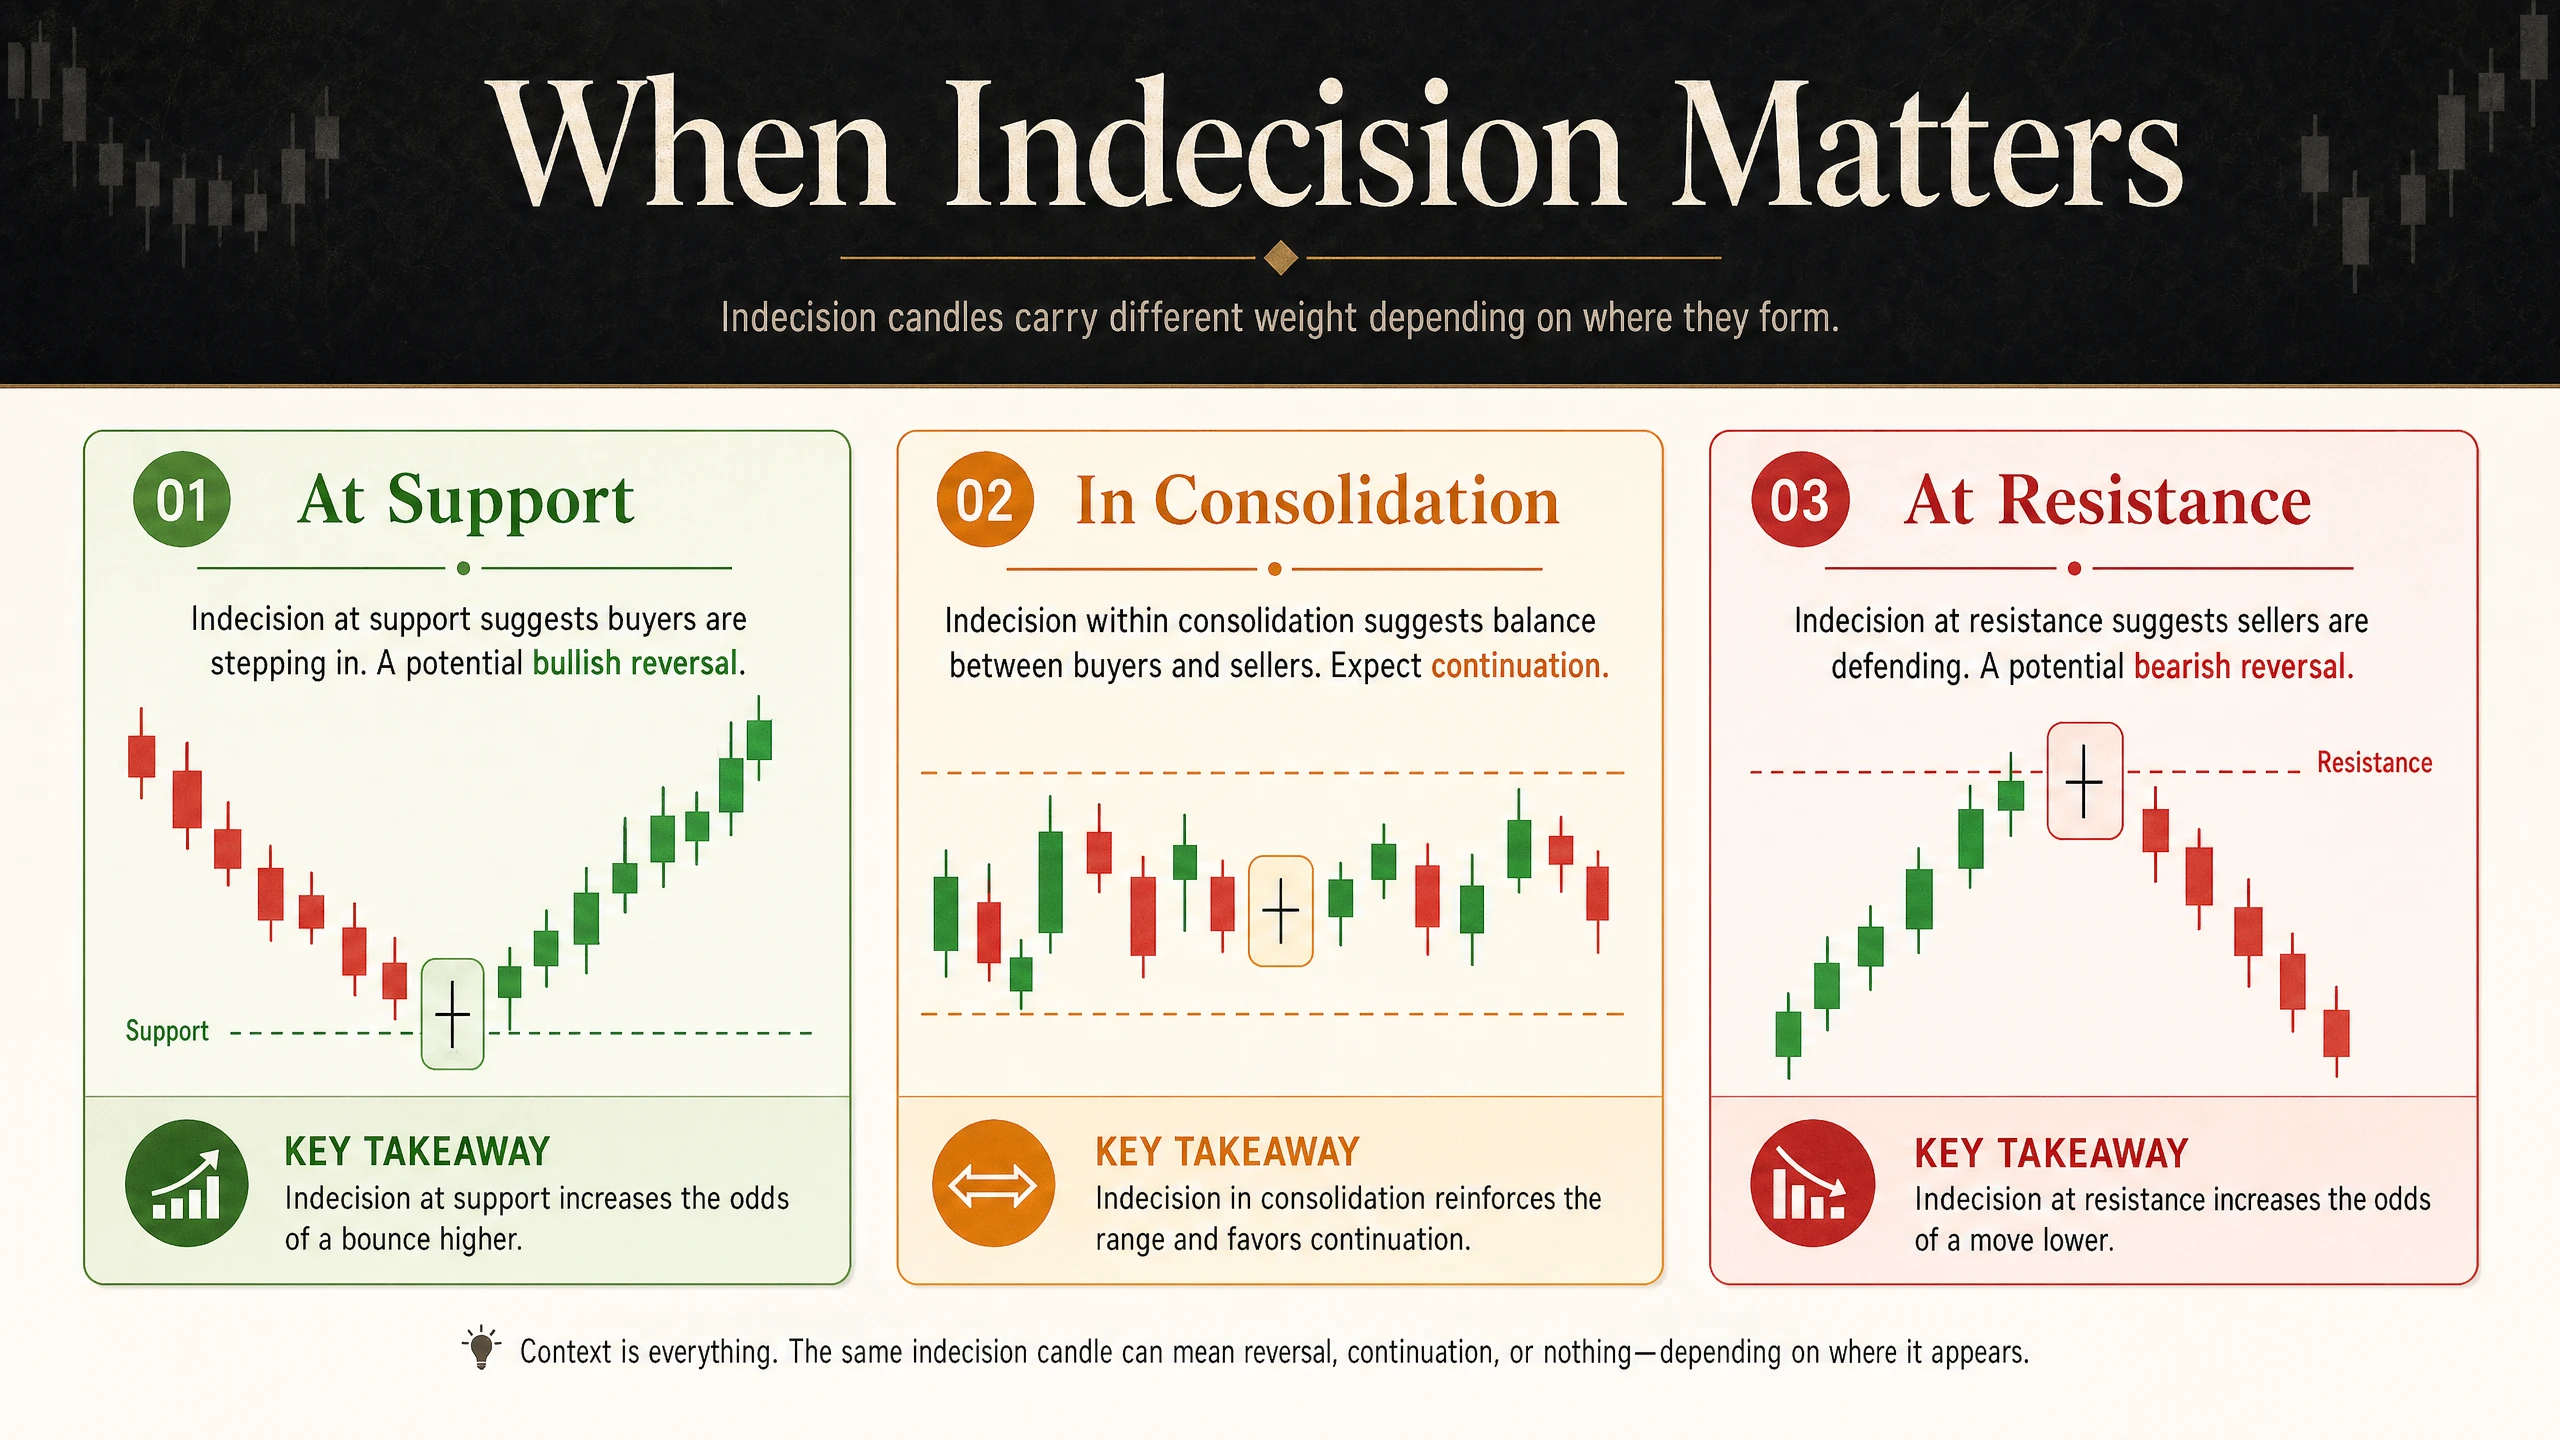
When Indecision Matters (and When It Does Not)
Matters: At Trend Extremes
A spinning top at a 20-day high (after a clear rally) signals sellers have entered and the rally may be exhausted. A spinning top at a 20-day low (after a decline) signals buyers may be stepping in.
Matters: At Support or Resistance
A spinning top forming right at a known S/R level doubles the signal weight — structural resistance + candle indecision = likely reversal.
Matters: At Breakout/Breakdown Zones
A spinning top immediately after a breakout signals the breakout is losing steam — possible false breakout warning.
Does NOT Matter: Mid-Trend or Sideways
A spinning top in the middle of a sideways market is just normal volatility. Only ~40% of all spinning tops are at trend extremes — the other 60% are noise. Filter ruthlessly.
Combining with Other Tools
Bollinger Bands Confluence
A spinning top or high wave touching the upper Bollinger Band is a high-probability reversal signal. Same for a pattern touching the lower Bollinger Band during a decline.
RSI Divergence
Spinning top at a price high combined with bearishRSI divergence (price higher, RSI lower) is one of the strongest reversal combinations.
Volume Context
Low-volume spinning tops are weaker signals. Above-average volume shows both buyers and sellers are engaged — genuine indecision, not thin-market noise.
Timeframe Considerations
Daily (Standard)
All examples in this article use daily charts. Daily spinning tops and high waves are the standard signal timeframe.
Weekly (Most Powerful)
Weekly spinning tops are significant — five days of indecision compressed into one candle. When they form at a weekly S/R level or major trendline, they can mark multi-month reversals.
Intraday (Noisy)
On 15-minute charts, spinning tops appear constantly — they are often just session transitions (pre-lunch, post-lunch, closing hour). Use with extreme skepticism on intraday.
Complete Trading Plan
Entry Rules
Spinning top / high wave at trend extreme + confirmation in next 1-2 sessions. Enter on the confirmation candle (red next day after spinning top at top, or green next day after spinning top at bottom).
Stop Loss
Beyond the wick extreme. For bearish signal: stop above the upper wick. For bullish signal: stop below the lower wick. Tight stops because these patterns have wide wick-based ranges.
Target
Next support or resistance level. Minimum 2:1 risk-reward. Scale out at the previous swing high/low for the first target.
Common Mistakes
Mistake: Trading Mid-Trend Spinning Tops
60% of spinning tops are not at trend extremes. Do not take them as reversal signals. Require clear prior trend + pattern at 20-day extreme.
Mistake: Ignoring the Next Candle
Spinning top by itself is INDECISION. Without next-day confirmation (price moving in expected direction), there is no directional signal. Always wait for confirmation.
Mistake: Using Wide Stops
The long wicks create natural stop placement at the wick extremes. Do not use wider stops — if price breaches the wick extreme, the indecision has resolved against you, and the signal has failed.
Interactive Tool
The Bottom Line About Spinning Top and High Wave
Spinning tops and high waves are the most context-dependent candlestick patterns. By themselves they are just indecision — small body, long wicks, neither side winning. The pattern carries no directional meaning in isolation. But AT TREND EXTREMES, indecision often precedes reversal — because when a strong trend suddenly shows indecision, something has changed.
Our NSE audit data shows this clearly. 5,358 spinning tops and 336 high waves passed the reversal test — but they all share the same critical feature: they formed at a 20-day extreme with prior opposing trend. The strongest signal in our entire candlestick audit was a spinning top (Suzlon, +85.5% rally). The pattern works — but only at extremes.
With 91% of individual F&O traders losing money per SEBI, a big part of that loss is from trading indecision as if it were direction. A spinning top alone tells you nothing. A spinning top at a 20-day high after a 20% rally tells you something important. Know the difference — and always wait for the next-day confirmation before committing capital.
Frequently Asked Questions
| Candle type | Body size | Wick length | Signal |
|---|---|---|---|
| Spinning Top | Small | Moderate both sides | Mild indecision |
| High Wave Candle | Tiny | Very long both sides | Extreme indecision |
| Doji | None (open=close) | Variable | Pure indecision |
“In a bull market, your job is to be long. To try and call the top is the most lucrative way to lose money.”
— Stanley Druckenmiller, interview
What is the difference between a spinning top and a doji?
A doji has a body that is essentially zero (open equals close, body less than 5 percent of range). A spinning top has a small but visible body (5-30 percent of range). Both signal indecision but the doji is more extreme. A high wave sits between them geometrically but with extreme wick lengths.
What is a high wave candle?
A high wave candle is an extreme form of spinning top. It has a small body (less than 20 percent of range) AND combined wicks exceeding 3x the body length. The candle looks almost like a plus sign. It signals maximum intraday volatility and extreme indecision.
Do spinning tops always signal reversal?
No. Spinning tops in the middle of a sideways market are just noise — not reversal signals. Only spinning tops at trend EXTREMES (20-day high after uptrend, 20-day low after downtrend) qualify as reversal signals. Our audit found only about 40 percent of spinning tops are at trend extremes.
What is the strongest signal in the audit?
Suzlon Energy on May 15, 2023 — a spinning top at the bottom of a 7.9 percent decline, followed by an 85.5 percent rally in 20 sessions. The strongest bullish spinning top in our audit across all patterns. Small-cap renewable energy names can produce monster moves.
Should I trade a spinning top on intraday charts?
With extreme skepticism. On 15-minute charts, spinning tops appear constantly at session transitions (pre-lunch, post-lunch, closing hour). Most are noise. Daily and weekly spinning tops are much more reliable.
How do I confirm a spinning top signal?
Wait for the next candle. At an uptrend top, the next candle should be red and close below the spinning top low — confirming the reversal. At a downtrend bottom, the next candle should be green and close above the spinning top high.
Where should I place my stop loss?
Beyond the wick extreme. For bearish signal: stop above the upper wick tip. For bullish signal: stop below the lower wick tip. The long wicks create natural stop-loss levels. Tight stops are essential because the pattern range is already wide.
Continue Learning
For the opposite (momentum):Marubozu — no wicks, full-body dominance.
For extreme indecision:Doji — the purest form of indecision.
For single-candle reversals:Hammer and Hanging Man,Shooting Star vs Inverted Hammer.
For context:Support and Resistance,Bollinger Bands,Volume in Trading.
Indecision patterns require confirmation. A spinning top alone says nothing about direction — the next candle reveals the winner. Markets are unpredictable, capital is finite, and no pattern guarantees profit. Past performance does not predict future results. Always define your stop loss before entering and never risk more than you can afford to lose.