
If a stock has been stuck in a tight range for weeks and then suddenly surges past its ceiling with massive volume — that is a breakout: price moving decisively above resistance or below support with strong volume confirmation.
Quick Answer: A breakout is the moment price moves decisively above resistance or below support with strong volume confirmation, marking a shift in the balance between buyers and sellers. Genuine breakouts print volume at least 1.5 to 2 times the 20-day average, close in the upper quarter of the range, and hold on the retest. On NSE stocks like Reliance, Tata Steel, or the Nifty 50, volume-confirmed breakouts separate tradeable moves from the false signals that trap most retail traders.
Breakouts are among the most powerful signals in technical analysis because they mark the moment when the balance of power shifts between buyers and sellers. A resistance level that held for weeks or months has just been violated, and the stock is entering new territory.
Here is the hard truth: not every breakout is real. Per the latest SEBI study covering FY24-25, 91 percent of individual equity F&O traders lost money, with aggregate losses of ₹1.06 lakh crore — and chasing false breakouts is one of the biggest reasons. This article breaks down exactly how to tell the difference between a genuine breakout and a trap, using real price data from NSE stocks like Reliance Industries, Tata Steel, ITC, and the Nifty 50 (NSE: NIFTY 50) index.

Key Takeaways
- A breakout occurs when price moves beyond a defined support or resistance level: Breakouts signal the potential start of a new trend move, with the broken level becoming the new reference point.
- Volume is the most critical breakout confirmation: A breakout with volume 1.5 to 3 times the 20-day average is far more likely to sustain than a low-volume breakout, which often fails.
- False breakouts are common and must be managed with stop losses: On NSE, false breakouts frequently trap retail traders. Always use a stop loss just inside the broken level to limit damage from failed breakouts.
- The best breakouts occur after extended consolidation: When a stock trades in a tight range for weeks and then breaks out, the pent-up energy creates powerful directional moves.
- Retest of the breakout level provides a second entry opportunity: After a genuine breakout, price often pulls back to retest the broken level before continuing in the breakout direction — this retest is often a safer entry than the initial breakout.
How a Breakout Works
A breakout occurs when price moves beyond a defined level — either above resistance (a price level where selling pressure has previously stopped upward movement) or below support (a price level where buying pressure has prevented further decline).
Think of it like a dam holding water. Price keeps pushing against resistance but keeps getting rejected. Eventually, the pressure becomes too great. The dam breaks. Water floods through. That is a breakout.
For a breakout to be meaningful, three conditions must align:
- A clearly defined support or resistance level must exist — visible on stock charts as a horizontal line or zone where price has been rejected at least twice.
- Price must close beyond that level, not just poke above it intraday.
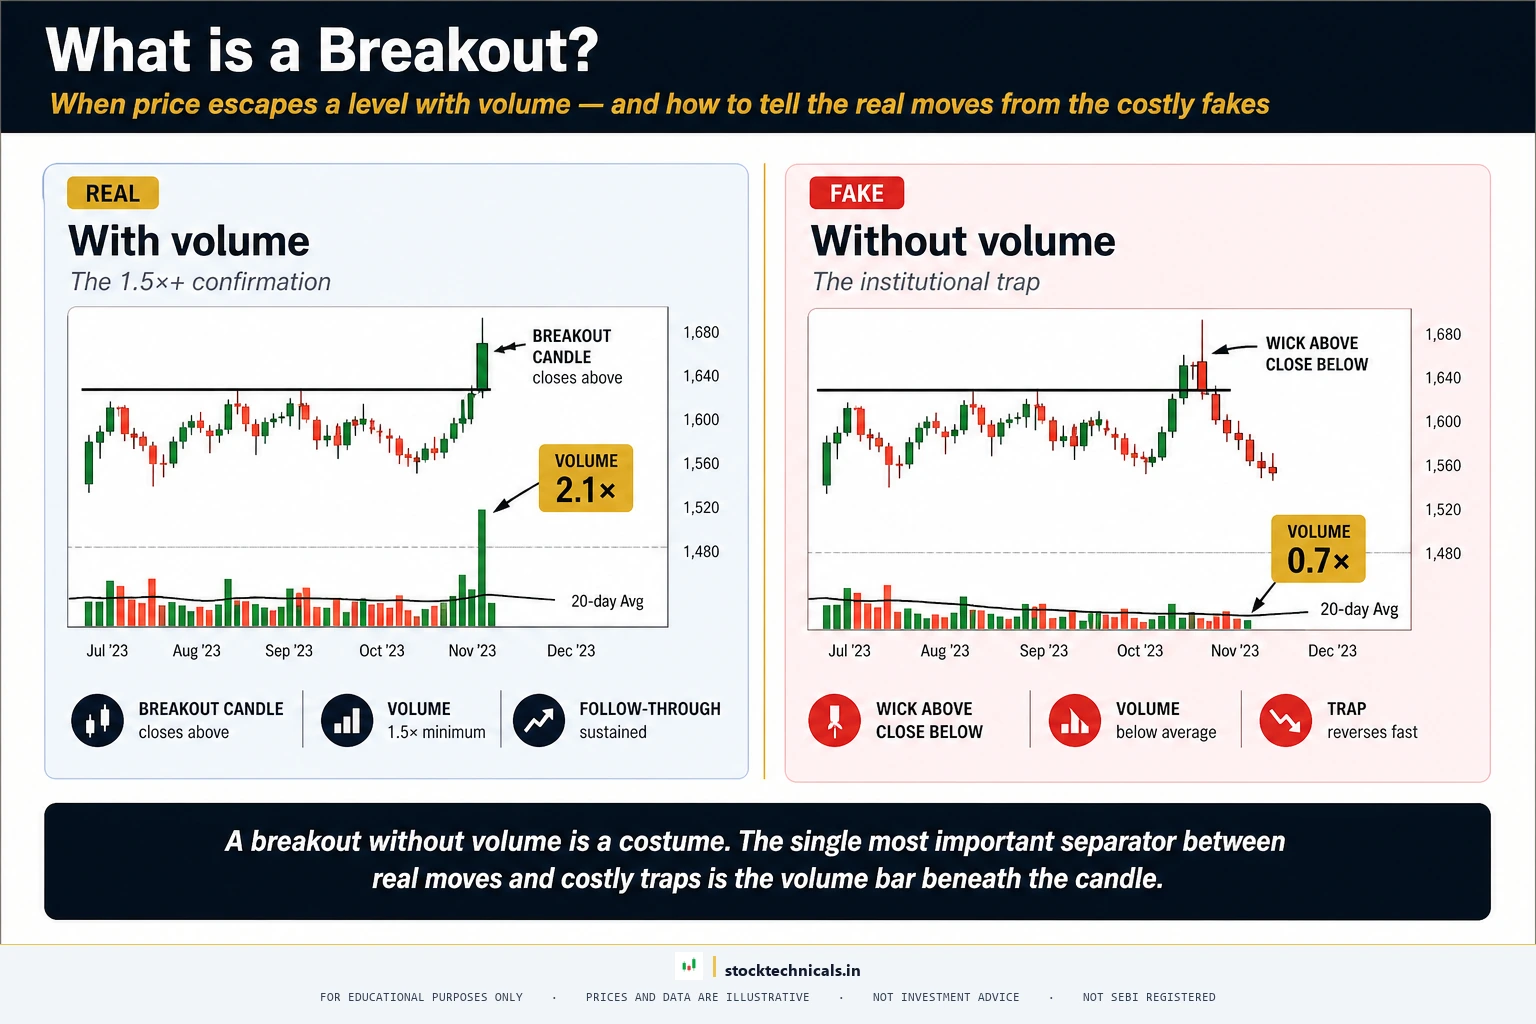
- Volume must confirm the move — this is the single most critical factor that separates real breakouts from traps.
When Reliance Industries broke above the ₹620 resistance on April 22, 2020, the stock gapped open at ₹651.37 and closed at ₹672.89 on volume of 13.22 crore shares — 3.2 times the trailing 20-day average volume of 4.14 crore shares. The catalyst was the previous evening’s Facebook-Jio Platforms investment announcement (April 21, 2020 US time, overnight for Indian markets), which triggered the next-day gap-up. That combination of decisive close, above-average volume, and a genuine institutional catalyst was the signal that smart money was driving the move, not retail speculation.
Volume Confirmation: The Single Most Important Factor
Volume is to breakouts what fuel is to a rocket launch. Without adequate volume, a breakout has no thrust behind it — and it will likely fall back. For a deeper treatment of volume analysis, see the volume in trading guide.

Here is why volume matters so much during breakouts:
High volume on the breakout day confirms conviction. When Tata Steel broke above the psychological ₹50 level on November 17, 2020, the stock opened at ₹50.60, hit a high of ₹53.10, and closed at ₹52.27 on volume of 64.28 crore shares — 3.3 times the trailing 20-day average volume of 19.24 crore shares. That kind of participation means large institutions, mutual funds, and FIIs are all involved simultaneously.
Low volume breakouts are warnings. If price creeps above resistance but volume is average or below average, the breakout lacks institutional backing. These are the breakouts that most often reverse back into the range within one to three trading sessions.
The volume confirmation rule: On the breakout candle, volume should be at least 1.5 times the 20-day average volume. Ideally, it should be 2 to 3 times. Anything less deserves extreme caution.
Volume should taper after the breakout, not spike higher. After the initial breakout day, volume should gradually decrease as the stock trends higher. If volume keeps spiking in the days after the breakout while price stalls, it can indicate distribution — smart money selling into retail enthusiasm.
How to Read Volume on TradingView
Open TradingView and load the stock chart. Volume bars appear at the bottom by default. Green bars indicate the close was above the open. Red bars indicate the close was below.
To add a 20-period volume moving average, click on the volume panel and overlay a 20-period SMA. This gives a baseline to compare breakout volume against average volume. For how moving averages work generally, see EMA basics and SMA vs EMA.
Types of Breakouts
Not all breakouts look the same. Each type has different reliability, expected follow-through, and optimal entry strategies.

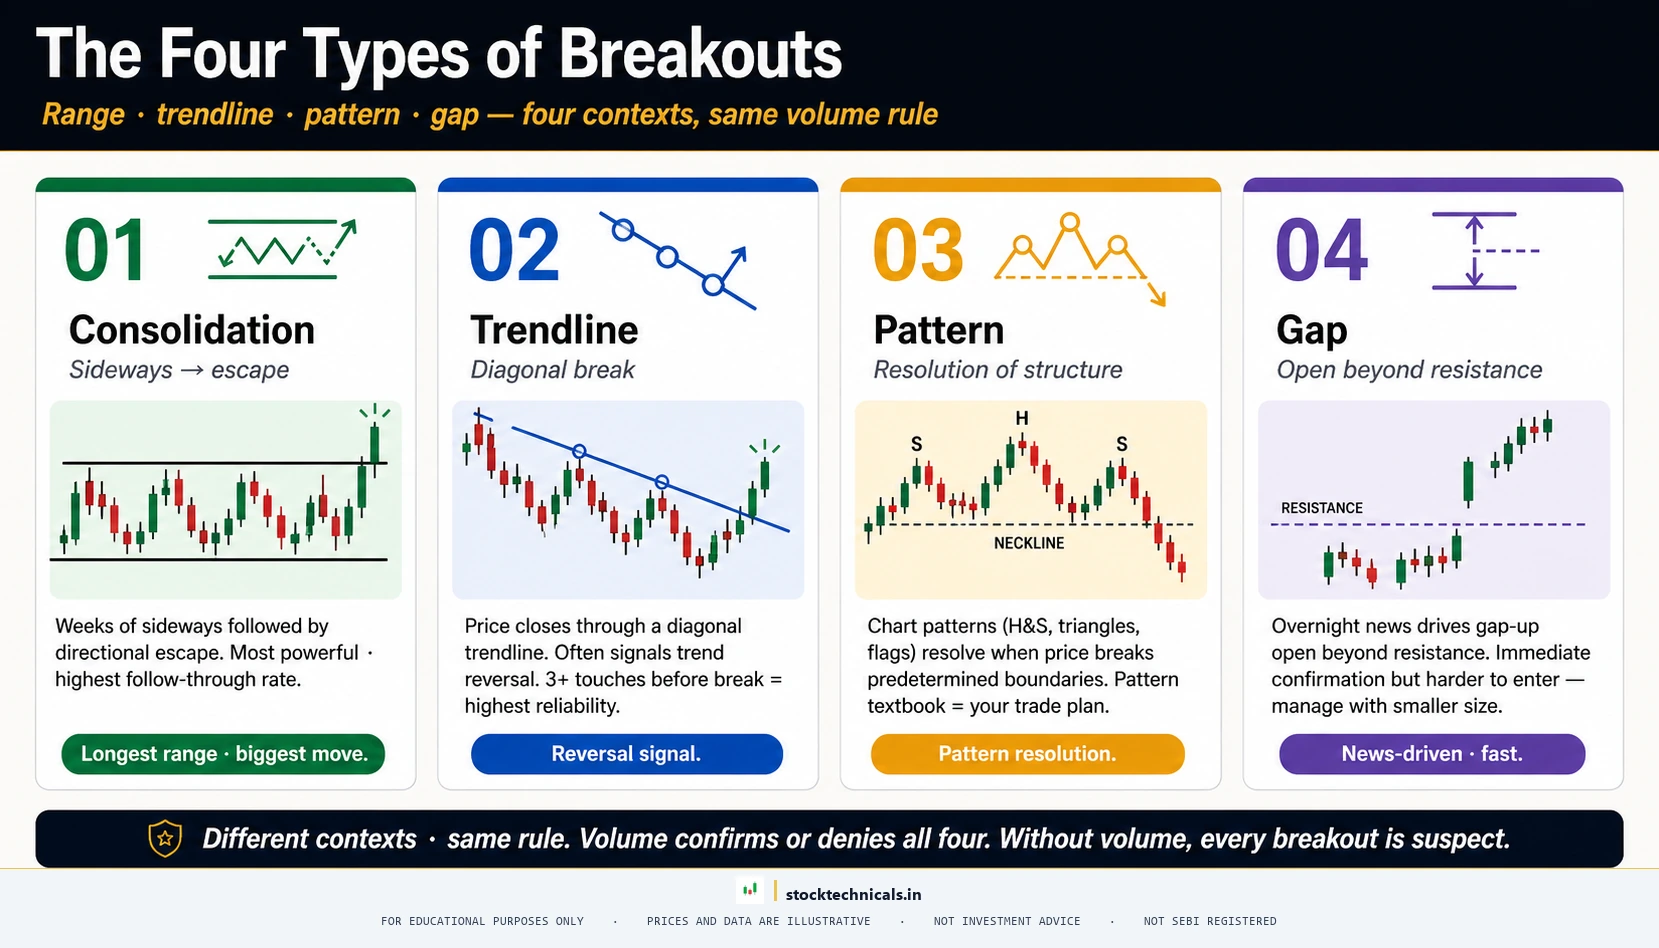
Consolidation Breakout (Range Breakout)
This is the most common and arguably the most reliable breakout pattern. Price trades sideways within a defined range — bouncing between support and resistance — for an extended period. Then it breaks out.
ITC is the textbook example. After the March 2020 COVID crash took the stock to an intraday low of ₹134.60 (closing low ₹147.25 on March 16, 2020), ITC spent the next 26 months rebuilding structure between approximately ₹200 and ₹275, with the ₹275 zone acting as stiff resistance on multiple tests from late 2021 through June 2022. On July 1, 2022, ITC finally closed at ₹284.35 on volume of 3.52 crore shares — 3.0 times the trailing 20-day average of 1.17 crore shares — clearing that ceiling decisively. By July 20, 2023, the stock had rallied to a peak close of ₹492.15 — a 73 percent gain over 12 months, proof of how much energy a prolonged base can store.
The longer the consolidation, the more powerful the eventual breakout tends to be. A 3-month range breakout might give a 10 to 15 percent move. A multi-year consolidation breakout can deliver 50 to 100 percent or more.
Trendline Breakout
A trendline connects a series of swing highs (in a downtrend) or swing lows (in an uptrend). When price breaks through this diagonal line, it signals a potential trend reversal.
Trendline breakouts require careful drawing. A valid trendline must connect at least three touch points, and the breakout should occur on a closing basis, not just an intraday poke.
Pattern Breakout
Chart patterns like triangles, flags, pennants, and wedges all resolve through breakouts. The pattern provides a framework for where the breakout should occur and what the expected target might be.
Gap Breakout
A gap breakout occurs when price opens significantly above resistance (or below support) on the next trading day, creating a visible gap on the chart. These are particularly common during earnings season or after major news events. Indian market hours are 9:15 AM to 3:30 PM IST, so any news between Friday’s close and Monday’s open creates gap potential. The Reliance April 22, 2020 breakout is actually a gap breakout — the stock closed at ₹610.59 on 21 April and opened at ₹651.37 on 22 April after the Facebook-Jio announcement.
Breakout Entry Strategies
Knowing what a breakout is means nothing without a clear entry plan. Three primary approaches exist, each with different risk-reward characteristics.

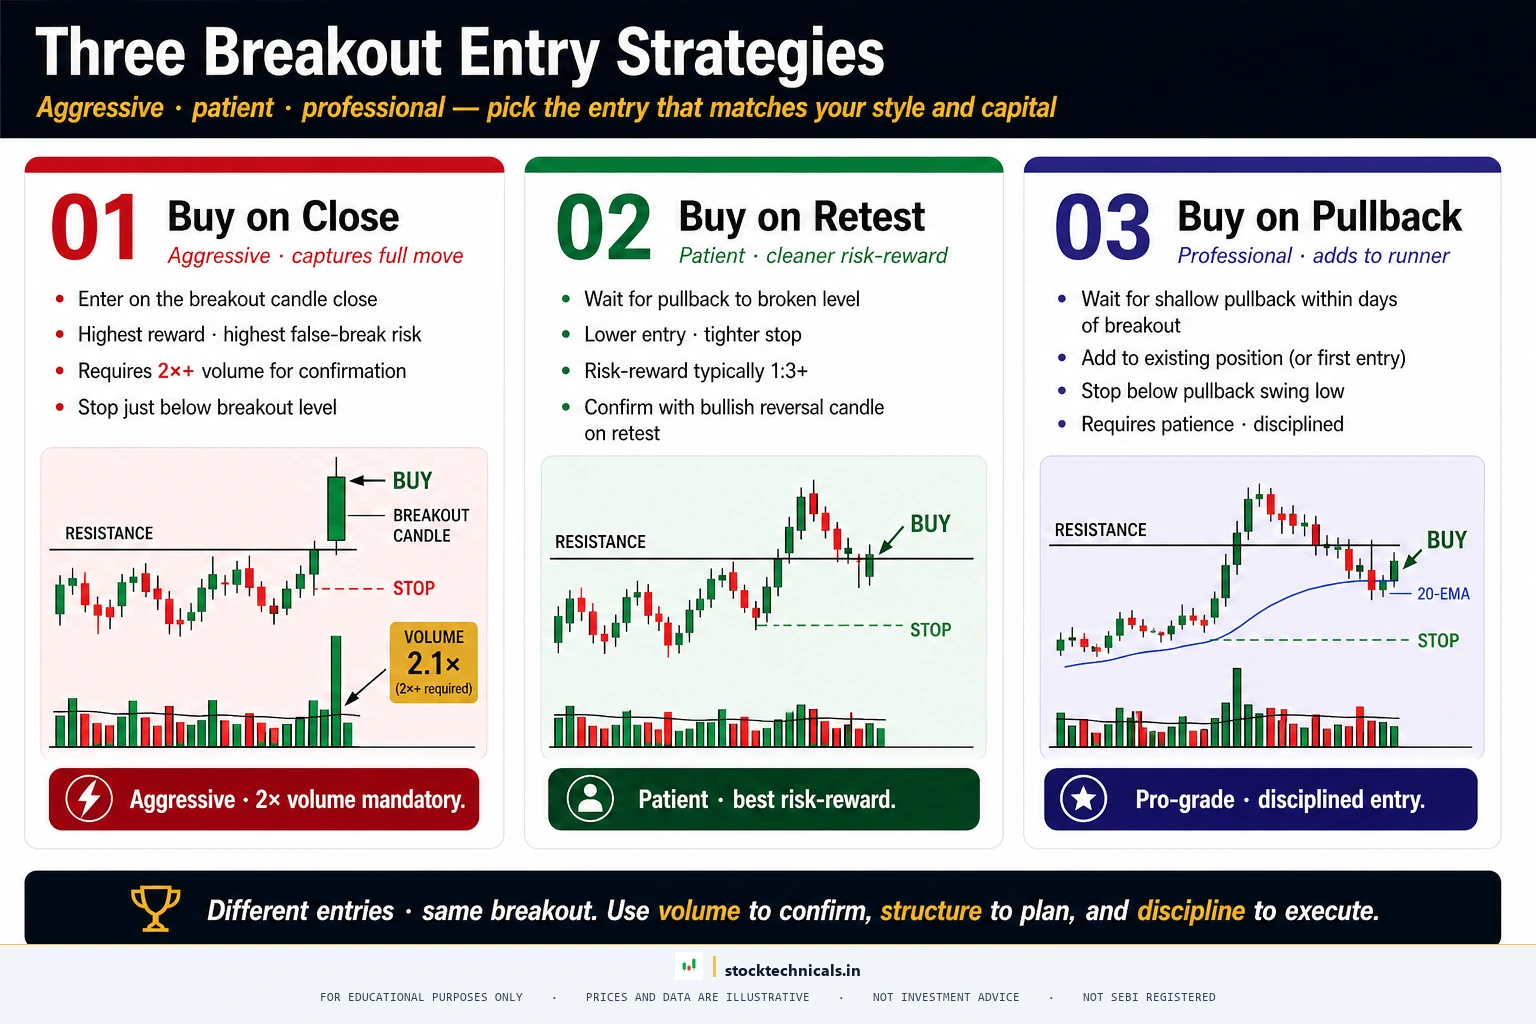
Buy on Close Above Resistance
The most aggressive approach. Enter a long position when the candle closes above resistance. This captures the initial thrust of the breakout.
When to use: Only when volume confirmation is overwhelming (2 to 3x average) and the breakout candle has a strong body with minimal upper wick.
Buy on Retest
After a breakout, price often pulls back to test the broken resistance level, which now acts as support. This retest entry is the most popular among professional traders because it offers a tighter stop-loss and cleaner risk-reward.
Reliance Industries demonstrated this pattern repeatedly during its rally from ₹620 to ₹1,162 in 2020. After the 22 April breakout candle, RIL pulled back over several sessions in early May to find support around ₹700 — the zone that had been resistance during the April 23-24 consolidation — before resuming its advance. By September 16, 2020, the stock had closed at an all-time high of ₹1,162.28, delivering a 73 percent gain from the breakout close.
Buy on Pullback After Breakout
Similar to the retest strategy, but instead of waiting for an exact retest of the breakout level, the trader enters on any pullback within the first few candles after the breakout.
Stop-Loss Placement on Breakouts
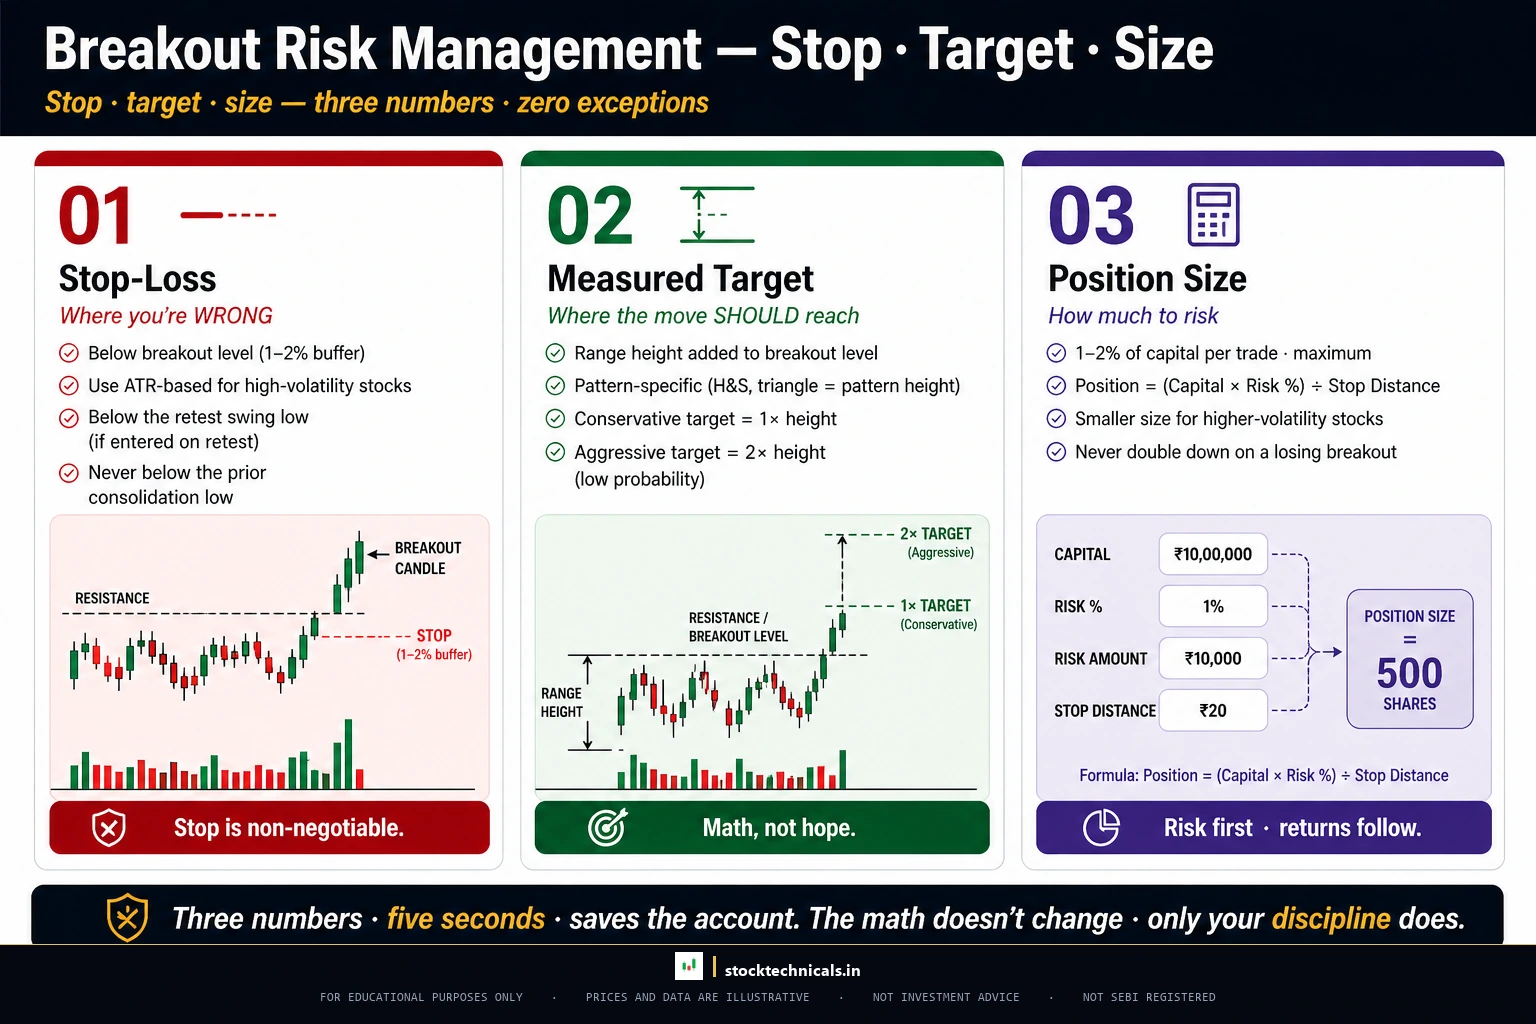
Every breakout trade must have a predefined stop-loss before entry. No exceptions.
For upside breakouts: Place the stop-loss just below the breakout level (the old resistance). If a trader buys a stock that broke above ₹500, the stop-loss goes at ₹495 or ₹490, depending on normal volatility for that stock.
For consolidation breakouts: The stop-loss goes below the lower end of the consolidation range. This is a wider stop but offers greater protection against volatile retests.
ATR-based stops: More sophisticated traders use the Average True Range (ATR) indicator to set stops. A common approach is to place the stop 1.5x ATR below the breakout level.
The golden rule: Never move a stop-loss further away from entry after the trade is open. Only move it closer (trailing stops) or leave it where it was set at entry.
Breakout vs False Breakout
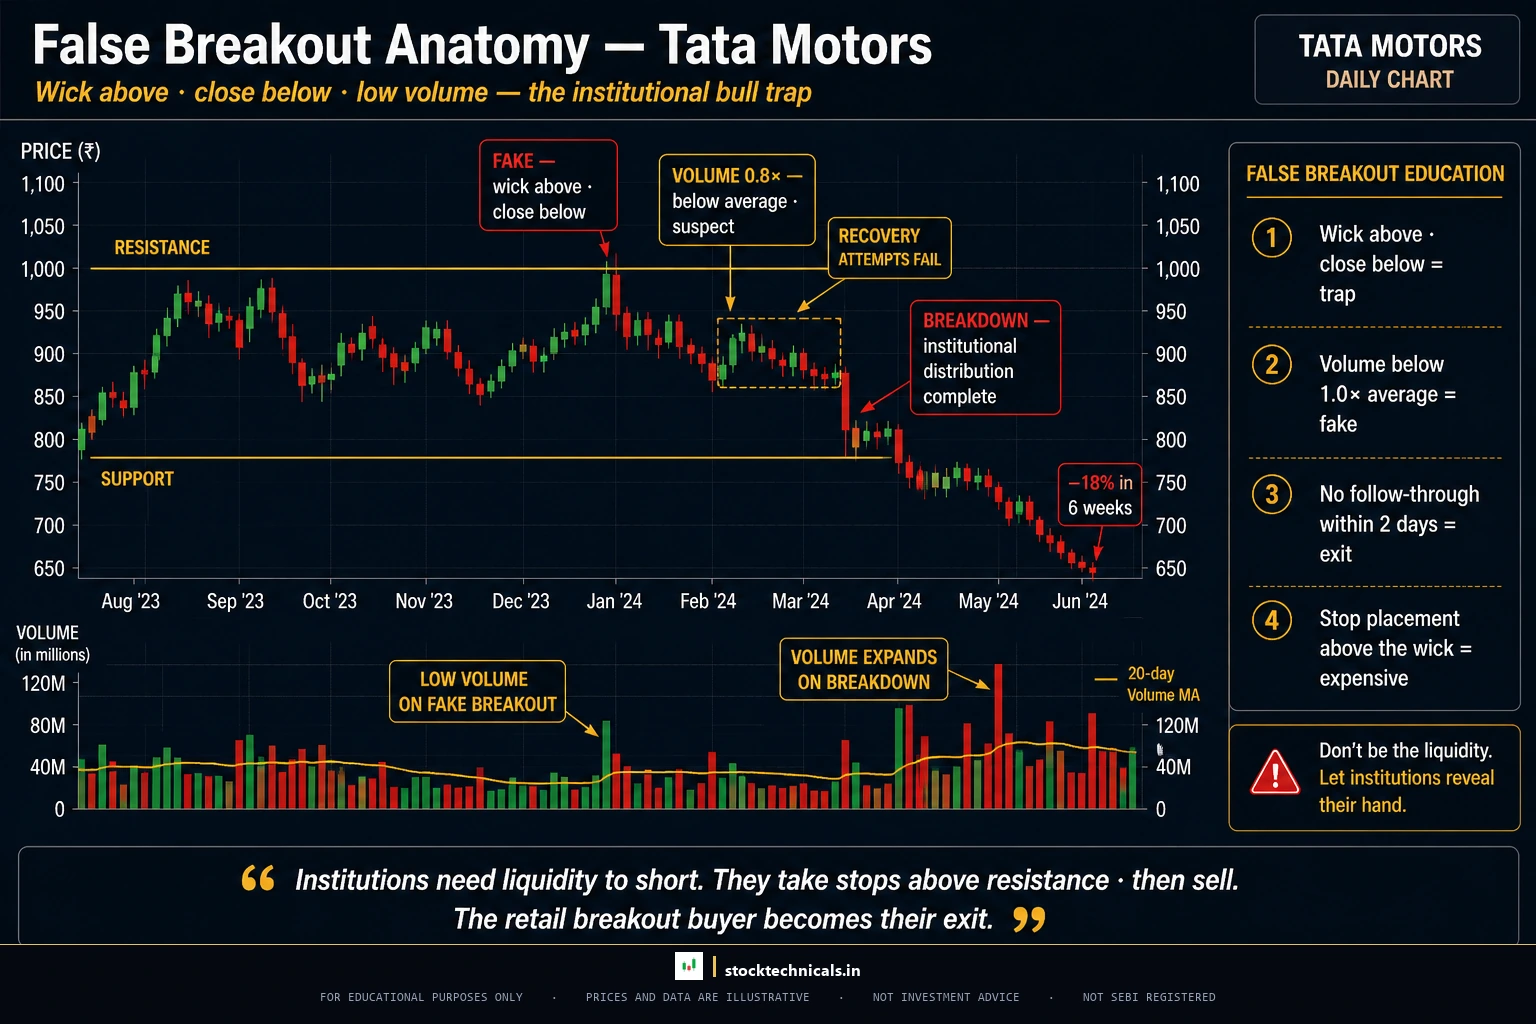

A false breakout (also called a fake-out or bull/bear trap) occurs when price briefly moves beyond a support or resistance level but then quickly reverses back into the range. False breakouts exist because markets are designed to trap the majority.
The most famous recent false breakout in Indian markets was Nifty 50 on October 19, 2021. The index gapped above the 18,500 ceiling, printed an intraday high of 18,604 — an all-time high at the time — but reversed in the afternoon session and closed at 18,419, back below the previous day’s high. That single long upper wick was the top of the post-COVID bull run. Over the next nine weeks, Nifty fell to 16,410 by December 20, 2021, a 11.8 percent decline. The 18,604 high was not taken out on a closing basis until November 29, 2022 (close 18,618) — more than 13 months later. Traders who chased the initial pierce spent over a year underwater. For a detailed look into trap dynamics, see the dedicated guide to false breakouts, bull and bear traps.

Here is how to distinguish genuine breakouts from false breakouts:
Volume tells the truth. Real breakouts happen on significantly above-average volume. False breakouts typically occur on average or below-average volume.
The close matters more than the high. A candle that has its high above resistance but closes back below it is not a breakout — it is a rejection. Wait for a decisive close above the level.
Time confirmation. Two consecutive closes above the level dramatically increase the probability that the breakout is genuine.
Wick analysis. Long upper wicks on the breakout candle are warning signs. A healthy breakout candle has a large body and short wicks.
Why False Breakouts Happen
False breakouts are not random. They serve a purpose in market structure: stop-loss hunting (large players push price above resistance to trigger orders), retail traps (breakout traders pile in and smart money distributes), and exhaustion moves (the final push by the last buyers before reversal).
Breakout Trading on Different Timeframes
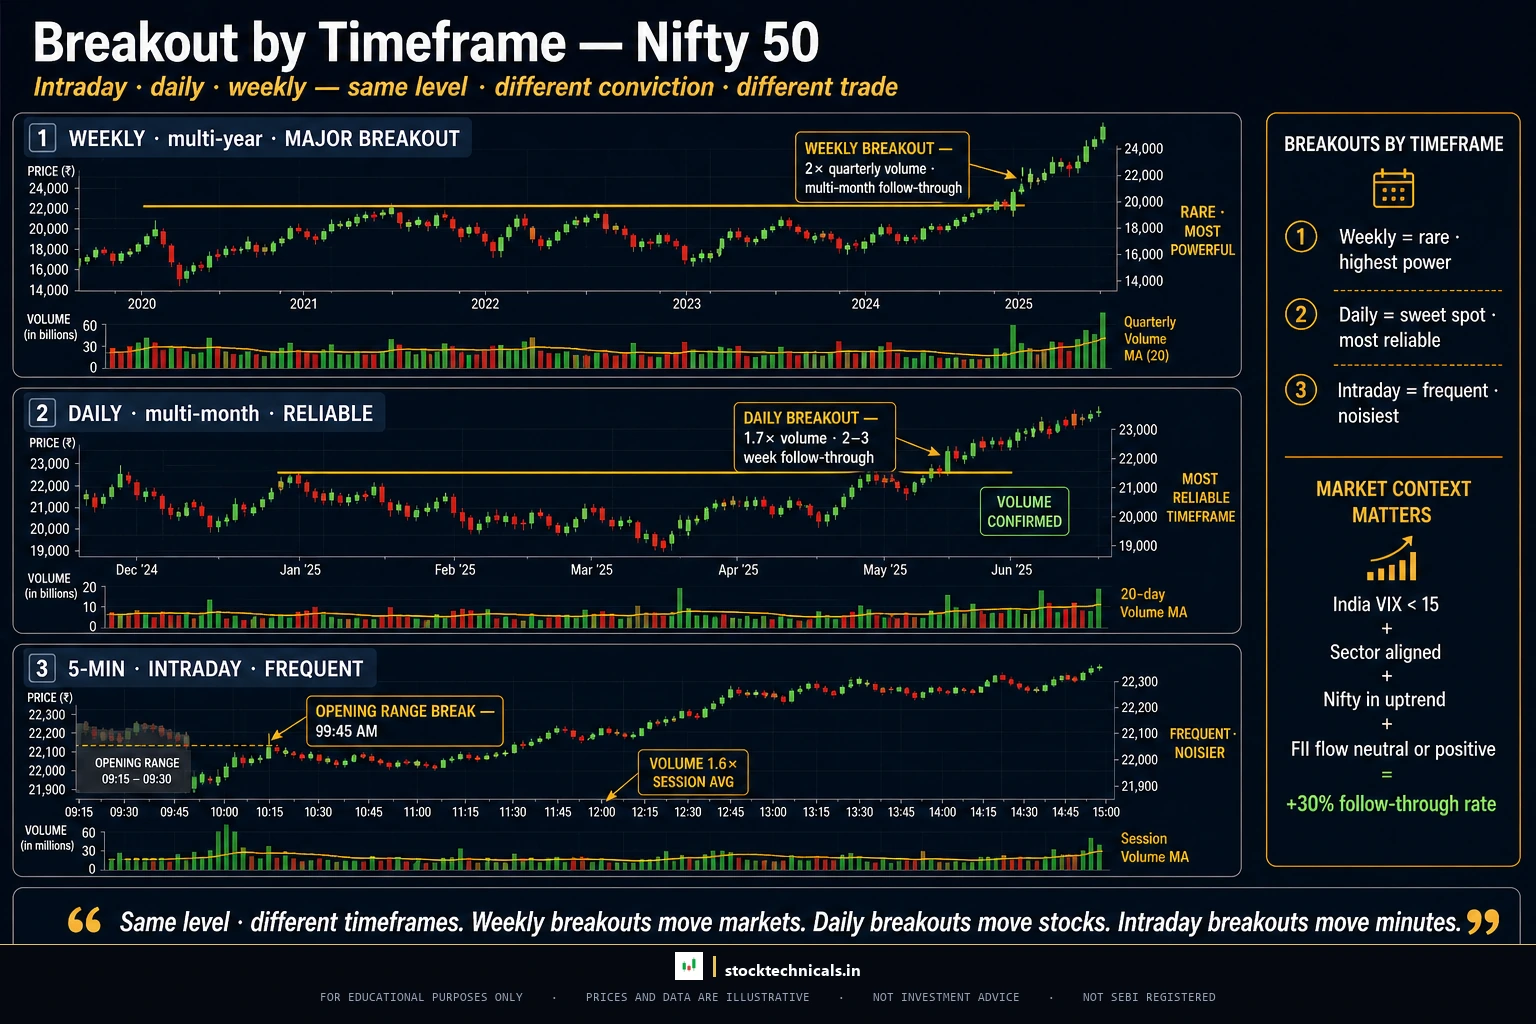
The same breakout principles apply across all timeframes, but with different implications for trade duration and risk.

Intraday Breakouts
On the 5-minute chart, breakouts happen frequently. The opening range breakout (ORB) is among the most popular intraday trading setups on the NSE: identify the high and low of the first 15 or 30 minutes, then trade the breakout in either direction.
| Feature | True Breakout | False Breakout (Fakeout) |
|---|---|---|
| Volume | 1.5-3x above 20-day average | Below or near average volume |
| Candle Close | Strong close beyond level | Wick-heavy, close near level |
| Retest Behavior | Holds above broken level | Falls back within 1-2 candles |
| Follow-Through | Next 2-3 candles continue | Immediate reversal |
| Market Context | Trending market, sector strength | Choppy, no sector support |
| OI Change (F&O) | Fresh OI buildup in direction | OI unwinding or flat |
Daily Chart Breakouts
The daily chart is the most popular and reliable timeframe for breakout trading. All the stock examples discussed in this article — Reliance, Tata Steel, ITC — are daily chart breakouts. This is the timeframe where the volume confirmation rule is most reliable.
Weekly Chart Breakouts
Weekly chart breakouts are rare but extremely powerful. They signal major structural shifts and lead to multi-month trending moves. Tata Steel’s weekly ₹50 breakout in November 2020 delivered a rally to approximately ₹140 by July 2021 — seven months of sustained trend. Best for positional traders seeking the highest risk-reward ratio.
Breakout Trading and Market Context
Breakouts do not happen in a vacuum. Sector alignment matters — when Tata Steel broke out in November 2020, the entire Nifty Metal Index was also breaking out on the commodity super-cycle. FII flow direction creates the volume thrust needed for follow-through. India VIX levels affect reliability — moderate VIX (15-25) is the sweet spot for breakout trading. This is where price action trading discipline pays off — reading the chart in the context of the broader market, not in isolation.
Moving averages add powerful confirmation. Only trade upside breakouts when the stock trades above its 200-day EMA. When Reliance broke above ₹620 on April 22, 2020, it was also crossing back above its 200-day EMA — a dual confirmation that created an extremely high-probability setup.
The Measured Move Technique
The measured move gives a minimum price target after a breakout. Measure the height of the consolidation range and add it to the breakout level.

Example: ITC consolidated between ₹200 (lower support) and ₹275 (upper resistance) for roughly 26 months following the March 2020 COVID crash. Range height equals ₹75. Breakout level equals ₹275. Minimum target equals ₹275 + ₹75 = ₹350. ITC actually rallied past ₹492 by July 2023 — a 40 percent overshoot of the measured move, which is common when the base was unusually long.
Common Mistakes Traders Make with Breakouts
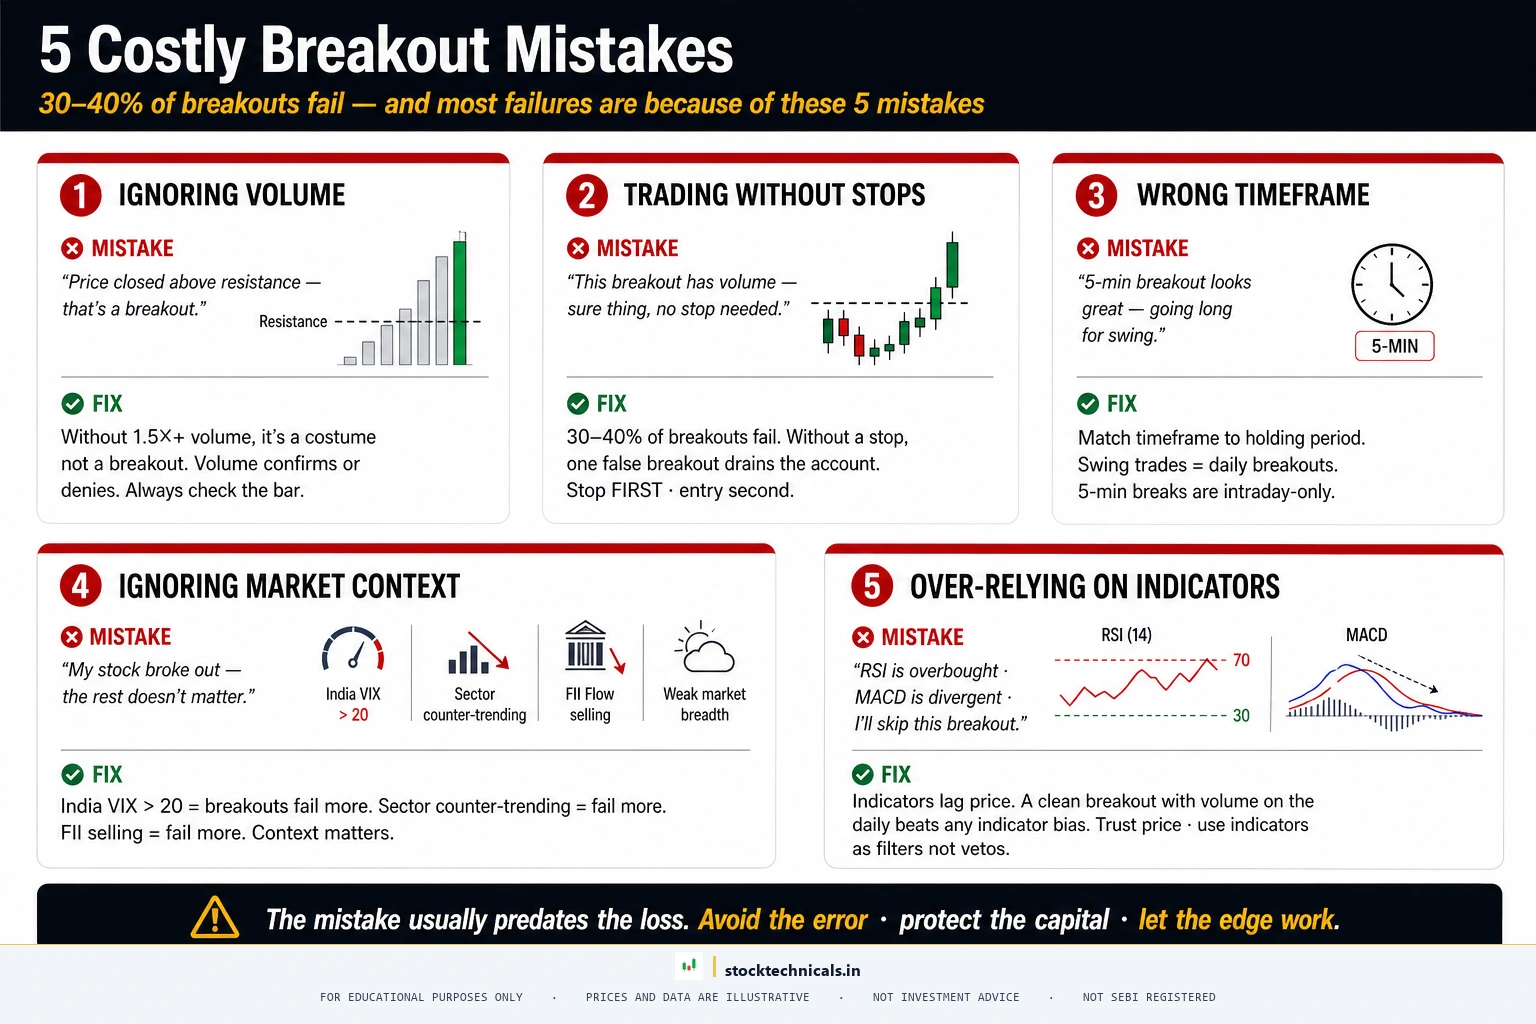

Chasing without volume check. The number one mistake. Always — always — check volume before entering a breakout trade.
No predefined stop-loss. Entering a breakout trade without a stop-loss is gambling, not trading. The stop must be set before entry and respected without exception.
Wrong timeframe. A breakout on the 5-minute chart does not have the same significance as one on the daily chart. Start with daily chart breakouts for identification.
Low-volatility environments. When India VIX is extremely low, breakouts lack follow-through. Check VIX as part of pre-trade analysis.
Overcomplicating with indicators. A breakout is a price-and-volume event. The primary tools are: price levels, volume, and candlestick patterns. Everything else is secondary.
Breakout Trading Checklist
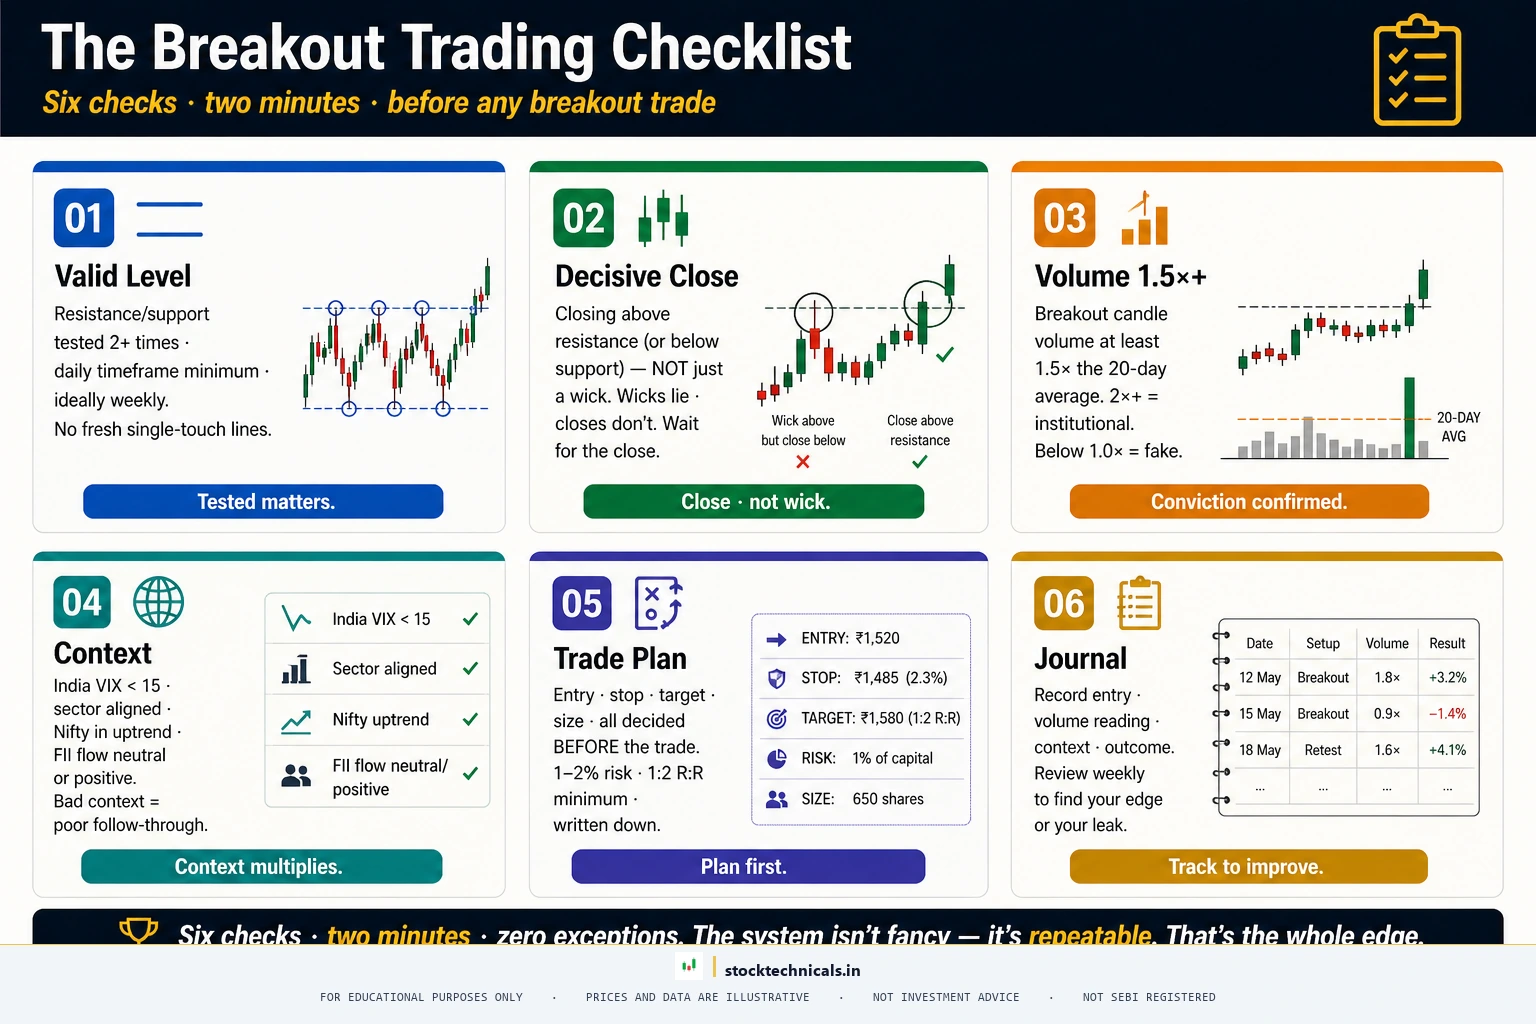

- Level validity: Has price tested this level at least twice before?
- Close confirmation: Did the candle close above resistance (or below support)?
- Volume confirmation: Is volume at least 1.5x the 20-day average?
- Candle quality: Strong body with short wicks?
- Trend alignment: Is the breakout in the direction of the larger trend?
- Stop-loss defined: Is the risk-reward ratio at least 1:2?
If any item on this checklist fails, do not take the trade. Wait for a better setup.
Interactive Tool: Breakout Validator
Paper-trading alone will not teach judgment. Use the Breakout Validator below to grade a live setup you are watching. Answer five questions about volume, close position, level quality, trend alignment, and follow-through — the tool returns an A/B/C/F rating plus specific next actions.
Breakout Validator
The Core Idea
A breakout is when price moves decisively beyond a defined support or resistance level with volume confirmation. The broken level flips its role — old resistance becomes new support.
Grade Your Setup
Answer each question about the breakout you are considering. The validator scores across volume, candle structure, trend alignment, level quality, and retest behavior.
Test Your Breakout Knowledge
Five questions. Pick the best answer. Score 4 or 5 to pass.
How to Practice Breakout Trading
TradingView offers a bar replay feature that lets traders scroll back in time and advance candles one by one. Load a chart, go back 6 months, and practice identifying breakout setups before seeing the outcome. Track results in a trading journal.
Pull up the daily chart of Reliance, TCS, HDFC Bank, Infosys, and ITC. Go back 3 to 5 years. Identify every major resistance level that was eventually broken. Study the volume on the breakout day. This exercise teaches more about breakout behavior than any theoretical article.
Professional breakout traders maintain a watchlist of 10 to 15 stocks approaching key levels. When the breakout occurs, the trader is prepared to act immediately. A good NSE watchlist includes Nifty 50 components plus 10 to 15 active F&O stocks, updated weekly. Set up TradingView with custom breakout alerts for automated monitoring.
The Bottom Line About Breakout Trading
Breakout trading looks simple on historical charts. Every successful breakout looks obvious in hindsight. In real time, it is nerve-wracking.
The uncomfortable reality: even with perfect volume confirmation and strong candle structure, roughly 30 to 40 percent of breakouts fail. This is not a flaw in the strategy — it is the cost of doing business. The winning breakouts (the 60 to 70 percent that work) produce profits that significantly exceed the losses from the failed ones, but only if stop-loss discipline is absolute.
Markets reward patience. Capital lost is gone. Trade only what the chart confirms, never what emotions demand. Per the latest SEBI study, 91 percent of individual equity F&O traders lost money in FY24-25 — position sizing and stop-losses are not optional.
Real Talk: No chart pattern, indicator, or strategy works 100 percent of the time. The SEBI study showing 91 percent of F&O traders lost money in FY24-25 is not a scare tactic — it is a filter. Most of that 91 percent traded without a stop-loss, sized positions too large, or chased signals without understanding context. Risk no more than 1 to 2 percent of capital per trade. Keep a trading journal. The market rewards patience and discipline — not speed or boldness.
“Markets can stay irrational longer than you can stay solvent.”
— John Maynard Keynes
How do traders confirm a breakout is real and not a false breakout?
A real breakout shows three confirmation signals: the candle closes convincingly beyond the level (not just a wick pierce), volume increases significantly on the breakout candle compared to recent average volume, and the price holds above the breakout level on a retest. Without these confirmations, the breakout has a higher probability of being a trap.
What volume increase is considered significant during a breakout?
A meaningful breakout typically shows volume at least 1.5 to 3 times the 20-day average volume. The higher the volume spike relative to the average, the stronger the conviction behind the move. Breakouts on below-average volume are suspect and frequently fail. Reliance April 2020 broke out on 3.2x average, Tata Steel November 2020 on 3.3x, and ITC July 2022 on 3.0x the trailing 20-day average.
Where should the stop-loss be placed after entering a breakout trade?
The stop-loss goes just below the breakout level for long trades (or above it for short trades). Many traders place the stop just below the last consolidation low or the support level that was broken. The key principle: if price returns inside the range, the breakout thesis is invalidated and the trade should be exited.
Which timeframe works best for breakout trading?
Breakouts on higher timeframes (daily, weekly) are more reliable because they represent stronger consensus among participants. However, intraday traders successfully trade breakouts on 15-minute and hourly charts. The critical factor is not the timeframe itself but the quality of the consolidation pattern and volume confirmation.
Why do most breakouts fail and how can traders avoid false breakouts?
Studies suggest 30 to 40 percent of breakouts fail because institutions often push price through a level to trigger retail stop-losses before reversing. Traders reduce false breakout risk by waiting for a candle close beyond the level (not entering on the initial pierce), requiring 1.5 to 3x average volume, and waiting for a successful retest of the broken level before entering.
What is the measured move target after a breakout?
The measured move technique calculates a minimum target by adding the height of the consolidation range to the breakout level. For ITC, the range height of Rs 75 (from Rs 200 to Rs 275) projected a minimum target of Rs 350. The actual rally reached Rs 492 by July 2023, illustrating that multi-year bases often overshoot the measured move.
Continue Learning
- What is a Pullback? — The natural companion to breakout trading
- Support and Resistance: The Complete Guide — The levels where breakouts happen
- Volume in Trading — Detailed look into the confirmation tool
- What is a Trend? — Context for why breakouts matter
- Trendlines — Diagonal levels for trendline breakouts
- Timeframes in Trading — Choose the right window for your breakout trades