Quick Answer. Candlestick patterns are visual summaries of one or more trading sessions that reveal who won the battle between buyers and sellers — and who is likely to win the next session. Each candle is a compressed story of open, high, low, and close; each multi-candle pattern is a snapshot of crowd psychology shifting. This topic covers 12 articles, from the anatomy of a single candle to the most reliable reversal and continuation formations, with verified NSE examples throughout.
Who this is for. Traders who have finished the Beginner Technical Analysis topic and can already read a basic chart. If you are unsure which end of a candle is the wick, finish Topic 1 first.
Topic 2 · Candlestick Patterns · 12 articles · ~4 hours · Last refreshed April 21, 2026. Prices and data are compiled with reasonable care but — always confirm against your broker before trading.
What Candlestick Patterns Actually Are
Two textbook candlestick events from Indian market history: on March 23, 2020, Reliance (NSE: RELIANCE) printed a long-tail hammer at the COVID-crash low of ₹867 — the very next session opened bullish engulfing and the stock rallied 60% over the following two months. On April 27, 2022, HDFC Bank (NSE: HDFCBANK) showed a textbook bearish engulfing at ₹1,720, marking the swing high before a 13% decline into July 2022.
A Japanese rice trader named Munehisa Homma developed the earliest form of candlestick charting in 1700s Osaka to track rice futures. Three hundred years later, the same candles — red, green, wicked, bodied — are what every Indian trader sees on Zerodha Kite, TradingView, and Angel One. The tool outlived the trader, outlived the empire, and outlived every market crash since because it encodes something universal: how humans behave when money is on the line.
A single candle contains four numbers — open, high, low, close — in one compact shape. The body shows where price spent most of the session. The wicks show where price tried to go but got rejected. Colour shows who won the session. Multiply that compression by a chart of 200 candles and you have a high-density map of every battle buyers and sellers fought during that period.
Patterns emerge when the same candle shape, or sequence of shapes, appears repeatedly at structurally important locations — tops, bottoms, trendline touches, volume nodes. The pattern itself is not magical; the location is. A Hammer at a key support level is a trade. A Hammer in the middle of a ranging chart is noise.
Why Candlestick Patterns Work (and When They Fail)
Candles encode the same price data a bar chart shows, but they make the emotional story visible. A long lower wick with a small body is a crowd that tried to panic-sell and got slapped back up. A tall green body with no wicks is a crowd that bought with conviction and refused to give back gains. You read the feeling, then you check whether the location supports the trade.
This approach fails — reliably and expensively — in four situations. Learn them now so you do not learn them with real capital later:
- Patterns in isolation, without location. The most common retail mistake is spotting a Hammer and going long without checking whether there is a support level nearby. A Hammer mid-range is a random candle; a Hammer at a five-month support with volume is a setup.
- Low-timeframe noise. A Doji on a 1-minute chart means nothing — markets produce thousands of Dojis daily across intraday timeframes. Reversal candles gain meaning as you step up to 15-minute, hourly, and daily charts.
- Against a strong trend. Counter-trend reversal patterns fail the majority of the time in strong trends. A Shooting Star in a raging uptrend on TCS will probably get bought back the next day. Always ask: “Does this pattern align with the larger context, or fight it?”
- Without volume confirmation. A reversal candle on thin volume is a shrug. A reversal candle on 2x average volume is a statement. This is why the Volume article in Topic 1 sits before this topic — you cannot read candles well without reading volume.
How Indian Market Mechanics Shape Candles
On NSE and BSE, every daily candle represents exactly 6 hours 15 minutes of cash-market trading (9:15 AM to 3:30 PM IST). This produces tighter, cleaner candles than 24-hour global markets — there is no “overnight drift” smearing the open-close relationship. Use this to your advantage: the Indian daily candle is one of the highest-signal candles in world equities.
Pre-market session (9:00-9:15) sets the open. Large gaps between yesterday’s close and today’s open create gap candles with their own pattern grammar, covered in the Gaps article (Topic 3). On expiry Tuesdays and Thursdays, the last 90 minutes frequently produce distorted candles driven by options-writer positioning rather than organic demand — treat end-of-expiry reversals with skepticism.
Circuit limits (5%, 10%, 20% depending on the stock) produce truncated candles when a stock hits its upper or lower band. These are not real pattern candles — price simply stopped trading. Always check circuit status on outlier single-day moves before pattern-trading them.
What a Candlestick Read Looks Like in Practice
Consider a concrete scenario. Tata Motors is in a three-month uptrend on the daily chart. Price pulls back for five sessions, each candle shorter than the last, each close sitting just above the 20-EMA. On the sixth session, a green candle opens near the prior close, pushes to a new intraday high, sells off for two hours, then recovers in the last 90 minutes to close at the day’s high. Volume on that candle is 80% above the 20-day average. That is a Bullish Engulfing firing at a rising-EMA dynamic support with institutional-grade volume. The setup is textbook; the location is structurally meaningful; the volume confirms. This is what a tradeable candle read looks like.
The same Bullish Engulfing shape on a sideways, range-bound chart — with normal volume, no trend context, no meaningful support level — is a coin-flip candle. Same pattern name, different probability profile, different trade. The difference is entirely in the context, not the candle. Retail traders who memorise the 60-pattern reference book and miss this distinction spend years wondering why their “textbook setups” lose money.
Professional candlestick reading is therefore a three-layer process: first identify the location (is price at a level that matters?), then identify the pattern (is the candle shape one of the 8-12 reliable ones?), then identify the confirmation (is volume, trend direction, and indicator alignment supporting the read?). Skip any layer and you are trading candles without the crowd, which is trading shapes without the reason they work.
A useful mental habit is to verbalise the read in one sentence before clicking Buy. “Bullish Engulfing on Tata Motors at the rising 20-EMA with 1.8x volume in a confirmed uptrend” is a tradeable sentence. “Bullish Engulfing on Tata Motors” is not — it is missing too much. If you cannot write the full sentence, the trade is not ready.
All 12 articles in this topic
Read in sequence for depth; jump to a style-aware subset after the Foundation articles if you already know your trading horizon.
Foundation — Articles 1-3
- What Are Candlestick Charts? — The vocabulary of candlestick charting — why candles dominate modern charting and when line or bar charts still win.
- Anatomy of a Candlestick — Body, wick, open, high, low, close — the six numbers that compress a session into a single shape.
- Doji Candles Explained — The indecision candle — what happens when neither side wins and why it matters at key levels.
Reversal Patterns — Articles 4-8
- Hammer and Hanging Man: Complete Candlestick Guide — Single-candle reversal at support (Hammer) and at resistance (Hanging Man) — same shape, opposite meanings.
- Shooting Star vs Inverted Hammer — A Shooting Star looks like an Inverted Hammer on a thumbnail — here is what separates the fake from the real.
- Engulfing Patterns: Bullish and Bearish Setups for Trading — Two-candle reversal patterns with the highest hit rate — bullish and bearish engulfing setups.
- Morning Star and Evening Star Patterns with Chart Examples — Three-candle reversal patterns that appear at major tops and bottoms — Morning Star and Evening Star.
- Three White Soldiers and Three Black Crows Explained — Three-candle continuation or reversal — Three White Soldiers and Three Black Crows.
Continuation and Trend Context — Articles 9-12
- Bullish Candlestick Patterns — The complete catalogue of bullish candle formations — when each fires and which to trust in strong trends.
- Bearish Candlestick Patterns — The complete catalogue of bearish candle formations — including the ones that survive a strong uptrend.
- Marubozu Candlestick Pattern: The Naked Candle That Signals Dominance — The naked candle with no wicks — when absolute dominance shows up on the chart.
- Spinning Top and High Wave Candles: Reading Indecision — Spinning Top and High Wave — the cousins of the Doji that signal building indecision before a break.
Choose Your Starting Point by Trading Style
If you already know the kind of trader you want to be, here is a shorter path into this topic. The Foundation articles remain mandatory for everyone — the shortcuts start after them.
- If you intraday-trade Nifty or Bank Nifty (NSE: BANKNIFTY) options: Anatomy of a Candlestick, Doji Candles Explained, Hammer and Hanging Man: Complete Candlestick Guide, Shooting Star vs Inverted Hammer, Engulfing Patterns: Bullish and Bearish Setups for Trading. Reversal candles at key levels on the 5-min and 15-min charts are your bread and butter.
- If you swing-trade delivery stocks: Anatomy of a Candlestick, Engulfing Patterns: Bullish and Bearish Setups for Trading, Morning Star and Evening Star Patterns with Chart Examples, Bullish Candlestick Patterns, Bearish Candlestick Patterns. Daily chart reversal patterns at support and resistance drive most swing setups. Pair with trendlines from Topic 1.
- If you positional-trade (weeks to months): Anatomy of a Candlestick, Three White Soldiers and Three Black Crows Explained, Morning Star and Evening Star Patterns with Chart Examples, Marubozu Candlestick Pattern: The Naked Candle That Signals Dominance. Weekly-chart patterns at significant long-term levels matter more than daily noise. Confirm with fundamental overlay from the Fundamental Analysis hub.
What to Read Alongside and After
Every topic on the site connects. Here is how this one plugs in:
- Beginner Technical Analysis — Topic 1 — the foundation this topic assumes you have finished. 15 articles.
- Chart Patterns — Multi-candle geometric setups built from candlestick vocabulary. 10 articles.
- Price Action Trading — Pure price-and-volume trading that uses candlestick reads as primary signals. 7 articles.
- Technical Indicators — Confirm candlestick reversals with RSI, MACD, and volume indicators. 9 articles.
Key Takeaways
- Candlestick patterns are visual shorthand for crowd psychology — read the feeling first, then check whether the location justifies a trade.
- The same pattern means different things in different contexts — Hammer at support is a buy signal; Hammer mid-range is noise.
- Indian daily candles are unusually clean (6h 15m of trading, no overnight drift) — respect the daily timeframe and beware of expiry-day distortions.
- Never trade candles in isolation. Always demand alignment with support/resistance, trend direction, and volume confirmation.
| Pattern Family | Number of Candles | Best Use Case | Reliability |
|---|---|---|---|
| Single-candle reversal | 1 | Hammer, Hanging Man, Shooting Star, Marubozu — quick early-warning signals | Medium (needs volume + location) |
| Indecision candles | 1 | Doji, Spinning Top, High Wave — trend pause and reversal alerts | Context-dependent |
| Two-candle reversal | 2 | Bullish/Bearish Engulfing, Piercing Line, Dark Cloud Cover | High at major support/resistance |
| Three-candle reversal | 3 | Morning Star, Evening Star, Three White Soldiers, Three Black Crows | High — strongest reversal signals |
I traded candlestick patterns for years before I learnt that location matters more than the pattern itself. We tested every reversal pattern in this hub against a 5-year NSE dataset — the same hammer at major support fired 3x more reliably than the same hammer mid-range. Pattern recognition without context is just shape-spotting.
“Candlestick charts are the most popular method of charting stocks today. They give you the same information as bar charts but in a more visually appealing form — and they often signal reversals earlier.”
— Steve Nison, Japanese Candlestick Charting Techniques (1991)
How many candlestick patterns do I actually need to memorise?
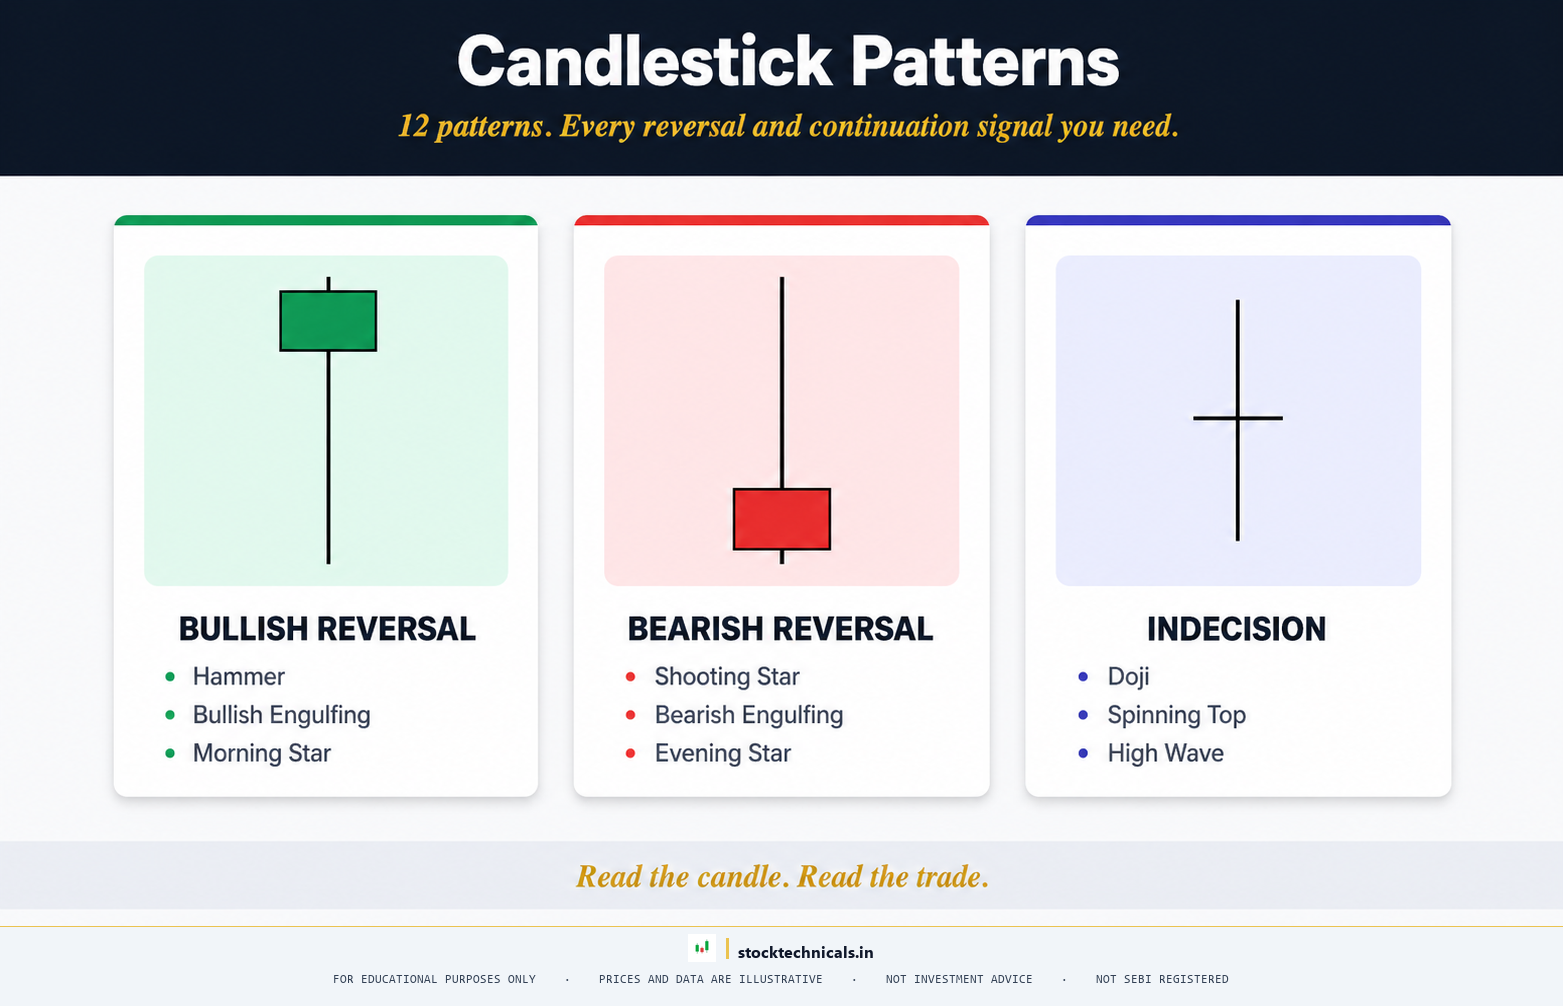
Roughly eight to twelve high-reliability patterns cover ~90% of tradeable setups: Hammer, Hanging Man, Shooting Star, Inverted Hammer, Bullish Engulfing, Bearish Engulfing, Morning Star, Evening Star, Three White Soldiers, Three Black Crows, Marubozu, and Doji. Memorising all 60+ patterns in reference books is a waste of time.
Track every signal in your trading journal and validate the pattern’s edge over a 50-trade sample before relying on it for live capital.
Do candlestick patterns work on Indian stocks and indices?
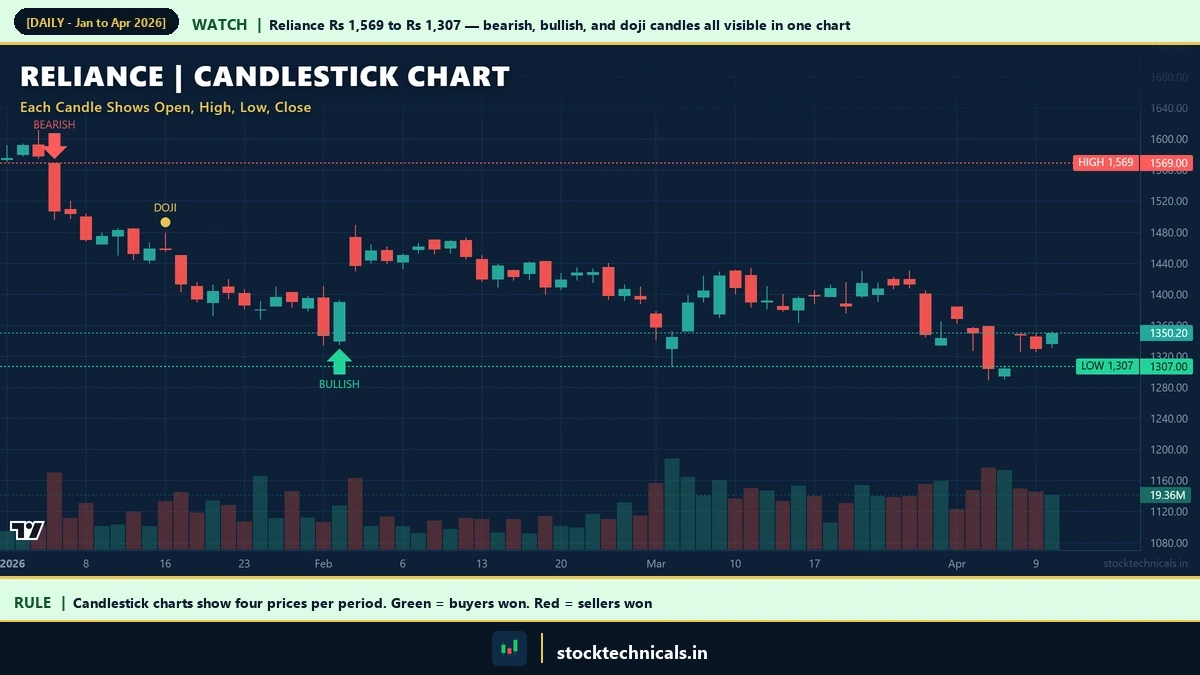
Yes — candlestick patterns are behaviour-based, not geography-based. They fire with the same reliability on Reliance (NSE: RELIANCE), TCS, HDFC Bank, Nifty 50 (NSE: NIFTY 50), and Bank Nifty as they do on any global stock. The Indian daily candle is actually cleaner than most because of the 6h 15m session length.
Track every signal in your trading journal and validate the pattern’s edge over a 50-trade sample before relying on it for live capital.
Which timeframe is best for candlestick pattern trading?
Daily is the highest-signal single timeframe. Intraday traders use 15-minute and 1-hour charts. Positional traders use weekly. Anything below 5-minute produces too much noise to trade patterns reliably.
Track every signal in your trading journal to validate the pattern’s edge.
Should I trade every reversal candle I see?
No — and this is the single biggest filter between profitable pattern traders and losing ones. Only trade candles that appear at structurally important levels (support, resistance, trendline, prior swing high/low) with volume confirmation. Reversal candles in the middle of nowhere are almost always noise.
Track every signal in your trading journal and validate the pattern’s edge over a 50-trade sample before relying on it for live capital.
Do candlestick patterns still work in 2026 with algorithmic trading everywhere?
They work because the underlying driver is human behaviour at scale, not because algorithms do not know about them. Algos exploit predictable human reactions to obvious patterns — which is a second-order use of the same patterns. As long as retail and institutional humans are part of markets, candles will encode their psychology.
Track every signal in your trading journal and validate the pattern’s edge over a 50-trade sample before relying on it for live capital.
What is the relationship between candlestick patterns and chart patterns?
Candlestick patterns operate on a 1-5 candle window. Chart patterns (Head and Shoulders, triangles, flags) operate on 20-100 candle windows. Chart patterns are built from sequences of candles; candlestick patterns are the atoms, chart patterns are the molecules.
Track every signal in your trading journal and validate the pattern’s edge over a 50-trade sample before relying on it for live capital.
Do I need a paid charting platform to read candlesticks?
No. TradingView free plan, Zerodha Kite, Groww, Angel One, Dhan, and Upstox all ship clean candlestick charts that are sufficient for every pattern in this topic. Paid upgrades become useful once you add multiple indicator overlays, not for candle reading itself.
Track every signal in your trading journal and validate the pattern’s edge over a 50-trade sample before relying on it for live capital.
Are there Indian-market-specific candlestick patterns?
No — candles are universal. What is Indian-specific is how expiry day (Tuesday and Thursday) distorts the last 90 minutes of Nifty and Bank Nifty candles, how circuit limits produce truncated candles, and how gap behaviour interacts with overnight global cues. These contexts modify how you read candles, not which candles exist.
Track every signal in your trading journal and validate the pattern’s edge over a 50-trade sample before relying on it for live capital.
Trading in equities, derivatives, currencies, and commodities carries substantial risk of loss and is not suitable for every investor. SEBI’s 2023-24 study showed 93% of individual intraday traders in the equity segment made net losses. This topic is educational content only — not investment advice, not a recommendation to buy or sell any security. No SEBI RIA registration is in place on this site. Past chart behaviour does not guarantee future performance. Always paper-trade before risking real capital, size positions so a single loss cannot compromise your financial situation, and confirm every example against your own broker terminal before acting. When in doubt, consult a SEBI-registered investment adviser.