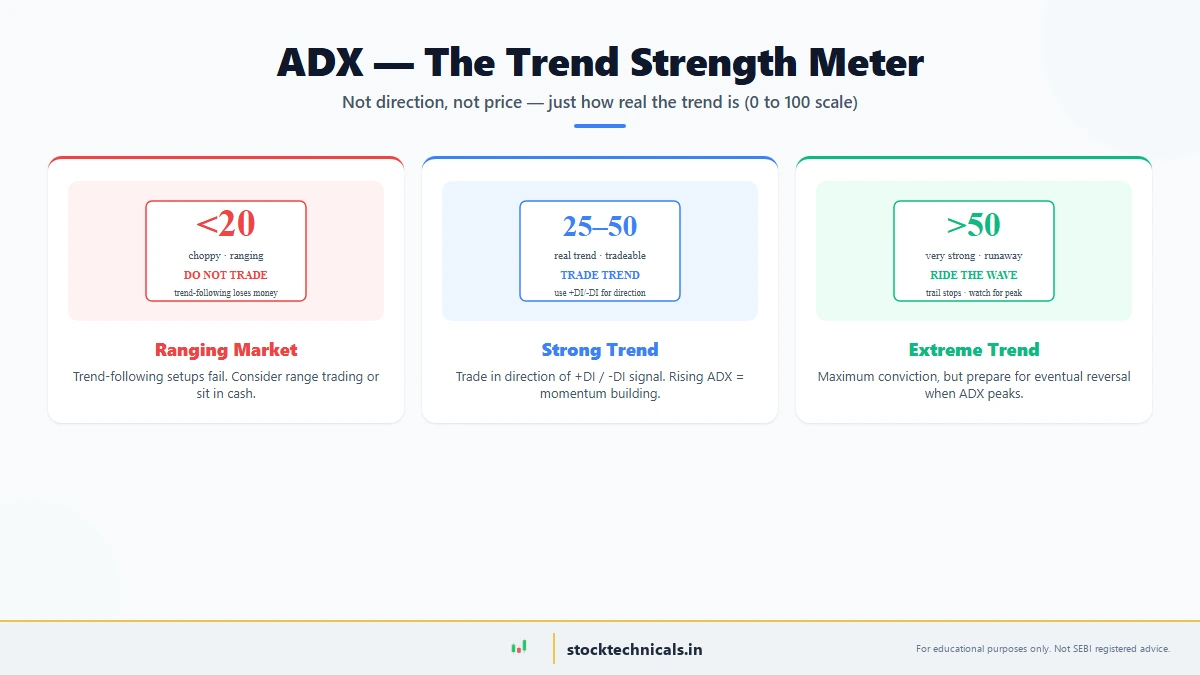
Quick Answer: ADX answers the question every trader asks: “Is this trend real, or will it reverse?” It measures trend strength (not direction) on a 0-100 scale. ADX above 25 = strong tradeable trend · below 20 = choppy ranging market where trend-following loses money.
Published February 24, 2026 · Last refreshed April 27, 2026. Prices and data are compiled with reasonable care but — always confirm against your broker before trading.
Key Takeaways
- ADX measures trend strength (0-100 scale) — direction comes from +DI and -DI, not ADX itself.
- ADX > 25 rising = real trend, take directional trades. ADX < 20 = range-bound, skip trend-following setups.
- Falling ADX from peak means the trend is losing steam — prepare to trail stops or take partial profits.
- +DI above -DI = uptrend (trade longs); -DI above +DI = downtrend (trade shorts). Confirm with ADX > 25.
- Works on any timeframe — 14-period default. Use 9-period for 5-minute scalping, 21-period for weekly charts.

You’ve learned to identify trends with EMAs, you understand how moving averages work, and you’ve seen how RSI helps you spot overbought and oversold conditions. But here’s the challenge every trader faces:
Not all trends are created equal.
Some trends are powerful and sustained. You get in, the price shoots up, and you’re riding a wave. Other trends look like they’re developing, but they collapse after a few candles. You catch a tiny piece and get stopped out. Still others are choppy and sideways — they don’t really trend at all.
The difference between a strong, profitable trend and a weak, money-losing “fake trend” comes down to one thing: trend strength. And that’s exactly what the Average Directional Index (ADX) measures.
ADX is the answer to a question every trader asks: “Is this trend real, or will it reverse in the next two candles?” By telling you the strength of a trend — not the direction — ADX filters out weak moves and helps you avoid boring, choppy markets where your stop losses keep getting hit.
In this article, you’ll learn what ADX is, how it works alongside its companion indicators (the Directional Index lines +DI and -DI), how to read the ADX value from 0-100, why the 25 level matters, how to spot trend changes before they happen, and how to combine ADX with RSI, MACD, and other indicators for stronger signals.
Who is this article for? Traders ready to filter their trades by trend strength and avoid wasting time in choppy, ranging markets.
What is the ADX Indicator?
The Average Directional Index (ADX) is a technical indicator that measures the strength of a trend, not the direction. It was created by legendary trader Welles Wilder Jr. (the same person who invented RSI and the Average True Range — ATR) and published in his 1978 book “New Concepts in Technical Trading Systems.”
ADX is part of a three-component system called the Directional Movement System:
- +DI (Positive Directional Index): Shows the strength of upward price movement
- -DI (Negative Directional Index): Shows the strength of downward price movement
- ADX (Average Directional Index): Shows the overall trend strength (regardless of direction)
- High: The highest price during the candle
- Low: The lowest price during the candle
- Previous candle’s high/low: The reference point for direction
- Taking the average +DM over 14 periods (default)
- Taking the average -DM over 14 periods
- Dividing each by the True Range (ATR concept) to normalize
- Multiplying by 100 to get a 0-100 scale
- When +DI and -DI are far apart → strong trend → high ADX
- When +DI and -DI are close together → weak trend → low ADX
- When +DI and -DI are nearly equal → no trend → ADX near 0
- +DI would be high
- -DI would be low
- ADX would be high (strong uptrend)
- Day 1: +DI moves up, but still below -DI
- Day 2: +DI crosses above -DI. ADX starts to rise to 22.
- Filter by ADX: Is ADX above 25? Is there a trend? Yes? Continue.
- Direction by +DI/-DI: Is +DI above -DI (uptrend) or -DI above +DI (downtrend)? This tells you which way to trade.
- Action on crossovers: When +DI and -DI cross, and ADX is above 25, this is a high-probability signal.
- +DI line: Usually green or blue
- -DI line: Usually red
- ADX line: Usually black or a neutral color
- Is it above 25? Trend confirmed. Trade with the trend.
- Is it below 20? Choppy market. Avoid directional trades.
- Is it between 20-25? Trend developing. Wait for ADX to break above 25.
- Is +DI above -DI? Uptrend. Look for buy signals.
- Is -DI above +DI? Downtrend. Look for sell signals.
- Is ADX line pointing up? Trend strengthening. High-quality setup.
- Is ADX line pointing down? Trend weakening. Exit trades or reduce position.
- Open the chart for Nifty 50 (NSE: NIFTY 50), Bank Nifty, or any stock
- Click “Indicators” → search for “ADX”
- Add with default settings (14 period)
- You’ll see +DI (green), -DI (red), ADX (black) in the lower window
- Search for ADX in the indicator library
- Click “Add to Chart”
- Settings: Period = 14 (default)
- Overlay style: choose 3-line display
- ADX line rising, above 25
- +DI line well above -DI
- Price making higher highs and higher lows
- Candles closing near the top of their range
- Enter long on pullbacks to the 20 EMA or support
- Exit on ADX crossover (ADX turns down) or price breaks below support
- Let winners run; don’t chase candles
- ADX line rising, above 25
- -DI line well above +DI
- Price making lower highs and lower lows
- Candles closing near the bottom of their range
- Enter short on rallies to the 20 EMA or resistance
- Exit on ADX crossover or price breaks above resistance
- Size your position smaller than in uptrends (downtrends are often sharper)
- ADX below 20
- +DI and -DI constantly crossing or equal
- Price bouncing between clear support and resistance
- Choppy, sideways action with no conviction
- Ignore trend-following signals
- Instead, buy at support (where -DI crosses above +DI) and sell at resistance (where +DI crosses above -DI)
- Use tight stops; exits will get hit frequently
- Consider sitting out entirely until ADX breaks above 25
- ADX rising toward 25 but not yet above it
- +DI and -DI moving closer together or spreading
- Price starting to show more directional bias but still choppy
- This is a setup zone, not a trade zone
- Wait for ADX to break decisively above 25
- Position yourself to enter on the next confirmation
- Don’t force trades here; patience rewards you
- ADX > 25 (trend confirmed)
- RSI < 70 (not yet overbought; room to run)
- Price is above 20 EMA (for uptrends) or below 20 EMA (for downtrends)
- +DI > -DI (for uptrends) or -DI > +DI (for downtrends)
- If ADX > 25 and MACD crosses, the signal is strong. Enter immediately.
- If ADX < 20 and MACD crosses, the signal is weak. Skip it or use a smaller position.
- If ADX 20-25 and MACD crosses, wait for ADX to rise above 25, then enter.
- Day 1: +DI crosses above -DI. MACD signal line is approaching. ADX is still 16.
- Day 2: MACD line crosses above signal line. +DI is now clearly above -DI. ADX rises to 22.
- Day 3: ADX breaks above 25. This is confirmation.
- Only trade when ADX is above 25. Below 25, there’s no trend. Don’t fight the market by trying to trade choppy action. Wait.
- Trade in the direction of the dominant DI line. If +DI is above -DI, only take longs. If -DI is above +DI, only take shorts. Ignore signals that go against the dominant DI.
- Watch the slope of the ADX line. If ADX is falling, the trend is weakening. Exit trades or reduce position, even if price is still moving. A falling ADX tells you the trend is losing power.
- Use ADX as a filter, not a signal. ADX doesn’t tell you when to enter — only whether you should enter. Combine it with price action, moving averages, or another indicator for entry timing.
- Be cautious when ADX is above 50. Extremely strong trends often mean extended moves are coming, and reversals can be sharp. Take profits early or move your stop to break-even.
The ADX Checklist: Before Every Trade
Before you enter a trade based on trend-following, ask:
- [ ] Is ADX above 25? (No = wait)
- [ ] Is ADX rising or at least stable? (Falling = don’t enter)
- [ ] Is +DI > -DI (for longs) or -DI > +DI (for shorts)? (No = wrong direction)
- [ ] Has +DI/-DI already crossed? (Yes = stronger signal)
- [ ] Is price above/below the 20 EMA? (For additional confirmation)
- [ ] Have I set a stop loss below the most recent swing low (for longs)? (No = set it)
- [ ] Is this a 1R:2R risk/reward or better? (No = skip the trade)
If all checks pass, enter. If even one fails, wait.
Common ADX Mistakes to Avoid
- Trading below ADX 20 (choppy markets). You’ll get whipsawed constantly. Patience is the currency here. Wait for ADX to rise above 25.
- Ignoring the direction of the DI lines. ADX is high, so you buy, but -DI is above +DI (downtrend). You’re buying in the wrong direction. Always check which DI is dominant.
- Entering when ADX is falling, even if it’s still above 25. Falling ADX = weakening trend. The move is losing power. Wait for ADX to stabilize or start rising again.
- Using ADX alone as a signal. ADX tells you “there is a trend” but not “enter here.” Combine it with price action, moving averages, or candlestick patterns for entry timing.
- Holding on to a position when ADX drops below 25. If you’re in a trend trade and ADX falls below 25, the trend is over. Exit immediately, even if price is still profitable. Trends end fast.
ADX vs RSI vs Supertrend: Which Is Best?
| Indicator | Best For | Weakness |
|---|---|---|
| ADX | Filtering weak/choppy markets; confirming trend strength | Doesn’t give entry signals; lags at trend start |
| RSI | Spotting overbought/oversold; momentum trading | Gives false signals in choppy markets; can stay overbought in strong trends |
| Supertrend | Quick entry/exit signals; visual trend lines | Can get whipsawed in ranges; too many false signals without ADX |
When to use each:
- Use ADX as your primary filter (is there a trend?)
- Use RSI to time entries (is the move tired?)
- Use Supertrend for visual support/resistance
- Best combination: ADX (filter) + RSI (entry) + Supertrend (stop loss)
How to Set ADX on TradingView, Zerodha Kite, and Angel One
TradingView (Web and App)
- Open your chart (any timeframe)
- Click the “+” button (Insert Indicator)
- Search: “ADX”
- Click “Add to Chart”
- Default settings: Period = 14 (perfect for most traders)
- Optional: Change colors for +DI, -DI, ADX for clarity
Zerodha Kite
- Open the chart
- Click “Indicators” (on the left menu)
- Search: “ADX”
- Click to add
- Period = 14 (default)
- You’ll see +DI, -DI, and ADX in a separate window below
Angel One
- Open the chart
- Click “Studies” or “Indicators”
- Search “ADX”
- Add to chart
- Default period: 14
- Adjust the level lines if you want (25 is already marked on most platforms)
All platforms use the same default 14-period calculation. Start with this and only change it if you’re trading very short timeframes (1-minute scalping might need 9-period).
What’s the best period for ADX?
Use the 14-period ADX for most timeframes — this is the default Welles Wilder chose. For 5-minute scalping, try 9-period for faster response. For weekly charts, use 21-period. Start with 14 and only adjust if signals feel too slow or too fast for your style.
Can ADX be used on intraday charts?
Yes. ADX works on any timeframe. A 5-minute ADX is as valid as a daily ADX — they just measure trend strength at different scales. Daily ADX tells you the major swing trend; 5-minute ADX tells you the immediate intraday trend. Apply the same rules on both.
What if ADX is exactly 25?
ADX = 25 is borderline. Technically it counts as ‘above 25’, but wait one or two candles to confirm ADX pushes higher to 26+. This patience prevents many false-signal losses when a trend looks like it’s starting but actually stalls.
Can I use ADX for scalping Bank Nifty?
Yes. Use 1-minute or 5-minute charts with 9-period ADX. Lower the threshold to ADX > 20 instead of 25 since scalping moves fast. Combine with RSI or MACD for quicker entry signals — ADX alone is too slow for pure scalping timeframes.
Can ADX predict reversals?
No. ADX predicts weakening trends, not reversals. When ADX falls below 25, the trend is dying and a reversal may come — but it is not a reversal signal itself. Use falling ADX alongside price action or RSI divergence for actual reversal confirmation.
Combining ADX with Other Tools: The Complete Checklist
For the strongest trades, use ADX as your filter and combine it with multiple confirmation tools:
- ADX (Filter): Is ADX > 25? Trend confirmed.
- Moving Average (Entry): Price bounces off 20 EMA (entry signal).
- RSI (Confirmation): RSI < 70 (room to run) or RSI 40-60 (neutral, not extreme).
- Support/Resistance (Stop Loss): Set stop below the most recent swing low (for longs).
- Risk/Reward (Position Size): Make sure it’s 1R:2R or better before entering.
When all five align, you have a high-probability setup. Don’t rush; wait for all five.
Next Step: Fibonacci Retracements
You’ve mastered ADX, which filters choppy markets and confirms trends. The next step is learning Fibonacci Retracements — the mathematical tool that predicts exactly where price will pull back within a trend, so you can enter at the perfect time.
Self-Assessment Quiz
Test the understanding of ADX, +DI/-DI, and trend-strength concepts covered in this article.
Test Your Knowledge
Q1: What does ADX measure?
Q2: An ADX reading above 25 means:
Q3: Which ADX component tells you trend DIRECTION?
Q4: What should you do when ADX falls back below 25 on an open trade?
Q5: What is the default ADX period used by Welles Wilder?
The Bottom Line on ADX
ADX is the market’s strength meter, not a direction predictor. It excels at filtering choppy, ranging markets where trend-following fails and confirming when real trends exist. But ADX lags at trend starts and gives no entry signals — it is a filter, not a signal generator. Combine it with RSI, MACD, or moving averages for complete setups. The one thing every trader should remember: ADX above 25 with rising slope is permission to trade trends; below 20 is permission to sit in cash.
ADX confirms when trends are real, but it doesn’t prevent losses. Always size positions to risk only 1-2% per trade, set a stop loss before entry, and never trade capital you can’t afford to lose. Strong trends can reverse — the market owes you nothing.